

government
Government
Summary
This collection of data includes the following indicators, dates, and sources:
passports circulating, 1989-2015, Dept. of State
passports issued, 1974-2015, Dept. of State
licensed drivers, 1960-2014, Dept. of Transportation
biometric ID usage rates in hospitals, 2008-2012, Raymonde Charles et al.
voting rate, 1978-2014 & 1964-2014, Census Bureau
voter registration, 1966-2014 & 1828-1956, Census Bureau & Congressional Quarterly Press
people working in government, 2014/2024, BLS
federal laws passed, 1973-2015 & 1947-2013, GovTrack & Brookings Inst.
Findings
Personal Identification
Passports
U.S. Passports Circulating (1989-2015) and Issued per Year (1974-2015)
Note: As of 1996, passports issued statistics are tabulated for the fiscal year.
Src:
US Department of State. Accessed October 17, 2016.
“Passports Statistics.”
Note:
The Department of State has been issuing exclusively biometric/electronic passports since 2007.
Here’s a map showing the state-by-state distribution of Americans with active passports, for the year 2013.
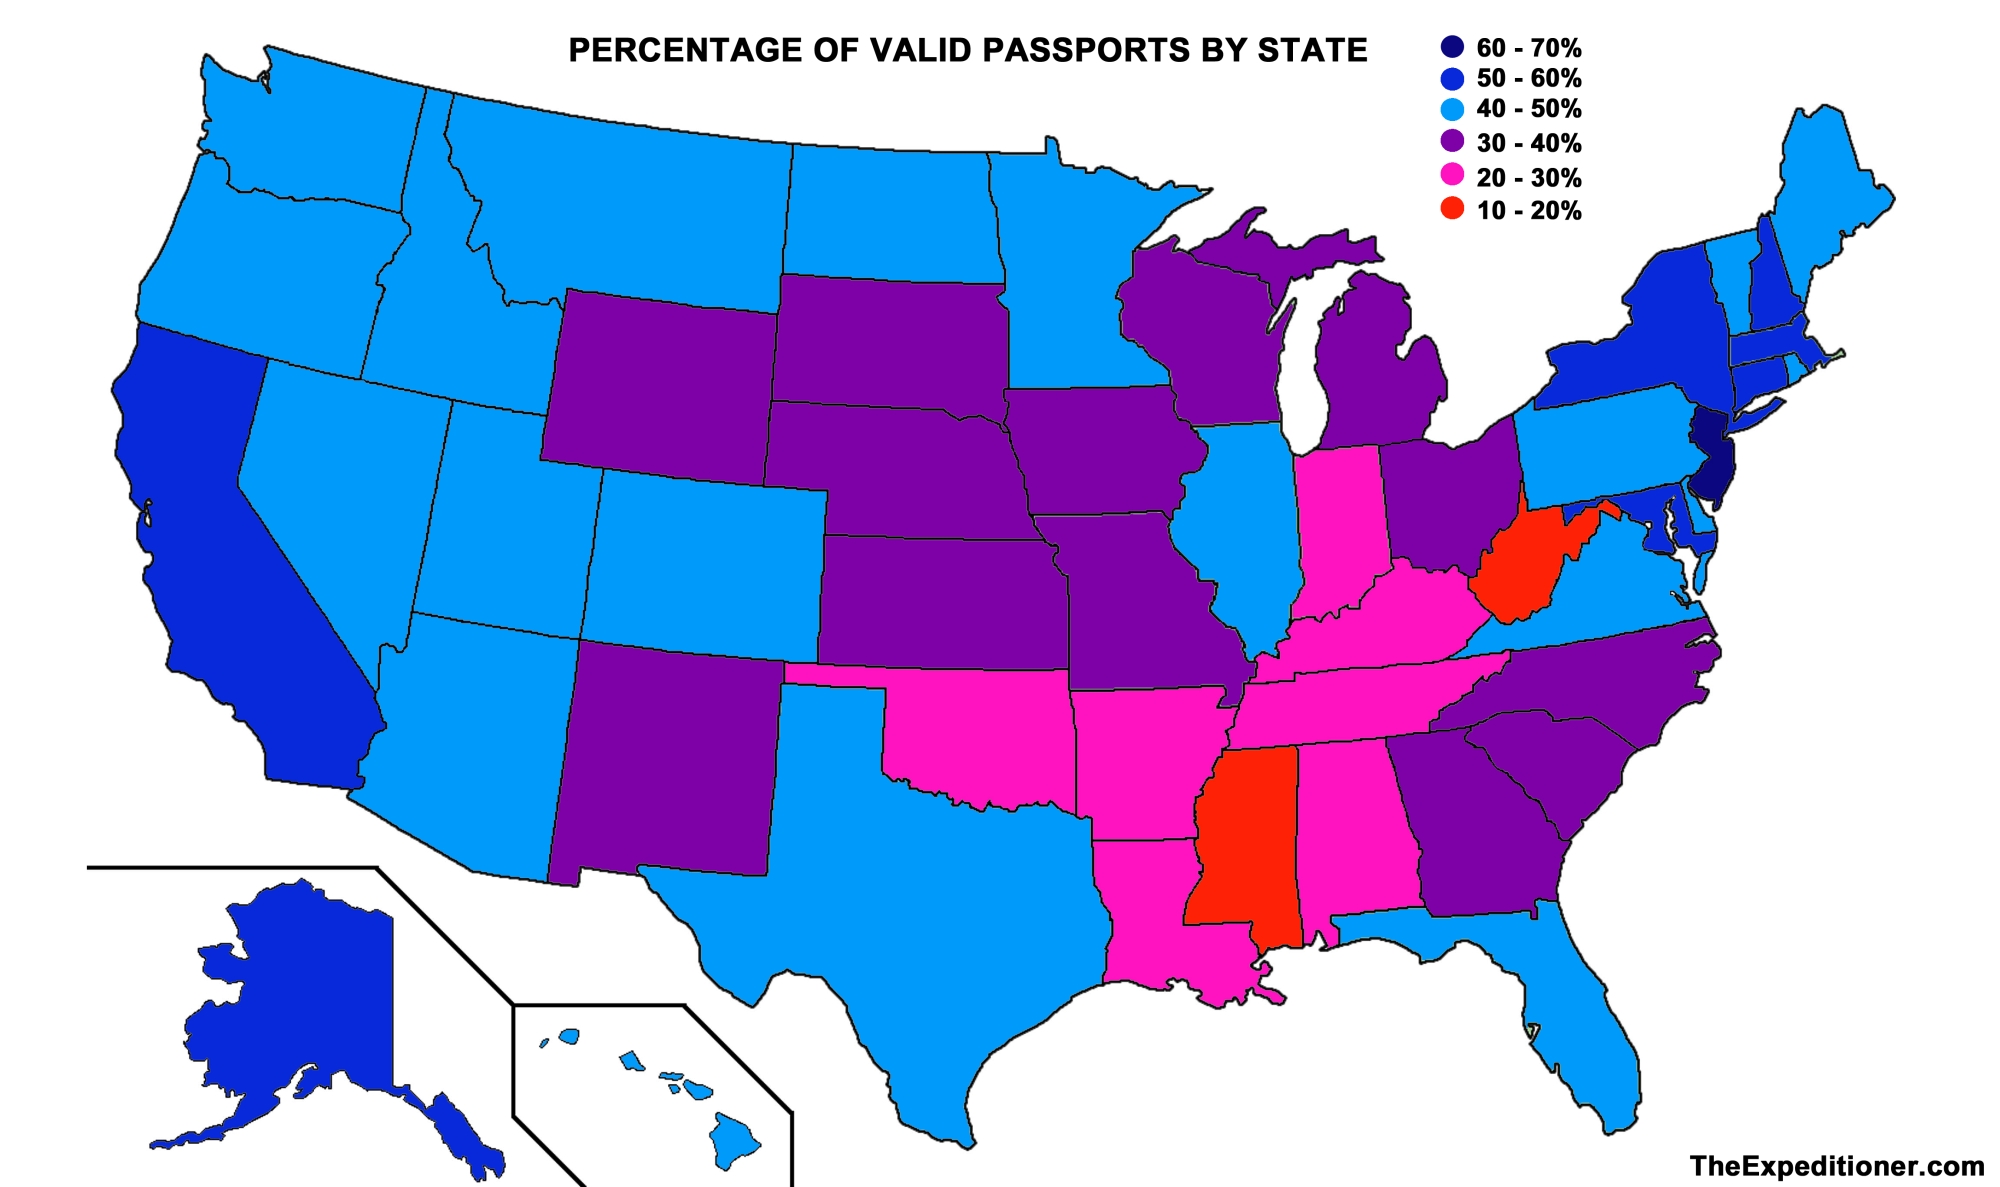
The map is based on the State Department data given above for the number of passports issued in the last 10 years, divided by the total US population (per the Census Bureau, minus the ~12 million undocumented residents and ~13 million legal permanent residents who cannot obtain passports).
Src:
Matt Stabile. February 2014.
“How Many Americans Have A Passport?”
The Expeditioner.
*
Licensed Drivers, Vehicle Registrations, and Resident Population (In Millions)
1960-2014
Src:
Department of Transportation. January 2016.
“Highway Statistics 2014.”
*
Gov’t Issued ID
The 2012 American National Election Survey asked survey respondents about what type of government-issued photo identification they possessed. The survey indicates that 6.3% of respondents do not have a valid, government-issued photo ID.
These are the total weighted percentages in responses.
Question: Do you have a non-expired Driver’s License?
Variable name: dem3_driver
Has: 83.9%
Does not have: 15.4%
Don’t know: 0%
Refused: 0.6%
Total number of respondents: 6,112
Question: Do you now have a non-expired U.S. passport, or do you not have one?
Variable name: dem3_passport
Has: 40.8%
Does not have: 58.4%
Don’t know: 0.2%
Refused: 0.6%
Total number of respondents: 5,914
Question: (If no valid driver’s license or passport) Do you have another form of non-expired, government issued photo ID, such as a state-issued ID or military ID?
Variable name: dem3_govtid
Has: 5.9%
Does not have: 6.3%
Inapplicable: 87.3%
Don’t know: 0%
Refused: 0.5%
Total number of respondents: 5,914
Src:
American National Election Studies. May 28, 2015.
“User’s Guide and Codebook for the ANES 2012 Time Series Study.”
The University of Michigan and Stanford University.
Pp. 732-734.
Other source notes:
Description: Demographics3
Position: Pre-election survey, section-item no. 62.7-12, 62.7-13
NOTE: ANES confirmed by email that 2012 was the first year this data was collected. The same questions will be asked in the 2016 post-election survey, and results will be published at the end of the first quarter of 2017.
Although ANES has not collected any previous data on gov’t-issued ID possession rates, a couple other surveys have been conducted recently, in the context of voter ID requirements. For example:
2006 — the Brennan Center (NYU School of Law) commissioned a survey (of 987 voting-age Americans) finding that 11% of respondents did not have ready access to government-issued photo ID.
[Src]
2001 — The Carter-Ford Commission on Election Reform found that 6-11% of voting-age citizens lacked state-issued photo ID.
[Src]
*
Biometric Data Tracking
Biometric Update is a research and news source with a pretty wide range of news articles, research papers, white papers, and overviews describing current biometric identification technologies. The Government Purchasing news articles may be of particular interest. The statistics presented on the site are largely industry-focused.
search terms:
biometric identification adoption rates
mobile driver’s license (Iowa pilot in 2016)
e-driving licenses
e-passports
border management
national IDs
*
White Paper:
Rawlson O’Neil King. June 2014.
“National and Civil ID White Paper.”
Biometrics Research Group
Gives an overview of the format and use-cases for ePassports, eIDs, and electronic voting enrollment. Briefly describes (emphasizing shortcomings) the US social security number and driver license with regard to their use as identification.
*
Research report:
Smithers Pira. July 2016.
“The Future of Personal ID to 2021.”
Contact: Stephen Hill shill@smithers.com; Josh Rabb jrabb@smithers.com
Note: This research firm focuses on packaging, paper and print industry supply chains.
Tables & Figures:
Trends in personal identification
The evolution of the ePassport
Market forecast of for personal ID by technology 2016-2021
Unit forecast of (2016-2021):
traditional MRP
ePassports
traditional national ID
eID
driving licences
traditional visas
eVisas
health cards
electoral systems
vital documents
The evolving landscape of personal identification 2016-2021
I have NOT established contact with this firm to inquire about data sharing, but, as noted above, the Department of State has been issuing exclusively biometric/electronic passports since 2007.
*
Research report:
TechNavio, May 2016
“Biometrics Market In North America 2016-2020”
Contact: americas@technavio.com
Excerpts:
Market research analysts at Technavio have predicted that the biometrics market in North America will grow steadily at a moderate CAGR of more than 12% by 2020.
…
Owing to an increase in investments and the early adoption of biometric technology, the biometric market in North America will have a constant demand from the government sector. According to this market research analysis, this segment will account for about 40% of the total market share by 2020 and will dominate the market throughout the forecast period.
*
Research report:
TechNavio, October 2015
“Global Law Enforcement Biometrics Market 2015-2019”
Contact:
Technavio’s analysts forecast the global law enforcement biometrics market to grow at a CAGR of 13.35% over the period 2014-2019.
*
Research report:
TechSci Research, May 2016.
“Global Biometrics Market By Type (Fingerprint Recognition, Facial Recognition, Hand/Palm Recognition, Iris Scanner, Voice Recognition, Vein Scanner & Others), By End Use Sector, By Region, Competition Forecast and Opportunities, 2011 – 2021.”
Includes market size and forecast value for North American Government applications (as well as other regions and sectors.
*
Data on the use of biometric information by government agencies is fairly hard to come by. Aside from the few reports mentioned above, I’ve found some data on the adoption rates of biometric data within US hospitals. Not sure if this might have any implications for adoption rates in other sectors, like government.
Excerpts:
Biometric devices and their accompanying software in healthcare institutions permit the automatic authentication of patient and provider identity for different purposes such as secure EHR system access, and patient verification31. The most common hospital implementation of biometrics are the use of fingerprint and iris scanning32, 33. The unique authentication methods of biometrics make it difficult to mismatch and forge identities since no two irises or fingerprints are the same.
The use of fingerprint scanning had an average annual adoption increase of 1.23% per year from 2008, leading to a total of 15.9% (n=871) adoption within all hospital respondents (n=5467) in 2012. Iris scanning technology has an average annual adoption rate of 0.02% from the same time frame, and is only currently being used in 13 hospitals (0.02%) in 2012. Only 2.49% (n=136) hospitals in 2012 plan to expand or adopt the fingerprint technology in the following years, in contrast to only 12 hospitals (0.22%) for iris scanning.
Low adoption may be due to the costs in implementing biometrics within existing EHR systems and workflows.
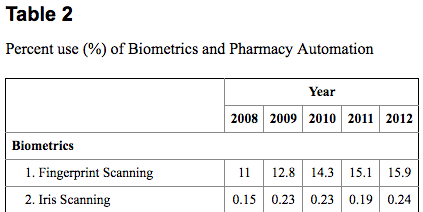
Src:
Raymonde Charles Y. Uy et al. November 2015.
“The State and Trends of Barcode, RFID, Biometric and Pharmacy Automation Technologies in US Hospitals.”
AMIA Annual Symposium Proceedings Archive.
*
Examples of companies/technologies currently being deployed in the US:
“Unisys integrates NEC’s facial recognition software in CBP project at JFK airport.”
Biometric Update. May 2016
Excerpt:
NEC‘s top NIST rated facial matching technology will be used to compare the image taken during the normal inspection process to the image stored on the traveler’s e-passport. The initial deployment will apply to first time Visa Waiver Program (VWP) travelers and returning U.S. citizens with e-Passports. … Unisys worked together with NEC to develop this entry/exit screening solution, which allows CBP officers to capture a live facial image. The facial image from electronic passports is then compared to the live captured image. If the images do not match, travelers may be subject to additional screening by CBP officers.
***
Voting Registration and Rates
Voting Rates in Congressional and Presidential Elections: 1978 to 2014
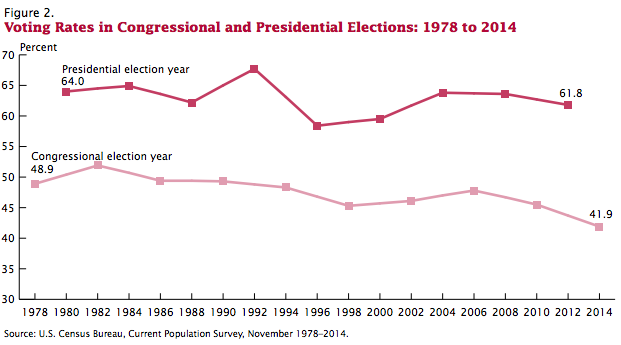
Src:
U.S. Census Bureau.
“Who Votes? Congressional Elections and the American Electorate: 1978–2014.” July 2015.
Figure 2, P. 4.
*
The Current Population Survey collects data on voting and voter registration in November of even-numbered years, and has done so since 1964. It provides information about voting and registration by many characteristics, including age, sex, race, and education. Because the data are from a survey, they are subject to sampling error.
Src:
U.S. Census Bureau. February 2012.
“Table A-1. Reported Voting and Registration by Race, Hispanic Origin, Sex, and Age Groups: November 1964 to 2014 (NOTE: Voting rates corrected February 2012).”
Historical Reported Voting Rates.
*
Voter Turnout in Presidential Elections: 1828 – 2012
Year % Turnout of Voting Age Population
1828 57.6%
1832 55.4%
1836 57.8%
1840 80.2%
1844 78.9%
1848 72.7%
1852 69.6%
1856 78.9%
1860 81.2%
1864 73.8%
1868 78.1%
1872 71.3%
1876 81.8%
1880 79.4%
1884 77.5%
1888 79.3%
1892 74.7%
1896 79.3%
1900 73.2%
1904 65.2%
1908 65.4%
1912 58.8%
1916 61.6%
1920 49.2%
1924 48.9%
1928 56.9%
1932 56.9%
1936 61.0%
1940 62.5%
1944 55.9%
1948 53.0%
1952 63.3%
1956 60.6%
Note: Voting Age Population includes those ineligible to vote such as felons. Because of this, V.A.P. figures are naturally lower than if the Voting Eligible Population (V.E.P.) is used as the denominator.
Note: Figures for 1960-2012 are also given on the source page, which cites data compiled by Gerhard Peters from data obtained from the Federal Election Commission.
Src:
Gerhard Peters and John T. Woolley. Accessed October 24, 2016.
“The American Presidency Project: Voter Turnout in Presidential Elections 1828-2012.”
Citing:
Sources:
(1824-1956) – Lyn Ragsdale, Vital Statistics on the Presidency (Washington, D.C.: Congressional Quarterly Press, 1998), 132-38.
***
Number of People Working in Gov’t 2014/2024
Src:
Bureau of Labor Statistics. Accessed October 26, 2016.
“Employment Projections.”
Industry-occupation matrix data, by occupation — Total, all occupations
[XLS]
***
Laws Passed
GovTrack aggregates publicly available data on the number of federal laws passed during each two-year Congressional session. Data are available going back to 1973.
Enacted Laws: Enacted bills and joint resolutions (both bills and joint resolutions can be enacted as law)
Passed Resolutions: Passed resolutions (for joint and concurrent resolutions, this means passed both chambers)
Got A Vote: Bills and joint/concurrent resolutions that had a significant vote in one chamber
Failed Legislation: Bills and resolutions that failed a vote on passage or failed a significant vote such as cloture, passage under suspension, or resolving differences
Vetoed Bills (w/o Override): Bills that were vetoed and the veto was not overridden by Congress
Other Legislation: Bills and resolutions that were introduced, referred to committee, or reported by committee but had no further action
Src:
GovTrack. Accessed November 3, 2016.
“Congress > Bills > Statistics and Historical Comparison > Bills by Final Status.”
*
Brookings Institution also aggregates figures on Congressional activity. This data set covers 1947-2013.
Src:
Raffaela Wakeman et al. July 9, 2013 (updated August 2014).
“Vital Statistics on Congress: Data on the U.S. Congress – A Joint Effort from Brookings and the American Enterprise Institute.”
[PDF]
Brookings Institution
contact: vitalstatistics@brookings.edu
State of the Future Index (28 variables)
Every year, The Millennium Project (MP) computes a “State of the Future Index” looking 10 years into the future, based on data from the previous 20 or more years. The index calculation is based on values for multiple, individually-forecast key variables (28 in 2015). The index is calculated globally, as well as for individual countries. The overall index is intended to show the direction of things to come.
For our purposes the forecasts for the 28 individual variables are of most interest. MP breaks the variables into two groups: those showing improvement, and those showing decline. The values for the individual variables (previous actual, and forecast) are displayed within the shaded area of the charts.
Areas showing improvement in 2015:
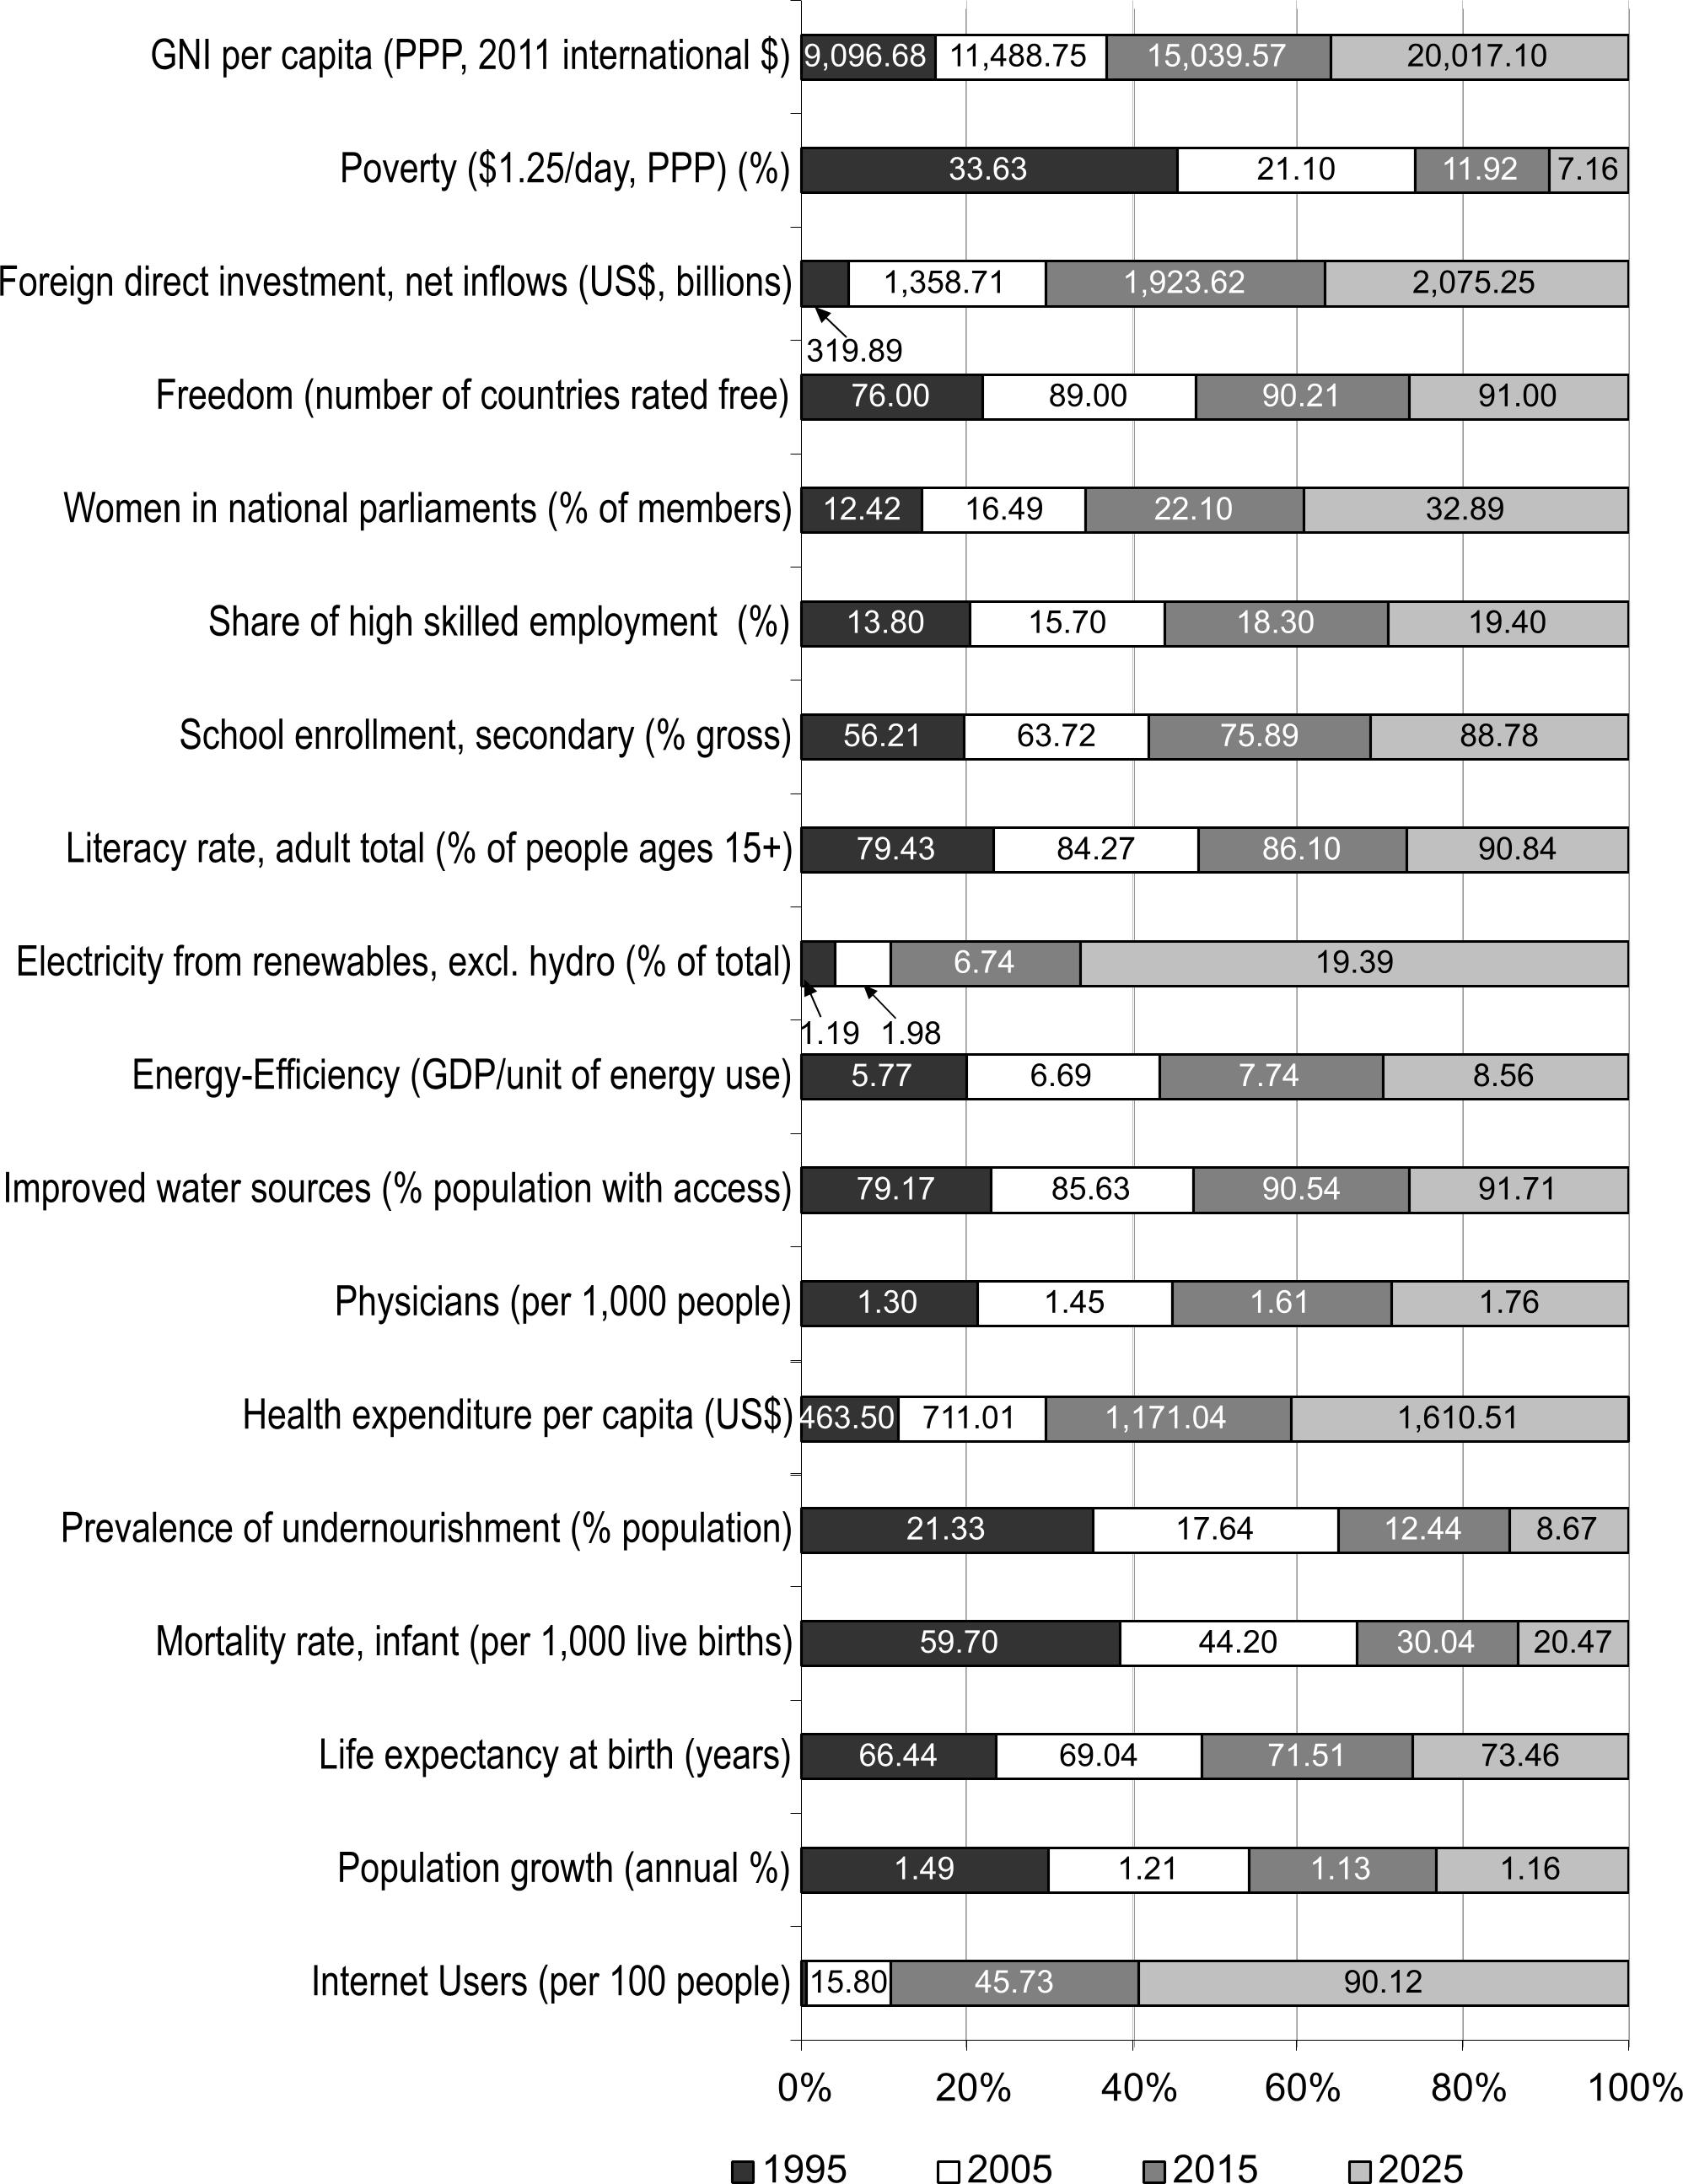
Areas showing decline in 2015:
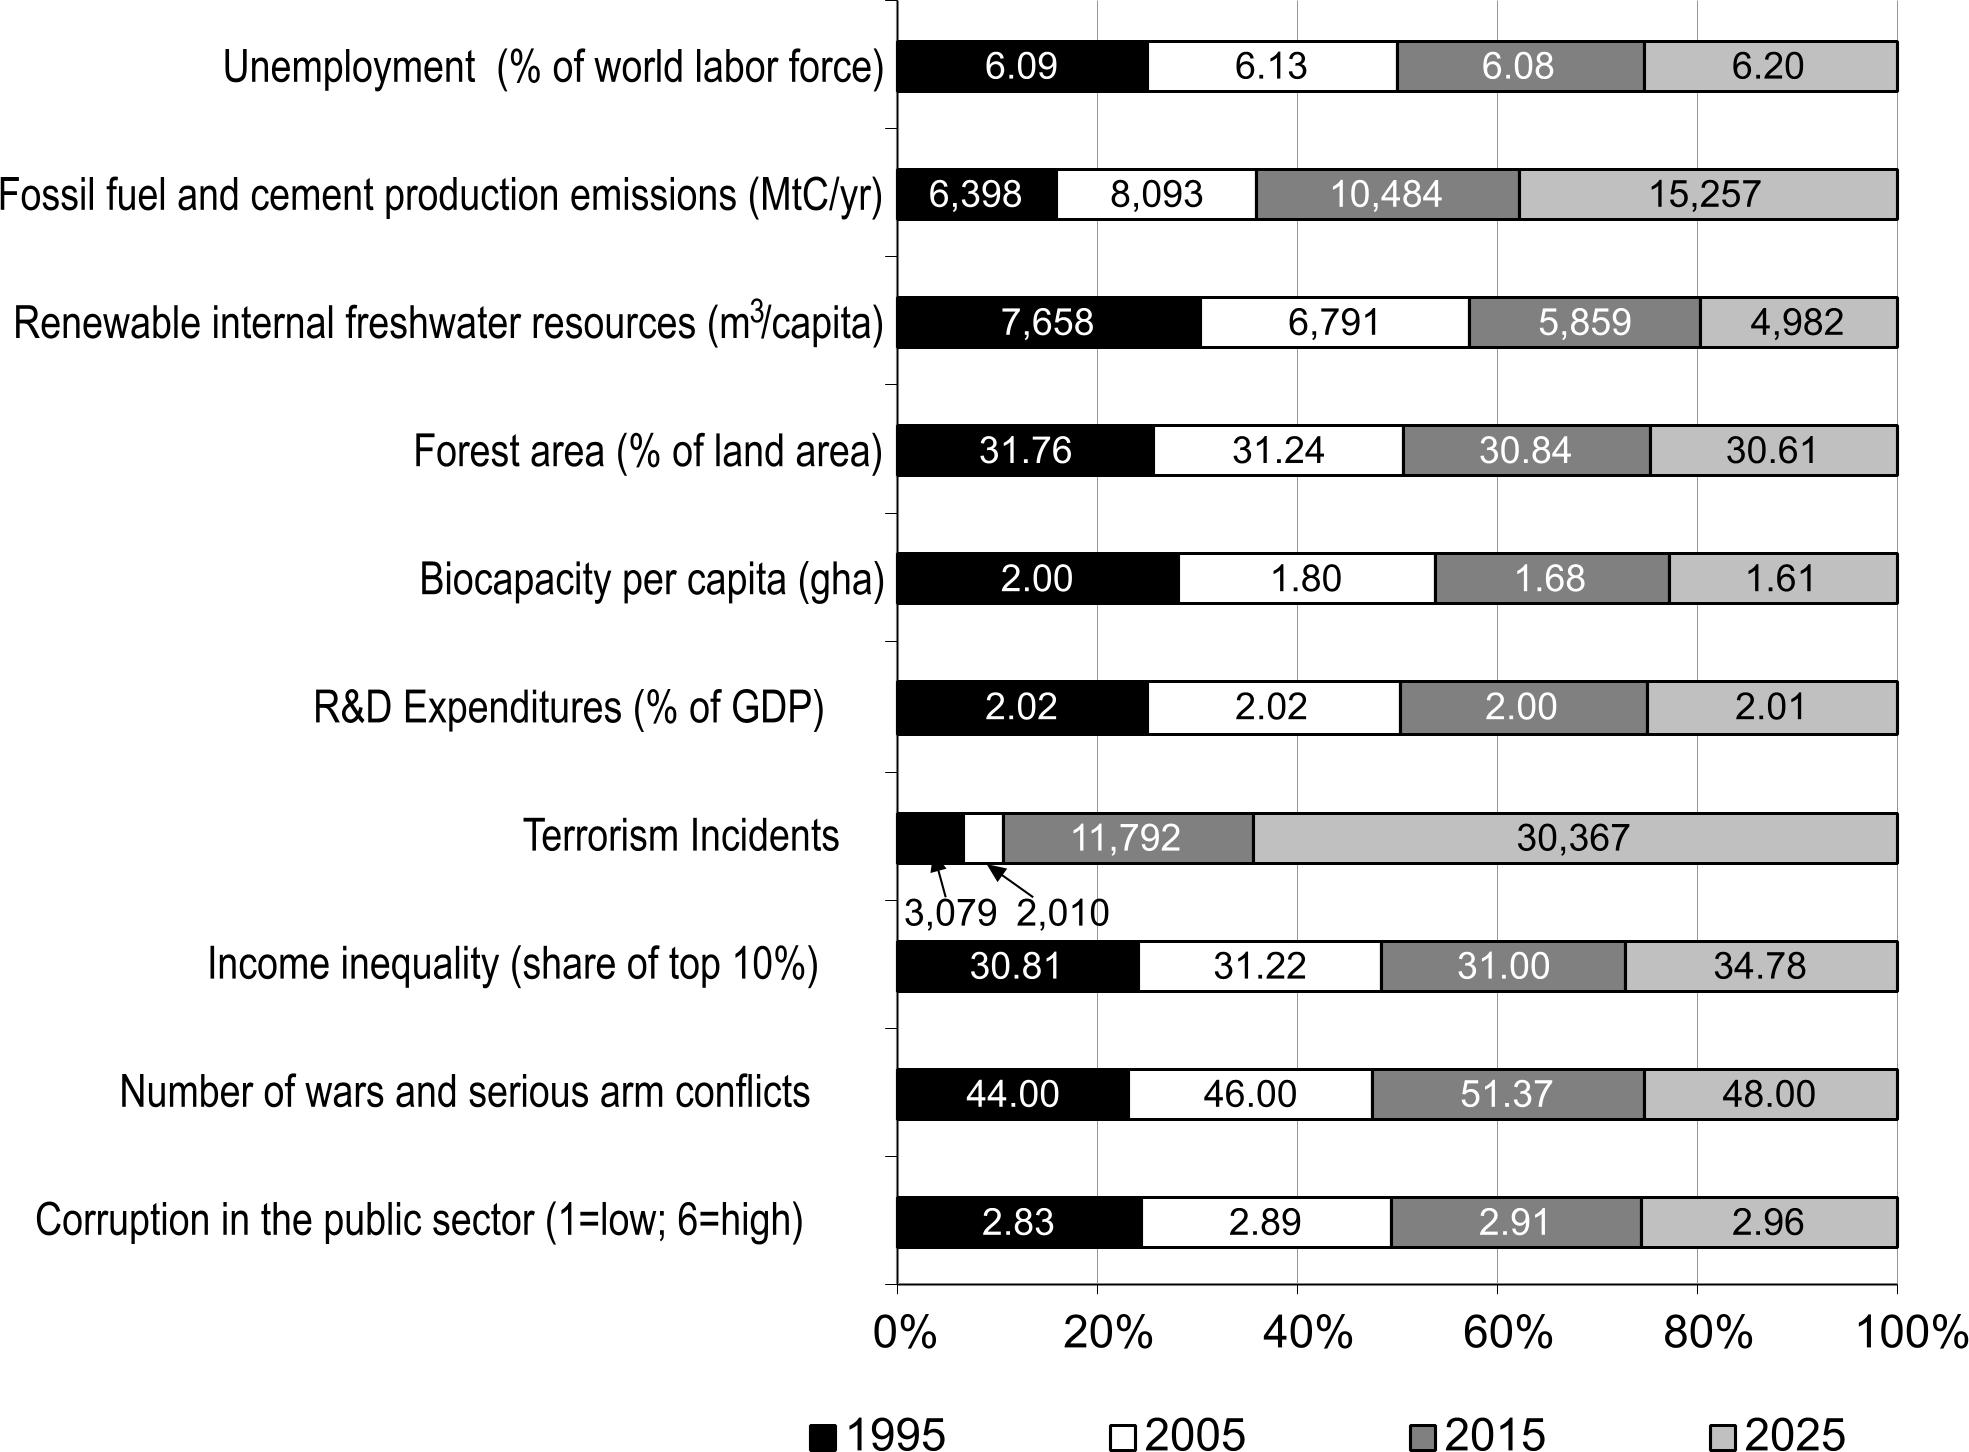
In 2015, the calculated Index looks like this:
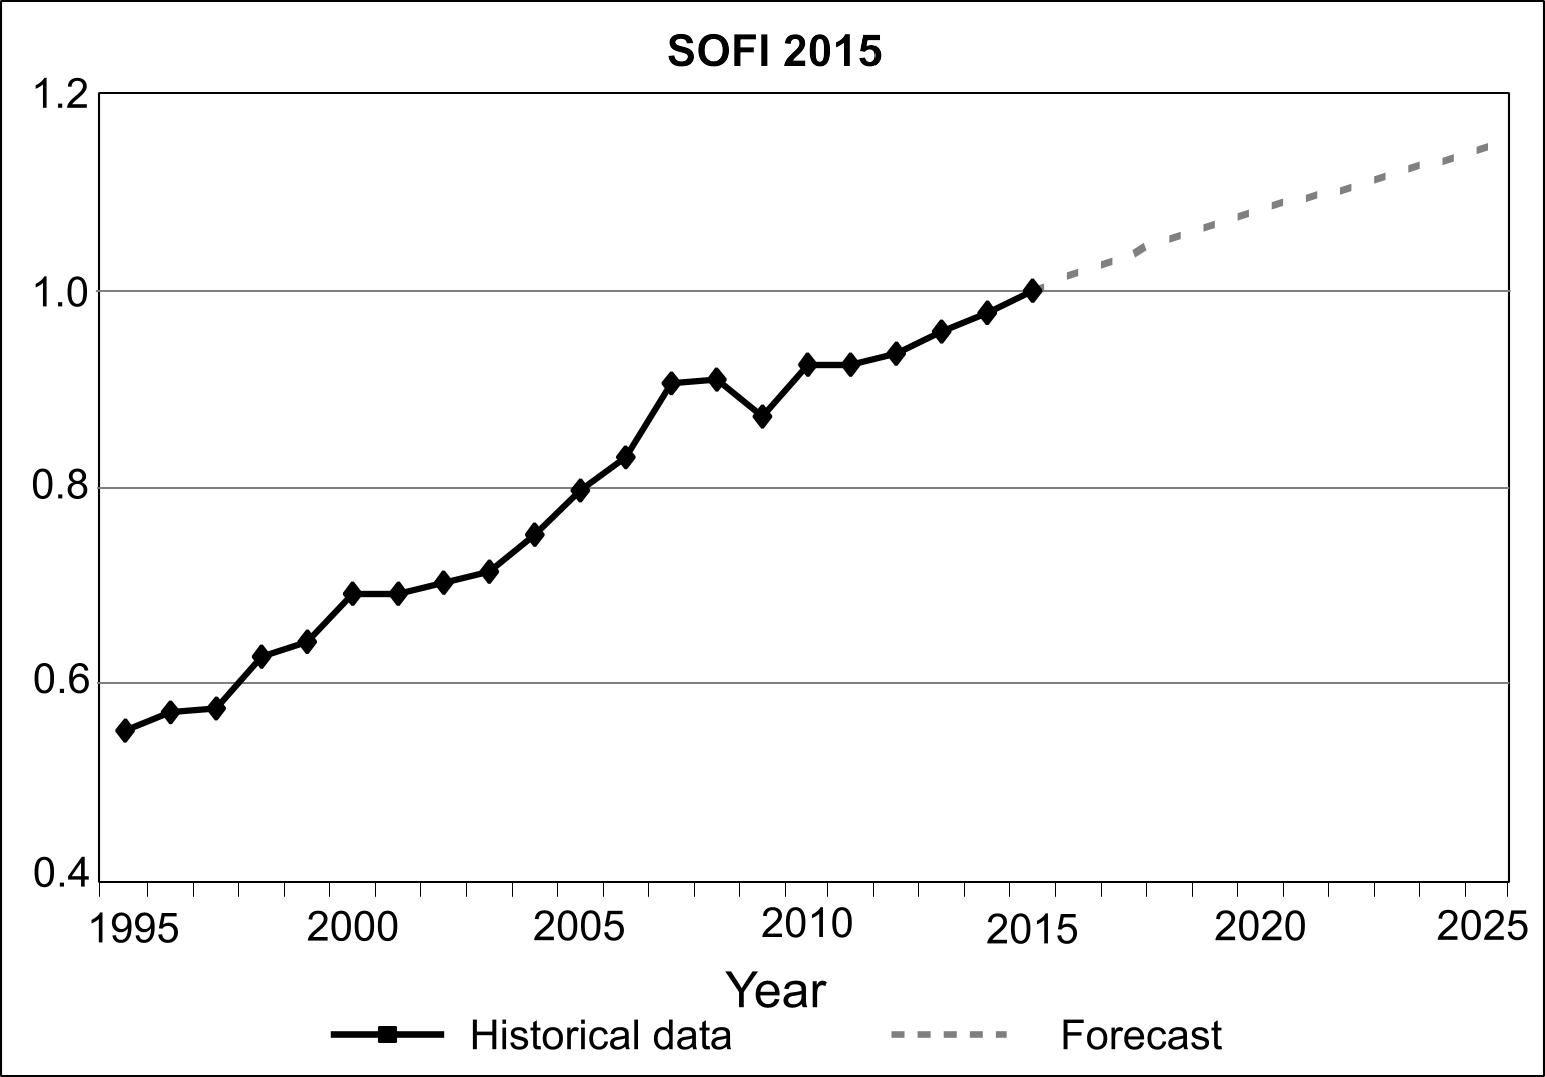
Src: Gordon, Theodore J. 2015. “2015 State of the Future Index.” The Millennium Project.
Charts for each indicator, and a brief indication of the source for the data are in this PDF.
The Millennium Project is an independent non-profit global participatory futures research think tank of futurists, scholars, business planners, and policy makers who work for international organizations, governments, corporations, NGOs, and universities. Their annual report collects and assesses judgments from over 3,000 people selected by its 56 nodes around the world.
