

Crime
Summary
This collection of data includes the following indicators, dates, and sources:
violent/property crime rates, 1994-2015, U.S. Dept. of Justice
white collar crime prosecutions, 1995-2015, TRAC
executions, 1976-2016 & 1608-2002, Death Penalty Info Center
adult correctional population, 2014-1980, DoJ
incarceration rate, 1925-2014, DoJ and Sourcebook of Criminal Justice Stats
state and federal confinement and community facilities, 1979-2005 (quinquennial), DoJ
Findings
Crime Rates
Crime in the United States
by Volume and Rate per 100,000 Inhabitants, 1994–2015
Note: The violent crime figures include the offenses of murder, rape (legacy definition), robbery, and aggravated assault.
Note: The property crime figures include the offenses of burglary, larceny-theft, and motor vehicle thefts.
Src for 1996-2015:
U.S. Department of Justice. Accessed October 24, 2016.
“Crime in the United States 2015.”
Table 1: Crime in the United States.
Src for 1994, 1995:
U.S. Department of Justice. Accessed October 24, 2016.
“Crime in the United States 1995.”
Section II: Crime Index Offenses Reported [PDF]
*
White Collar Crime
For every 100,000 people in the United States, there are 5,317 arrests that are directly related to white collar crime.
In August 2014, it was reported that there were 512 total white collar prosecutions that occurred in the United States.
On a year to year comparison with August 2013, the 512 incidents are 6.2% lower.
It is estimated that 1 out of every 4 households will become the victim of a white collar crime at some point.
More than 88% of white collar crime incidents are never reported to law enforcement agencies, although about half of all incidents are reported to someone, such as a supervisor.
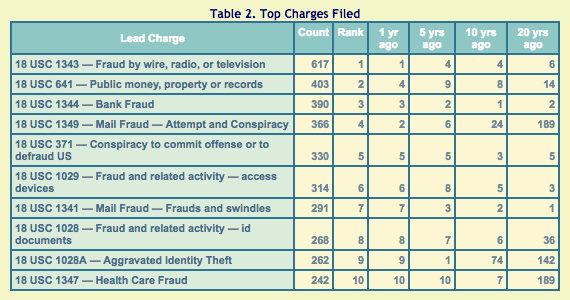
White collar crime has been moving away from stealing money from companies to stealing money from people. The most frequently cited charge that leads a prosecution attempt is aggravated identity theft. This charge accounts for 18.6% of the total charges that were filed within the last month. Mail fraud or conspiracy charges to commit offenses that defraud the country are also popular charges that are filed. In total, however, bank fraud and wire fraud are still the most popular white collar offenses that are investigated.
Src:
Brandon Gaille. Nov 2014.
“34 Surprising White Collar Crimes Statistics.”
*
White Collar Crime Prosecutions, 1995-2015
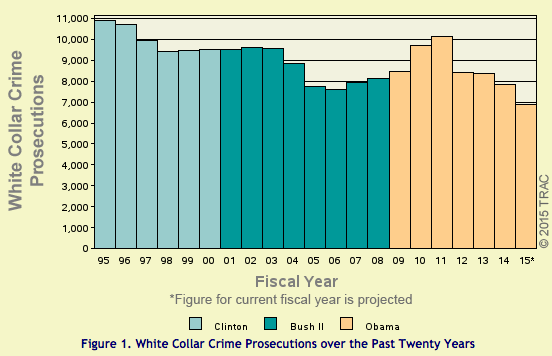

Src:
TRAC Reports. July 2015.
“Federal White Collar Crime Prosecutions At 20-Year Low.”
Transactional Records Access Clearinghouse. Syracuse University.
***
Capital Punishment
The Death Penalty Information Center (DPIC) tracks and aggregates historic data on capital punishment in the United States.
DPIC’s modern data set goes back to 1976

DPIC has also collected execution data going back to 1608 in its “[Espy File],” based on research compiled by M. Watt Espy and John Ortiz Smykla. The Espy data is available in a few different formats at the DPIC website, but Time has published an interactive info graphic showing the total number of executions per year, integrating the Espy data with DPIC’s modern data.
Srcs:
DPIC. Updated October 19, 2016. Accessed November 3, 2016.
“Executions by Year.”
“Executions in the U.S. 1608-2002: The Espy File.”
“Espy File Data.” XLS
Chris Wilson. July 24, 2014.
“Every Execution in U.S. History in a Single Chart.”
Time.
TO DO: EXTRACT ANNUAL TALLIES OF EXECUTIONS FROM ESPY DATA FILE.
***
Incarceration
The Bureau of Justice Statistics tracks data on the US correctional population going back to at least 1980.

Src:
Bureau of Justice Statistics. Accessed November 3, 2016.
“Key Statistic: Total Correctional Population.”
“Estimated number of persons supervised by U.S. adult correctional systems, by correctional status, 1980-2014.” [XLS]
U.S. Department of Justice.
*
A compilation of historic incarceration rates, 1925-2014, is published a WikiCommons, citing data from the “Sourcebook of Criminal Justice Statistics.”
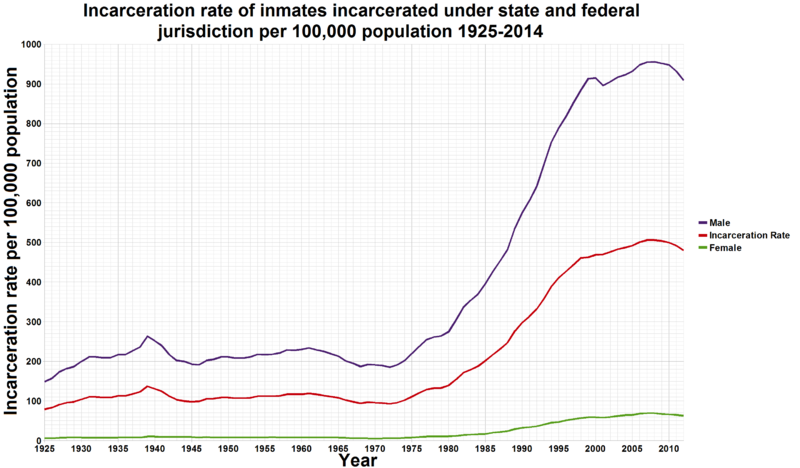
Src:
Smallman12q. January 2010. Accessed November 3, 2016.
(Subsequently updated by other users)
“File:U.S. incarceration rates 1925 onwards.png”
Wikimedia Commons.
Citing:
U.S. Department of Justice, Bureau of Justice Statistics.
and
University of Albany.
Sourcebook of Criminal Justice Statistics (2003).
Table 6.28, P.500.
*
State and Fed facilities (confinement and community facilities)
The “Census of State and Federal Adult Correctional Facilities” has been conducted every 5 to 7 years since 1974. The census reports include a count of the number of facilities which were included in the survey. Below are excerpts from 1979-2005.
Confinement AND Community Facilities
1979 – 791
state confinement – 568
1984 – 903
state confinement – 694
1990 – 1,287
state confinement – 957
1995 – 1,500
state confinement – 1,084
2000* – 1,668
state confinement – 1,023
2005 – 1,821 (nearly all growth in private facilities)
Note: 2000 was the first year that specifically called out private facilities.
Src:
Bureau of Justice Statistics. 1979-2005.
“Census of State and Federal Correctional Facilities.” [multiple reports]
Data Collection: Census Of State And Federal Adult Correctional Facilities.
U.S. Department of Justice.
