

Homes: Space Use, Moves, Bandwidth
The following indicators describe how people use the space in their homes, how frequently they move, and how internet-connected households are.
Descriptions of the way people use the space in their homes are largely qualitative and general. Some historical surveys describe general differences in home design and space use from one historic period to another, but these surveys are not quantitative. In the early 20th century, there were a few time-use and space-use studies conducted by home economists, but I’ve not seen a single source that aggregates the data from different geographic zones, and I’m not aware of any contemporary surveys. These early 20th-century studies, which mostly focused on kitchens, informed the development of minimum standards, which continued to evolve into the middle and later part of the century. Again, I’ve found single instances of minimum standard recommendations, but no historical quantitative comparisons of how the standards have evolved. I’ve come across one 10-year and one 20-year outlook describing general changes in housing plans, which may be on-going.
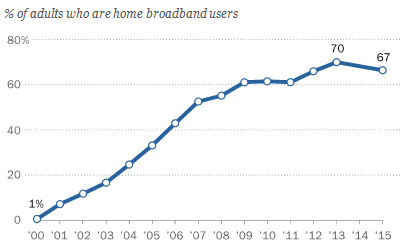
Historic fixed-line broadband subscriptions are available from the UN’s International Telecommunication Union (ITU), 2000-2014. Pew surveys going back to 2000 show that home broadband adoption has plateaued between 2013 and 2015. A 2009 Technology Futures broadband forecast to 2020 also shows predicts plateauing starting from about 2015. Cisco has published a four-year forecast of broadband speeds to 2019.
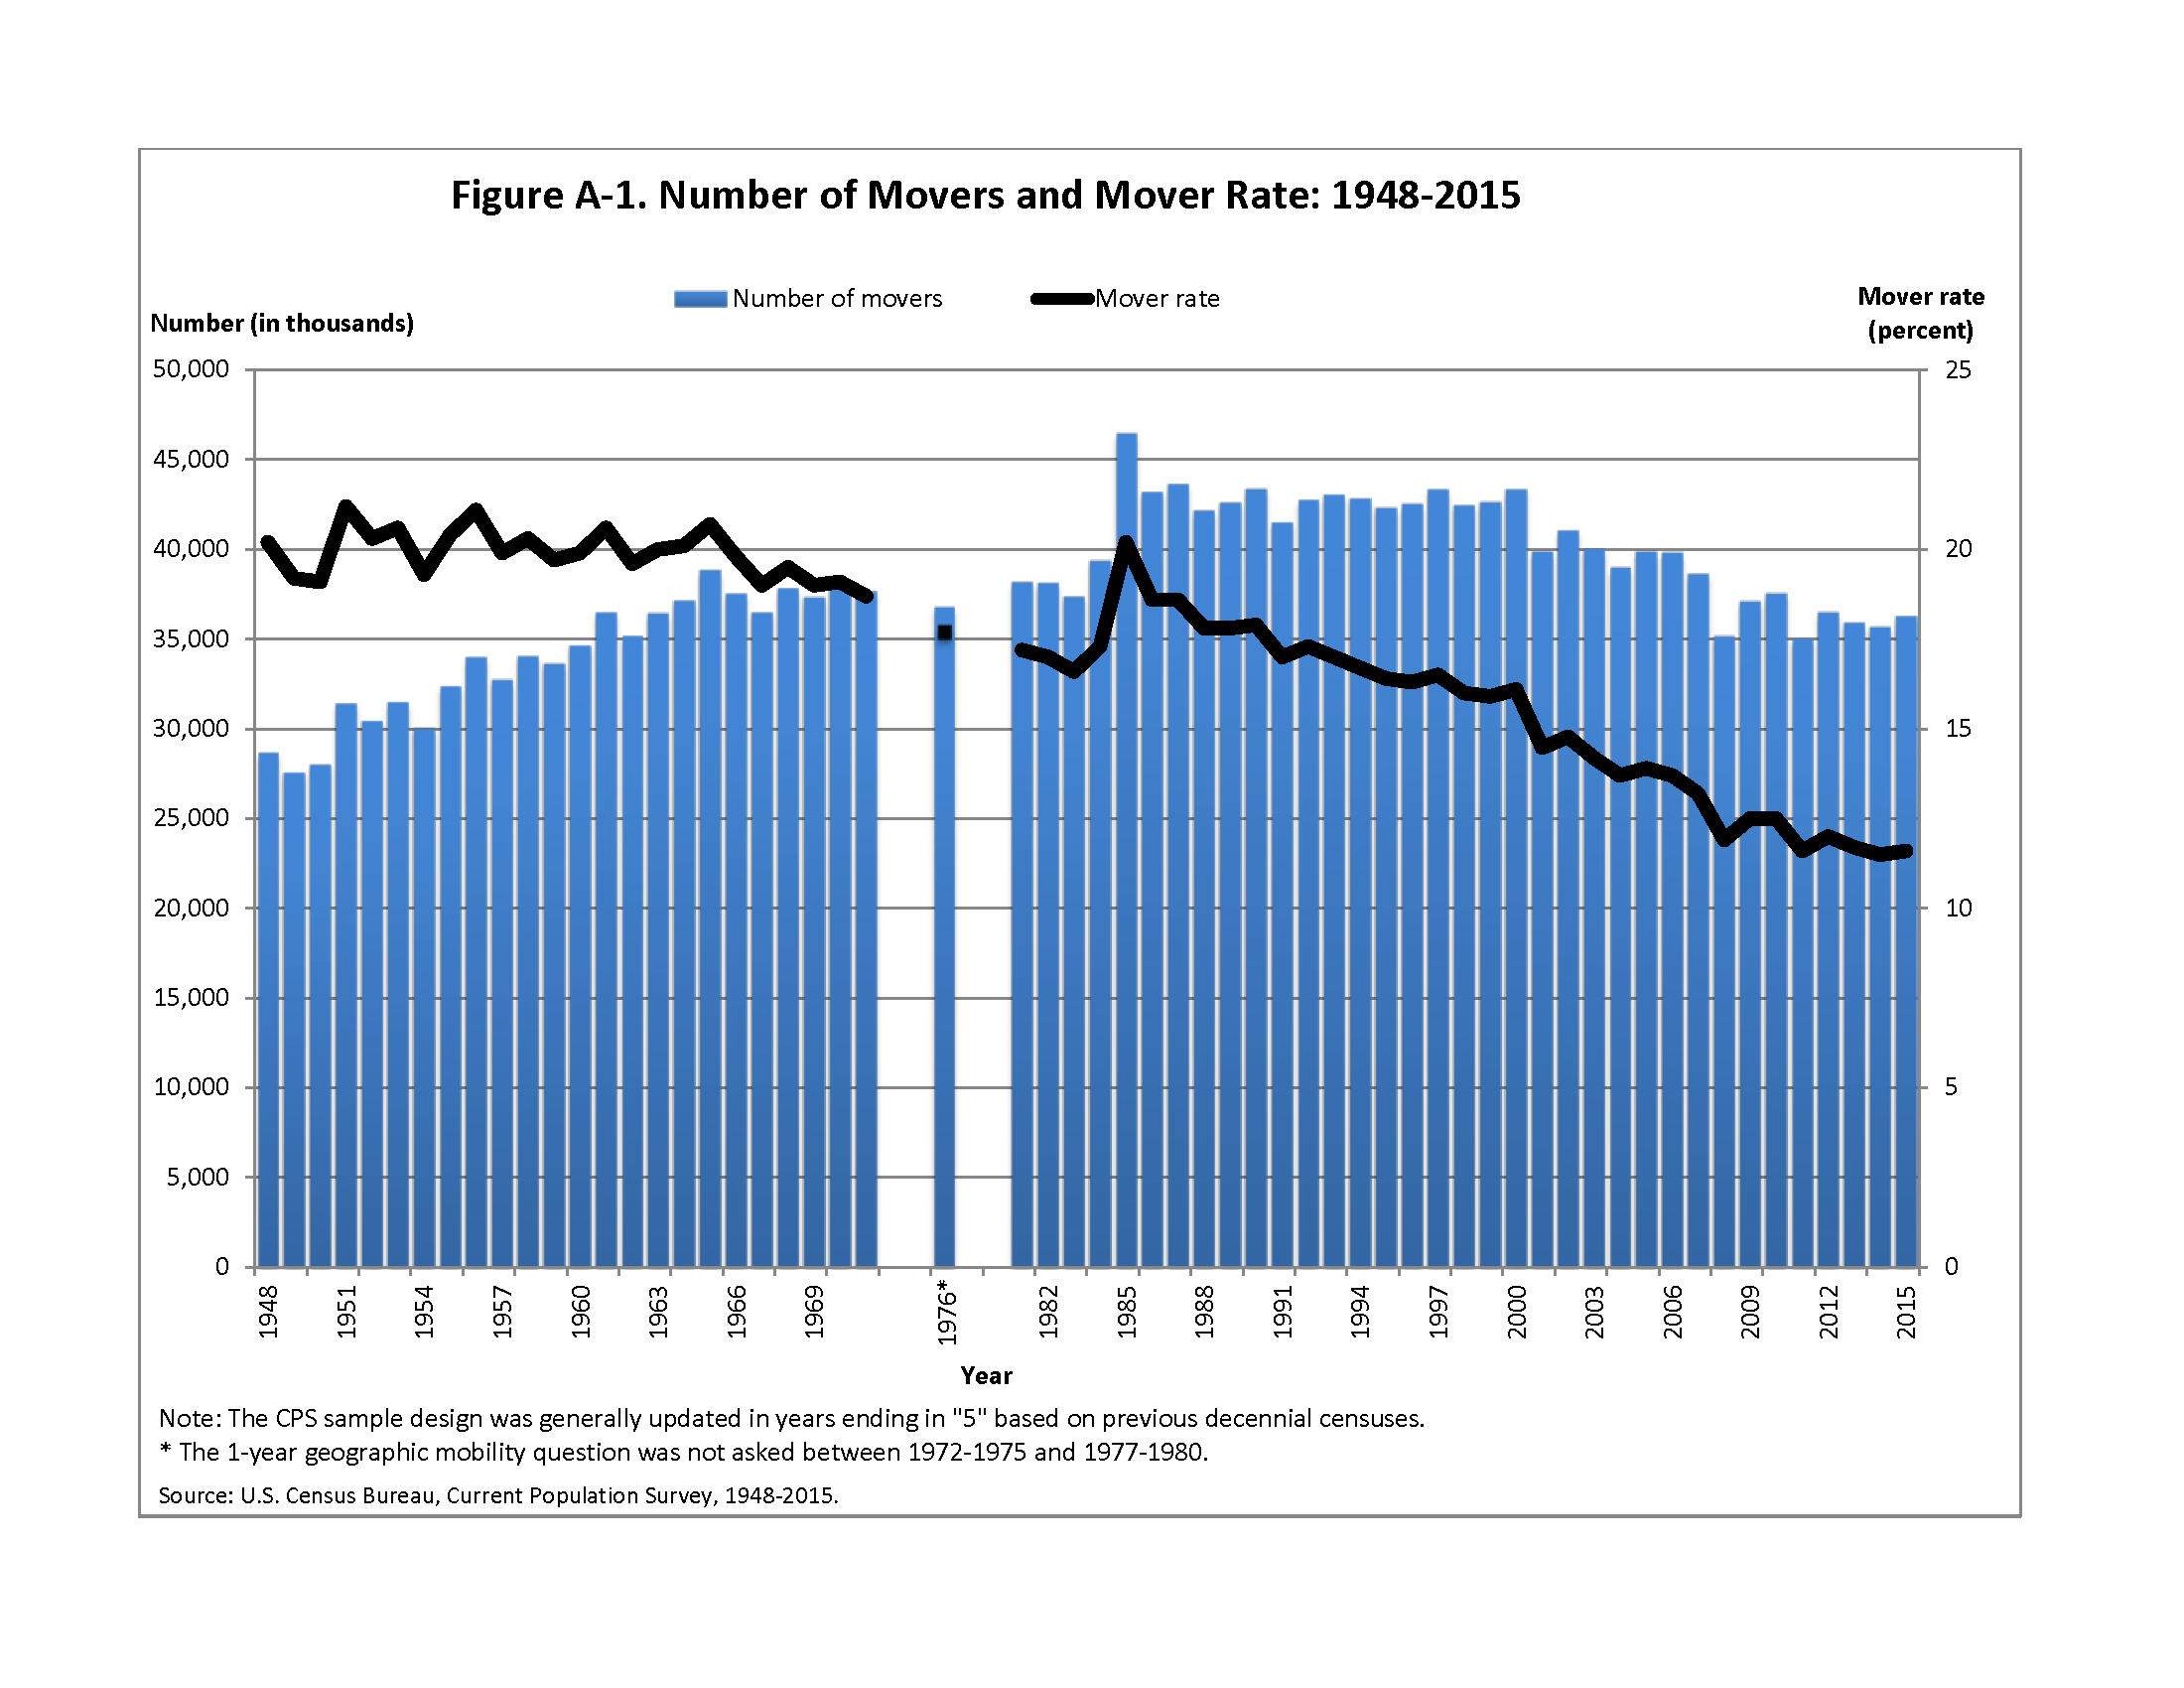
The US Census Bureau estimated the number of times a typical American will move in 2007. FiveThirtyEight updated that estimate in 2013. It may be possible to calculate this figure for previous years using older Census data. Historic estimates of the number of people moving each year are available from the Census going back to 1948.
Use of Rooms/Space
Moya K. Mason. 2009.
“Housing: Then, Now, and Future”
(date inferred via Internet Archive)
This is a general overview describing changes in the size and utilization of residential spaces, from the 18th century to present. The author has also collected excerpts from their sources here.
Ebby Halliday, REALTORS. 2009.
“Residential Housing 2030 and Beyond”
This is an outline of a focus group conversation among 25-to-40-year-olds discussing their present housing needs, and anticipated needs in the next 20 years. Very rough notes. Appears to be a consensus for smaller square footage of homes with larger, multi-purpose rooms, and larger back yards. This document was presented at the 2009 conference “North Texas Alternative Futures” in Irving, Texas, an on-going series sponsored by the Urban Land Institute.
“Residential: Embracing New Lifestyles”
Section in 2016 Gensler Design Forecast — Lifestyle
Gensler is a global architecture, design, and planning firm.
10-year outlook for trends in residential building. Brief, and highly qualitative. Communal housing (cohousing), with shared amenities, will become acceptable to post-college adults, single parents, and the elderly. Changes in work style and lifestyle will increase the need for part-time housing. Mixed-use developments will increasingly include housing. “Uburbs,” midway between the city and suburbs, are an emerging residential market.
TO-DO: CONTACT GENSLER TO INQUIRE IF THIS IS AN ON-GOING FORECAST, AND THE DATE OF THE OLDEST.
*
EMAILED ARTHUR C. NELSON
Professor of Urban Planning and Real Estate Development, Univ. Arizona
HE WAS INTERESTED IN THE TOPIC, BUT NOT AWARE OF ANY SOURCES
*
Other possible sources:
The American Institute of Architects
Virginia Tech College of Architecture & Urban Studies
Georgia Institute of Technology College of Architecture
Design Futures Council (DFC)
American Society of Interior Designers
contact:
David Krantz
Vice President, Research and Knowledge Management
dkrantz@asid.org
EMAILED 6/1 – REPLIED SAYING NO IMMEDIATE LEADS, BUT HE’LL LOOK INTO IT
Interior Design Society
Designer Society of America
Certified Interior Decorators
University of Illinois Small Homes Council-Building Research Council
US Minimum Property Standards
Best Interior Design Graduate Schools, Design Intelligence (DFC)
Savannah College of Art and Design
Pratt Institute
Rhode Island School of Design
EMAILED LILIANE WONG 6/2, HEAD OF THE INTERIOR ARCH DEPT
Kansas State University
New York School of Interior Design
Best Architecture Graduate Schools, Design Intelligence (DFC)
Harvard Univ
Cornell Univ
EMAILED KATHLEEN GIBSON 6/2, WHO MAINTAINS THEIR INTYPES DATABASE
SHE’S ON SABATICAL THROUGH 2017
EMAILED JAN JENNINGS 6/2, WHO FOUNDED THE INTYPES DB
SHE HAS NO SUGGESTIONS
Yale Univ
Columbia Univ
MIT
UC Berkeley
EMAILED PAUL GROTH 6/2
HE RECOMMENDS ASKING Richard Longstreth (GWU) AND URBAN LAND INST
TO-DO: FOLLOW UP WITH THESE LEADS
U. Michigan
Rice Univ.
Virginia Tech
EMAILED KATHLEEN PARROTT 6/1
Washington Univ. St. Louis
*
Interior Designer Jobs
Number of Jobs, 2014 — 58,900
Job Outlook, 2014-24 — 4% (Slower than average [which is about 7%])
Employment Change, 2014-24 — 2,200
src:
“Interior Designers.” 2014. Bureau of Labor Statistics, U.S. Department of Labor, Occupational Outlook Handbook, 2016-17 Edition.
Note: This 4% growth is a significant slowing from the BLS’s 2010 estimate of 19% job growth from 2010 to 2020 [average at the time].
Number of Jobs, 2010 — 56,500
src:
“Interior Designers.” 2012. Bureau of Labor Statistics, U.S. Department of Labor, Occupational Outlook Handbook, 2012-13 Edition. Via Internet Archive.
*
Virginia Tech conducted survey-based research in 2000 examining what people do in their kitchens, they have in them, what kind of cooks they are, and what they want from their kitchens.
I don’t think the survey has been updated, and the research summary does not contain much specific historic information, but I’ve written to the lead author to inquire about historic data and forecasts. EMAILED 6/1.
Excerpts:
What do people do in their kitchens? What types of cooks are they? What do they have in their kitchens and how do they react to the design, layout, convenience, and function of their existing kitchens? And perhaps most importantly, what does this tell us about how to plan and design the kitchens of the future?
In an effort to answer these questions, a multi-stage research project was developed. First, a content analysis of shelter, design, and kitchen magazines investigated current trends and features of kitchen design. Then a local sample of over 75 cooks was brought to the Center for Real Life Kitchen Design at Virginia Tech. These cooks were interviewed about their home kitchens and how they used them. The cooks were measured and then videotaped cooking a meal. Finally, a national telephone survey with 630 respondents gathered broad information about kitchens and cooks from around the country.
Household Characteristics
Who participated in the research project? The local and national samples were similar in their demographic make-up. In addition:
*A majority of the respondents in both samples (over 90%) were from households of fewer than four people. The most common types of households were a family or adult couple (approximately 1/3 each).
*Both samples included more females than males, within a wide variety of age and income brackets.
*Approximately 75% of each sample lived in single-family residences they owned. There was not a dominance of any particular age or size of residence.
*The national sample was equally divided among small town, rural, city and suburban residences.
Key conclusions from the study can be grouped into categories: what people do in their kitchens, who is cooking, how people cook, what people have in their kitchens, and what people want in their kitchens.
People have many small appliances (an average of 12 per household).
Some small appliances are stored on counter tops (four is typical).
src:
“Someone’s in the Kitchen… – A summary of the Findings of the Kitchen Space and Storage Research Projects.”
Kathleen Parrott, Ph.D., CKE
JoAnn Emmel, Ph.D.
Julia Beamish, Ph.D., CKE
Center for Real Life Kitchen Design
Department of Apparel, Housing, and Resource Management
Virginia Tech
Accessed June 1, 2016. This page was published in 2015, but the research was conducted in 2000, per this new release. The research informed a 2007 text book, Kitchen Planning, referenced below.
contact:
Kathleen Parrott — homes@vt.edu
*
One-off study from 1963 with household storage minimums (specific recommended minimums for closets, clothes closets, linen closets, kitchen storage, access, and general storage). Unable to find a contemporary equivalent.
src:
Rudard A. Jones. July 1963.
“Household Storage Study.”
Research Report 13-1
University Of Illinois
Small Homes Council — Building Research Council
Several other “universal design” papers and recommendations have been published throughout the 20th century (for example, DeMerchant & Beamish, 1995).
This trend toward recommended standards began in the 1930s when home economists with USDA started systematically researching and documenting the use of time and space in homes (especially kitchens) as a way of improving rural housing conditions. Results of many early USDA time-use surveys are available here.
Some home design books include discussion of recent home design trends. For example, Kitchen Planning (NKBA, 2013), includes discussion of general housing trends and consumer preferences, drawing upon recent surveys by NAHB, Better Homes and Gardens, and the American Institute of Architects. This work also includes a very general description of older kitchen and work-area research studies (like the USDA’s, mentioned above). However, the discussion focuses on the current demand, and does not give detailed attention to the pace of the change. TO-DO: IT MIGHT BE POSSIBLE TO MINE THE SURVEYS AND REPORTS REFERENCED IN NKBA 2013 FOR SPECIFIC STANDARDS FROM THE 1930S, 1950S, 1970S, 1990S, AND 2000S TO CHART THE METRIC EVOLUTION OF THE STANDARDS. THE CHAPTER DOES INCLUDE A NARRATIVE SUMMARY OF CHANGES BY DECADE FROM 1900 THROUGH THE 21ST CENTURY (MY PREVIEW TOPS OUT AFTER THE 1920S SUMMARY).
References include:
Beecher & Stowe 1869
Frederick 1913
Deane G. Carter 1932 — AES bulletin
Maud Wilson 1938 “The Willamette Valley Farm Kitchen”
Maud Wilson 1947b “Considerations in Planning Kitchen Cabients”
Heiner and McCullough 1948 “Functional Kitchen Storage”
Small Homes Council (SHC) 1949 “Cabinet Space for the Kitchen”
McCullough 1949
Heiner and Steidel 1951
Howard 1965
Kapple 1964; Wanslow 1965
Jones and Kapple 1975
Yust and Olsen 1992 “Residential Kitchens: Planning Principles for the ‘90s”
Cheever 1992 “Utensil Survey Project”
NOTE: THIS WORK FOUND THAT THE NUMBER OF ITEMS STORED IN THE KITCHEN HAD INCREASED 110% FROM THE NUMBER REPORTED IN 1948 (BY HEINER AND MCCULLOUGH).
Emmel, Beamish and Parrott 2001 “Someone’s in the Kitchen”
NAHB 2011
“New Homes in 2015 Will be Smaller, Greener and More Casual.”
Sullivan 2010
“Home Sizes Continue to Shrink.”
Better Homes and Gardens survey
Baker 2010
“Small Talk: Kitchens and Baths Do More With Less”
search for ref to AIA survey
Frequency of Moves
How many times will a typical American move in their life?
2007 – 11.7
2013 – 11.3
US Census Bureau doesn’t ask directly, but it calculates this figure based on which age groups are most likely to move in a given year and the overall composition of the US population.
src:
Mona Chalabi. January 29, 2015.
“How Many Times Does The Average Person Move?”
FiveThirtyEight
TO-DO: FIND/COMPUTE THIS FIGURE USING CENSUS DATA FOR PREVIOUS YEARS.
The Census Bureau describes their methodology here.
The move data comes from the American Community Survey, questions about “State-to-State Migration Flows.”
Tables are available from 2005 through 2014 at the American Factfinder portal.
Data is also available from the decennial censuses going back to 1940, links below.
1980 (page 85+)
*
Note: Slightly different from 2007 and 2013 values suggested above
src:
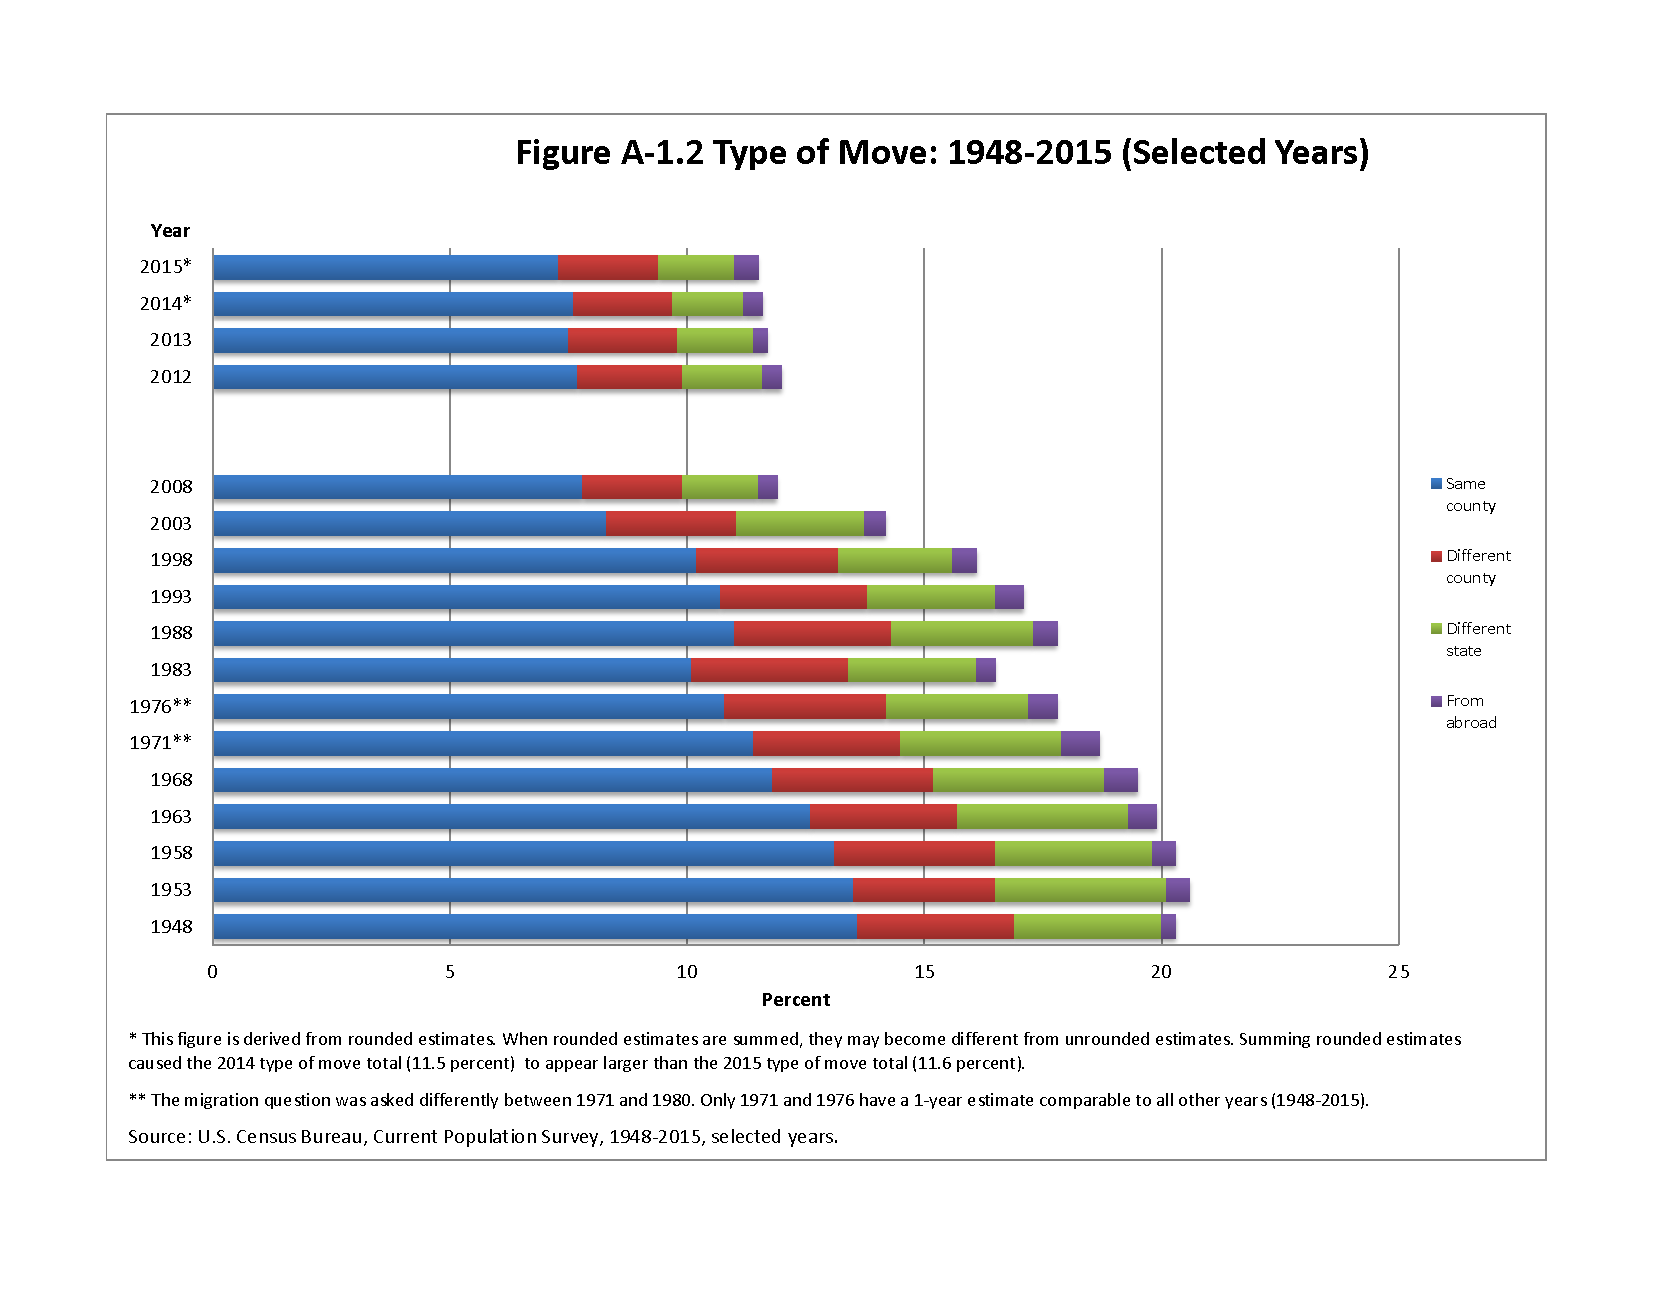
“CPS Historical Migration/Geographic Mobility Tables” 2015.
US Census Bureau.
Figure A-1.1
Figure A-1.2
*
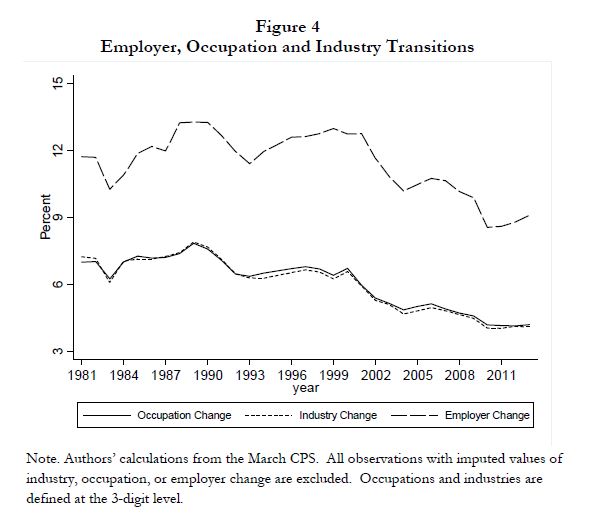
A 2014 white paper by the National Bureau of Economic Research argues that, since the 1980s, Americans are moving less because they’re changing jobs less often.
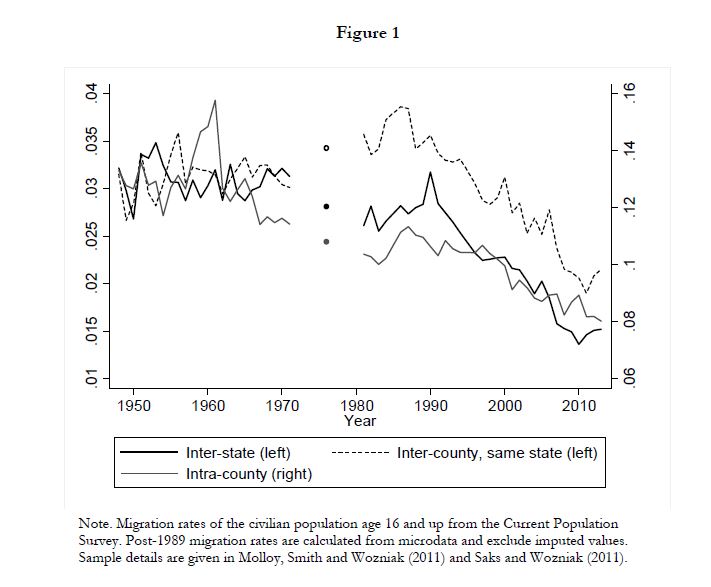
Using data from the Current Population Survey, US Census.
Using data from National Longitudinal Surveys of Youth from the late 1970s to the late 2000s
TO-DO: CHECK IF THE ANNUAL DATA ARE AVAILABLE IN THE NBER PAPER. THE PAPER IS FREE FOR JOURNALISTS TO DOWLOAD, BUT WE NEED TO COMPLETE REGISTRATION (PENDING AS OF 6/2).
src:
Raven Molloy, et al. April 2014.
“Declining Migration within the U.S.: The Role of the Labor Market”
National Bureau of Economic Research (NBER)
via:
Richard Florida. April 28, 2014.
“Why Americans Are Moving Less: New Jobs Aren’t Worth It.”
CityLab — The Atlantic
Bandwidth to Homes
U.S. Fixed-broadband subscriptions, 2000-2014
Aggregated in the following Google Sheet:
src:
ITU. 2015.
“U.S. Fixed-broadband subscriptions.”
via the ITU Statistics page
*
Pew finds that home broadband use has plateaued
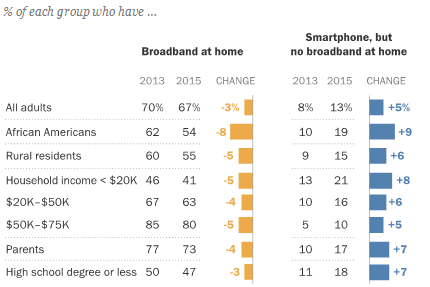
Pew also finds that several groups are shifting their home internet connectivity away from broadband and toward smartphones.
src:
Pew Research Center. December 2015.
“Home Broadband 2015.”
*
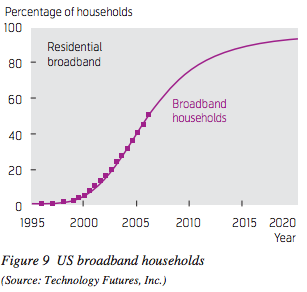
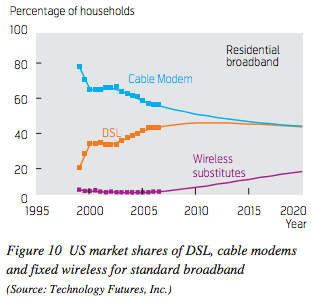
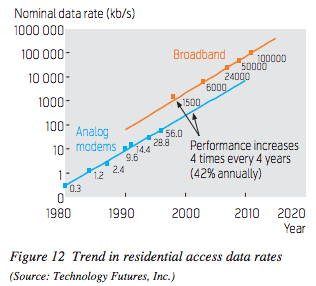
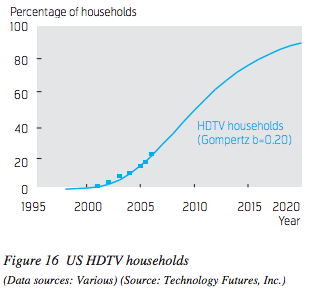
In 2002, Technology Futures published several forecasts of residential broadband subscriptions and speeds looking out to 2020. The base model forecast is informed by the Gompertz model, which is usually followed by major consumer adoptions.
The forecasts are notably off from the Pew and ITU reports above. However, one of the historical comparisons in the paper, to Pay Cable adoption, might help to explain the problem with their own forecast for broadband subscriptions.
Pay Cable’s adoption figures from 1973-1981 do not follow the Gompertz model because of a disruption by VCR adoption. Home broadband subscriptions may be experiencing a similar disruption by mobile devices with internet subscriptions.
src:
Lawrence K. Vanston, et al. 2002.
“Residential Broadband Forecasts.”
Technology Futures Inc.
contact: lvanston@tfi.com
In 2009, Technology Futures published an updated broadband forecast to 2020:
src:
Lawrence K. Vanston, Ray L. Hodges. February 2009.
“Forecasts for the US Telecommunications Network.”
Telektronikk 3/4.2008.
*
Chart 3: Actual download speeds by ISP, 2011 to 2014
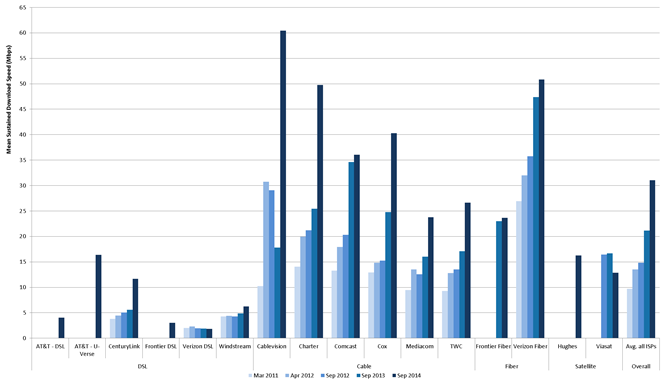
Excerpt:
Chart 3 shows the actual download speeds experienced by each participating ISP’s subscribers — averaged across all analyzed speed tiers, geography, and time — from 2011 to 2014. The actual download speed, averaged across all participating ISPs, has tripled during this period, from approximately 10 Mbps in March 2011, to approximately 15 Mbps in September 2012, to nearly 31 Mbps in September 2014.
src:
FCC. December 30, 2015.
“2015
Measuring Broadband America Fixed Broadband Report.”
*
Table 4. Fixed Broadband Speeds (in Mbps), 2014–2019, North America
2014 — 21.8
2015 — 25.4
2016 — 28.7
2017 — 33.7
2018 — 38.7
2019 — 43.7
CAGR 2014-2019 — 15%
Excerpt:
Broadband speed is a crucial enabler of IP traffic. Broadband speed improvements result in increased consumption and use of high-bandwidth content and applications. The global average broadband speed continues to grow and will more than double from 2014 to 2019, from 20.3 Mbps to 42.5 Mbps. Table 4 shows the projected broadband speeds from 2014 to 2019. Several factors influence the fixed broadband speed forecast, including the deployment and adoption of fiber to the home (FTTH), high-speed DSL, and cable broadband adoption, as well as overall broadband penetration. Among the countries covered by this study, Japan, South Korea, and Sweden lead in terms of broadband speed largely due to their wide deployment of FTTH.
Note: North America is tied with Central and Eastern Europe for the lowest CAGR.
src:
Cisco. June 23, 2015.
“The Zettabyte Era—Trends and Analysis.”
*
Census – Type of Household Internet Connection
2013 data here.
2013 is the first year of tracking
done under the American Community Survey (ACS)
Only other year with this data available is 2014.
The Current Population Survey (CPS) has asked about internet access since 1997.
*
src:
Statista (original source hidden behind paywall)
