

Sports Fandom, Spending & Spectatorship, Fantasy Sports
Summary
Most of the data reported here are historic, although I’ve found a couple forecasts from Pricewaterhouse Coopers for stadium building, and ticket and merchandise sales, 2008-2019.
A small chart contrasting data on sports attendance spending vs. consumer confidence 2011-2015 was published by Rich Luker, who runs ESPN’s annual Sports Poll. I suspect we could find more historic data for both lines to create an expanded chart.
I’ve found several polls describing sports fandom. For the most port, the polls give percentages of respondents, rather than raw figures. Harris’s poll presents the oldest data I’ve seen (back to 1985), although I believe ESPN’s poll has been running for longer than it’s published data would suggest (chart shows data back to 2000, but I think the polls have been running since the mid ’90s).
I’ve collected major league attendance for the NBA and MLB are available back to 1981, and for the NFL back to 1994. Older NFL attendance available is probably available, somewhere.
Team Marketing Report publishes a “Fan Cost Index” which tracks the prices of tickets, as well as other typical spectator expenditures (eg: hot dogs, beer, etc). I’ve found their data for NFL ticket prices back to 2006 via Statista. We should try to contact them for more data.
Findings
Sports Fandom
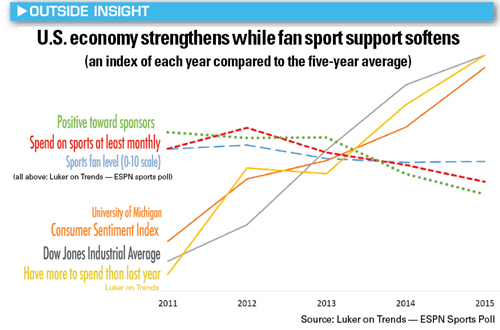
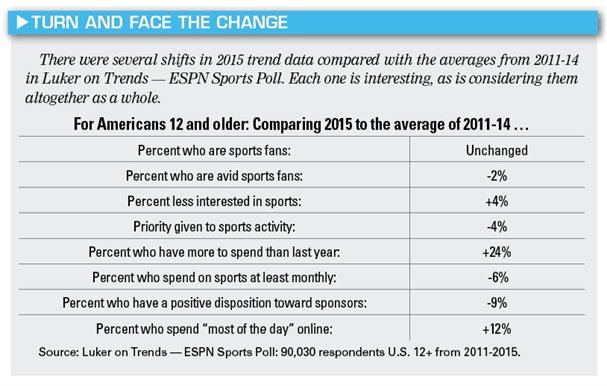
In 2015, 23.4 percent of Americans spent on sports at least once a month, a 6 percent decline from the average 24.9 percent for 2011-14. This trend, if it continues for five more years, will reduce the number of people spending monthly by 10 million.
The University of Michigan Consumer Sentiment Index, which measures consumer confidence, rose by 21 percent in 2015 compared with 2011-14, and the Dow Jones Industrial Average was up 24 percent in 2015 compared with 2011-14. These three sources of data, showing similar growth, indicate a context where more frequent spending in sports should have taken place. And generally, for more than 22 years, engagement in sports has mirrored the performance of the economy and personal finances. We noticed a shift in those trends around 2011, when it seemed the economy was perking up.
The percentage of American sports fans remained near a very stable 88 percent from 2011-15, but avid fans declined by 2 percent in 2015, and those who placed a high priority on time and investment in sports interests dropped 4 percent. Similarly, 4 percent more Americans said they were “less interested in sports than they were the year before” in 2015, compared with the 2011-14 average.
src:
Rich Luker. February 22, 2016. “Sports spending not on pace with economic growth.” Sports Business Daily. contact: rich@lukerco.com
*
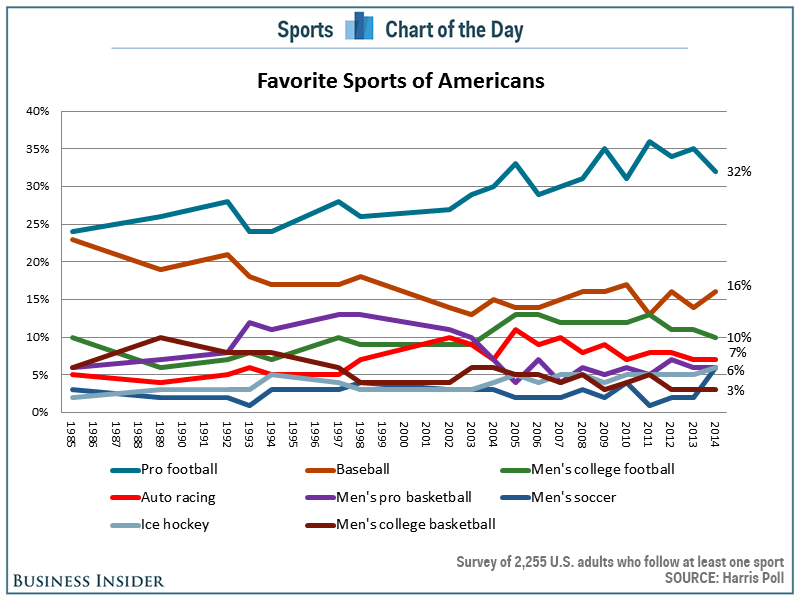
Harris has run an annual poll at least since 1985 asking what Americans’ favorite sports are. In this chart, data is only available for the latest year (2014), but we may be able to obtain figures for the preceeding years by contacting Harris.
src:
Harris Poll, via
Cork Gaines. February 20, 2015. “The popularity of the NFL is starting to fall in the US.” Business Insider
TO DO: CONTACT HARRIS TO ASK FOR HISTORIC DATA POINTS.
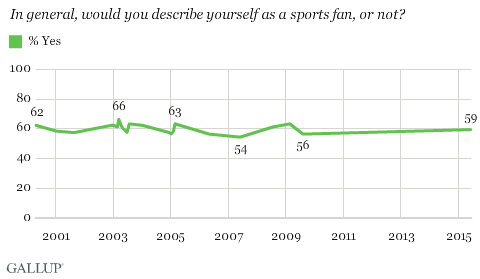
A much simpler, semi-regular Gallup poll, 2001-2015, simply asks if people consider themselves sports fans.
src:
Jeffrey M. Jones. June 17, 2015. “As Industry Grows, Percentage of U.S. Sports Fans Steady.” Gallup.
The ESPN Sports Poll, run annually since 1994 by Rich Luker, defines percentages of fans and avid fans, and, by subtraction, non-fans. This particular graphic only give data back to 2000, but we may be able to ask Luker (or his colleague) for older data.
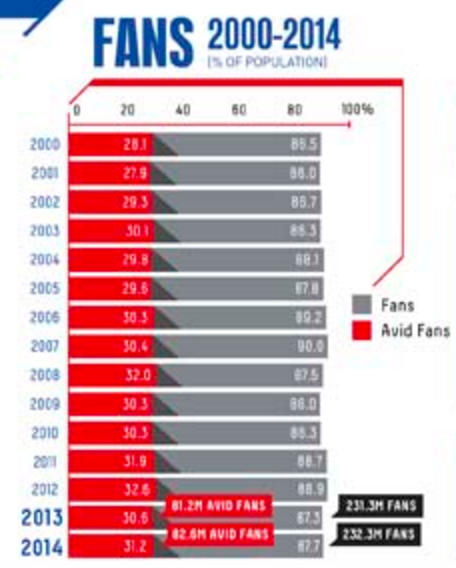
src:
Jess3 (the graphic’s designer), 2015.
Using ESPN Sports Poll data, collected by Rich Luker and Chad Menefee. Contact: chad@lukerontrends.com
TO DO: EMAIL CHAD MENEFEE TO ASK FOR OLDER DATA
The ESPN Sports Poll has also been tracking college sports fans at least since 2000. This chart shows percentage and numeric data for 2000-2010.
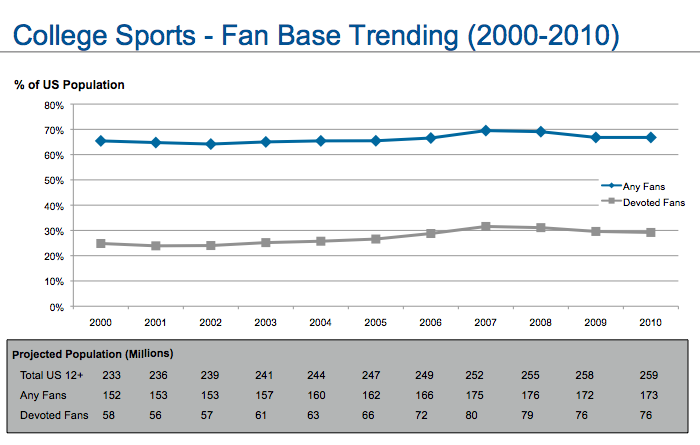
src:
Kenneth Cortsen. August 16, 2013.
“IMG’s Capitalization On Sport Stars And Other Assets – IMG College Is Meant For Success.”
Spending And Spectatorship
Pricewaterhouse Coopers publishes an annual 5-year-forecast of sports industry figures, including gate revenues and merchandising. The publications also include data for the previous five years. Data for 2008-2019 are freely available in the 2013, 2014, and 2015 editions, and I’ve aggregated the gate revenues and merchandising data in the following Google Sheet:
src: Adam W. Jones (editor). “PwC Sports Outlook.” PricewaterhouseCoopers LLP.
contact: adam.w.jones@us.pwc.com
November 2013 edition
October 2014 edition
October 2015 edition
*
Super Bowl Viewership
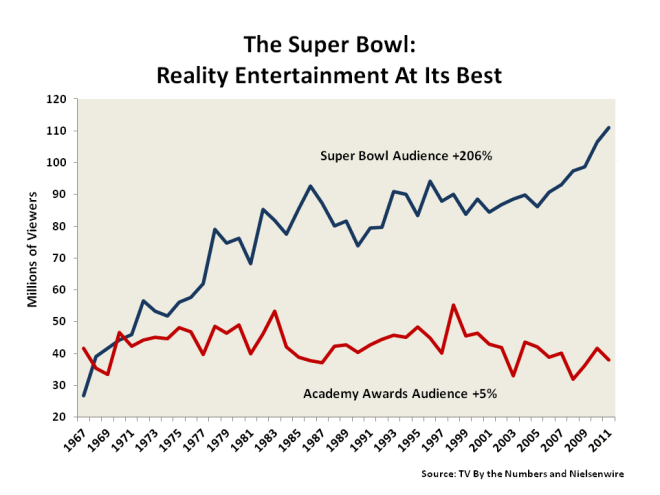
Src:
Stephen Bronars. February 2012.
“The Super Bowl and the Oscars.”
Citing:
TV By the Numbers and Nielsenwire
*
TV viewership of the Super Bowl in the United States from 1990 to 2016 (in millions)
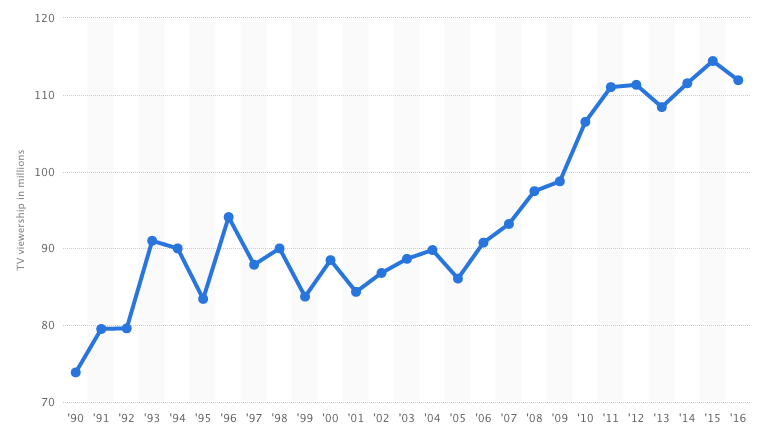
Src:
Statista. Accessed November 2016.
“TV viewership of the Super Bowl in the United States from 1990 to 2016 (in millions).”
TO-DO: EXTRACT THE ANNUAL DATA FROM THE DATA LINK (HOVER MOUSE OVER EACH DATA POINT ON THE CHART).
*
Professional League Game Attendance
ESPN collects historic game data, including attendance, going back to 2001, for several professional sports. However, Peter Von Allmen, an academic economist and current president of the North American Association of Sports Economists (NAASE), referred me to the [sport]-reference.com websites as an excellent source for historic sports data going back much further than ESPN’s data.
I’ve compiled the [sport]-reference.com data describing the number of teams and attendance (total regular season, and average per game attendance, in some cases) for the NBA, MLB, and NFL in the following Google Sheet:
Note: NBA data is collected for 1981-2016. Attendance figures are actually available going back to 1946, but only for a couple teams per season.
Srcs:
Basketball-Reference.com
[Click on a season date, then Summary, then Miscellaneous Stats to find attendance figures.]
Baseball-Reference.com
[Click on a season date, then Other, then Attendance & Misc.]
Pro-Football-Reference.com
[Click on “NFL” next to a season date, then Other, then Attendance]
NOTE: The tallies on the NFL site are incorrect, so I’ve re-calculated them
Other sources:
NHL attendance
ESPN has data back to 2001
but HockeyDB.com has league totals data back to 1994
and average home game data older than that
Average home game data
AWAITING AN EMAIL (5/2/16) FROM RALPH SLATE, WHO MAY BE WILLING TO SHARE
MLB and NFL data is available from ESPN, going back to 2001
NCAA Football
total fans per year 1954-2014
THERE’S A GRAPH, BUT ONLY 2014 IS LABELED WITH A FIGURE
src: National Football Foundation, June 2015
“2014 Report: Passion for College Football Remains Strong.”
*
Average NFL ticket price, 2006 – 2015
2006 – 62.38
2007 – 67.11
2008 – 72.2
2009 – 74.99
2010 – 76.47
2011 – 77.34
2012 – 78.38
2013 – 81.54
2014 – 84.43
2015 – 85.83
via Statista, citing TMR 2006 to 2015
(TMR: Team Marketing Report)
Major league facilities
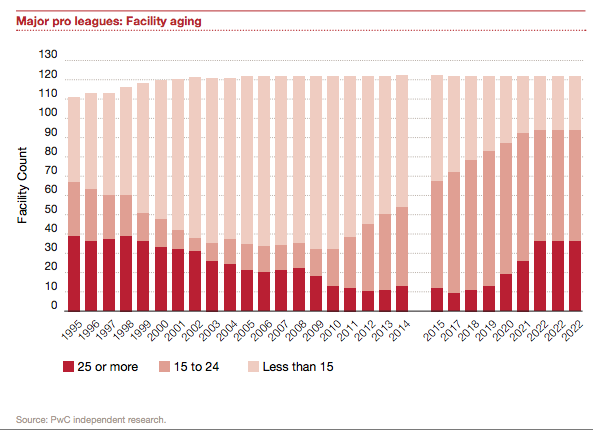
src: Adam W. Jones (editor). “PwC Sports Outlook.” October 2014. PricewaterhouseCoopers LLP. P.4
contact: adam.w.jones@us.pwc.com
Fantasy Sports
Number of fantasy sports players by year (Figure 2)
1988 500,000
1991-1994 1 – 3 Million
2003 15.2 Million
2004 13.5 Million
2005 12.6 Million
2006 18 Million
2007 19.4 Million
2008 29.9 Million
2009 28.4 Million
2010 32 Million
2011 35.9 Million
2014 41.5 Million
2015 56.8 Million
Percentage of fantasy sports players compared to the general population of the United States, age 12+ (Figure 1)
Total – 14%
Adults – 13%
Teens – 18%
Male – 19%
Female – 8%
College Education – 18%
No College Education – 10%
HH Income $50k+ – 16%
HH income <$50K – 10%
On average, fantasy sports players (age 18+) spend $465 on league-related costs, single-player challenge games, and league-related materials over a 12-month period. Up from $95 in 2012 (src: press release).
src: Fantasy Sports Trade Association. “Industry Demographics.” Accessed May 4, 2016.
press release for the recent research
