

Future of Sports

Src: USA Today
A report consulting leading futurists presents a picture of what professional sports might be like in the next 25 years. Predictions are made in three increments (1-5 years, 5-10 years, 10-25 years), but the editors stress that the report only describes a possible future, not a most likely scenario. It is intended to be a conversation starter, and should not be read as a high-confidence forecast. The report covers eleven facets of the industry, including facilities, venues, players, fans, etc. The report was commissioned by the operator of a global food service and hospitality company and owner of a major professional team.
The full report is available for free, but here are highlights by chapter:
1-5 years: genetic screening
5-10 years: genetic enhancements
10-25 years: natural & enhanced athletes
“Safe and detectable drugs that boost key physiological factors to specific, pre-determined amounts will be legal and will level the playing field for all. Success will be determined more by character, teamwork, strategy, and the mental edge than by the genetic lottery. In this sense, sports will become a purer test than we have today.”
The carefully managed genetic enhancements might allow for:
increased red blood cell count for better oxygen delivery
stamina increased 60%
muscle mass doubled
pain pathways blocked
skeletal density increased
Enhanced athletes and natural athletes might compete in separate leagues, with the leagues meeting in championship games between natural and enhanced players.
All players will also be enhanced by courts/fields that increase performance.
1-5 years: demand for data flow (via smart phones, etc)
5-10 years: video advances
10-25 years: urban integration
Video walls in stadium architecture; on-field holographic replays, glasses-free 3D tech in luxury boxes; VR rides in the stadium for fans.
Smaller stadium footprints, enabled by self-driving self-parking cars and high-speed mass transit, allow stadiums to be built in city centers; modular/adaptable construction for variety of events; variety of fan areas.
More alcohol sales (enabled by driverless cars, mass transit); more security cameras, facial recognition.
1-5 years: the death of one-size-fits-all broadcasting (variety of consump options; Google likely buys rights for a major league)
5-10 years: divergence (news content comes from leagues, franchises, players, fans)
10-25 years: the convergence (fans re-integrate content from various sources and share)
Major networks lose control over content (to leagues, players, franchises, fans).
Influence of network commentators and journalists wanes due to social media access.
Major online platform (probably Google) buys multiyear broadcast rights for a league.
Fans access content from many sources all at once.
Fans integrate these streams into seamless, coherent, personalized viewing experiences.
Watch a game via VR headset from the perspective of your favorite player.
1-5 years: talent ecosystem emerges
5-10 years: better controllers
10-25 years: indistinguishable remote and in-person gameplay
Celebrity gamers challenge traditional sports stars for adulation.
Pro sports leagues embrace gaming.
Talent eco-systems supporting esports (coaches, high school teams, ranking, etc).
Hand-held controllers replaced by body movement and sensors.
Tactile feedback interfaces and AR/VR enable remote play.
1-5 years: increasingly responsive
5-10 years: fan-recorded content
10-25 years: increased fan input (extension of 1-5yr forecast above – more strategy decisions, like scouting)
Forced crowdsourcing of critical decisions, like whether to fire a player or coach after a scandal.
When every fan is wearing a high-quality video device, fans become a prime source for broadcast and replay material.
Team-designated ombudsmen will represent fans in major team decisions, and complex algorithms will predict fan reactions.
1-5 years: extreme sports league
5-10 years: robot experiments
10-25 years: sports zones
Extreme sports will adapt a more formalized competition format.
Robot trials will be run before humans perform to improve safety. Later, robotic exoskeletons and self-powered body suits further reduce injuries and death.
Designated competition areas in national wilderness areas.
1-5 years: move to digital
5-10 years: paper tickets go away (Apple establishes its own banking technology)
10-25 years: end of the line (no standing in lines for anything)
Leagues with their own digital currencies (probably NOT based on Bitcoin).
Seats chosen based on social media contacts, and social goals (families together, singles together, etc).
1-5years: women’s sports apparel expansion
5-10 years: job displacement
10-25 years: increased displacement of low-end workforce
Marketing focuses more on upper-mid-class women as mid-class wealth wanes.
As more fans are priced out of live games, “third venues” emerge. AR enables life-size replays up close in 3D theatrical venues
Src:
“The Future of Sports.” Josh McHugh, Po Bronson, Ethan Watters (editors). September 2015. Delaware North.
Acknowledgements:
Singularity University (Paul Saffo, Salim Ismail, Aaron Frank), Kamran Rosen (reporting and research), Gary Bettman, Wendy Selig, Ted Leonsis, Future Cities Lab, Clay Coffey, Luke Bronson, Blaise Zerega, SF Elite Academy, Rick Abramson, Amy Latimer, Todd Merry, Chuck Moran, John Wentzell, Garrett Law, Peter White, Roger Noll, Mark Charles, Margaret Johnson
For background on the motivation for the report, see:
“Bruins owner spearheads report on what sports will look like in 25 years.” Erik Brady. January 26, 2016. USA Today.
*
Many of the ideas above are echoed in a May 2015 article from the Stanford Graduate School of Business. In particular we’re already seeing line-optimization, seat-optimization, on-demand on-device replays, big growth in digital tickets, women and children as a key demographic.
Src:
“Five Trends Shaping the Future of Sports.” Ian Chipman. May 2015. Stanford Graduate School of Business
Energy Mix, Consumption, Prices, Emissions
Overview
Energy mix forecasts looking out 15 to 35 years are available from a handful of governmental, industry, and independent sources. The excerpts below are preceded by my brief notes, in italic, introducing the source.
General consensus: oil, gas, and coal continue to dominate the energy mix. Gas grows substantially; oil and coal are either level or decreasing. Renewables show the highest growth rates. Amongst renewables, solar shows the greatest growth. Energy intensity (or consumption per capita) decreases.
In addition to energy mix, the figures below also include forecasts for overall usage, intensity (per capita usage), prices, residential sources, and emissions.
Findings
U.S. Energy Information Administration
The U.S. Energy Information Administration (EIA) presents energy forecasts for a range of cases in its Annual Energy Outlook. The excerpts below refer to the Reference Case, wherein GDP grows at an average annual rate of 2.4%, and current laws and regulations remain basically the same. This is the “business as usual” scenario. Forecasts for five other scenarios are presented in the report, but are not excerpted here.
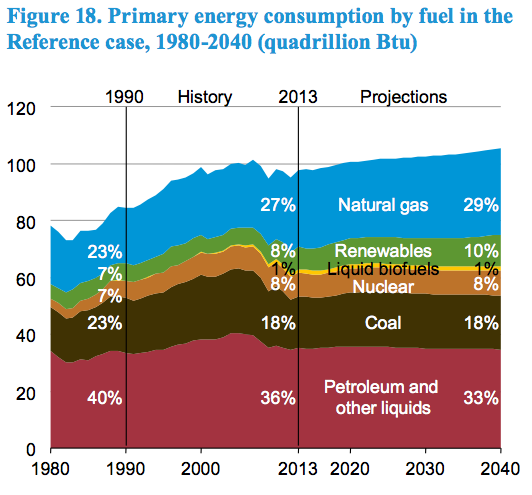
Total primary energy consumption grows in the AEO2015 Reference case by 8.6 quadrillion Btu (8.9%), from 97.1 quadrillion Btu in 2013 to 105.7 quadrillion Btu in 2040 (Figure 18).
data available here
web chapter here
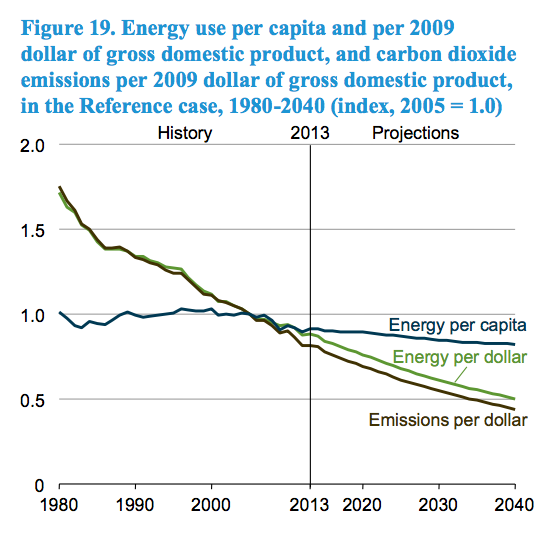
Energy intensity (measured both by energy use per capita and by energy use per dollar of GDP) declines in the AEO2015 Reference case over the projection period (Figure 19).
data available here
web chapter here
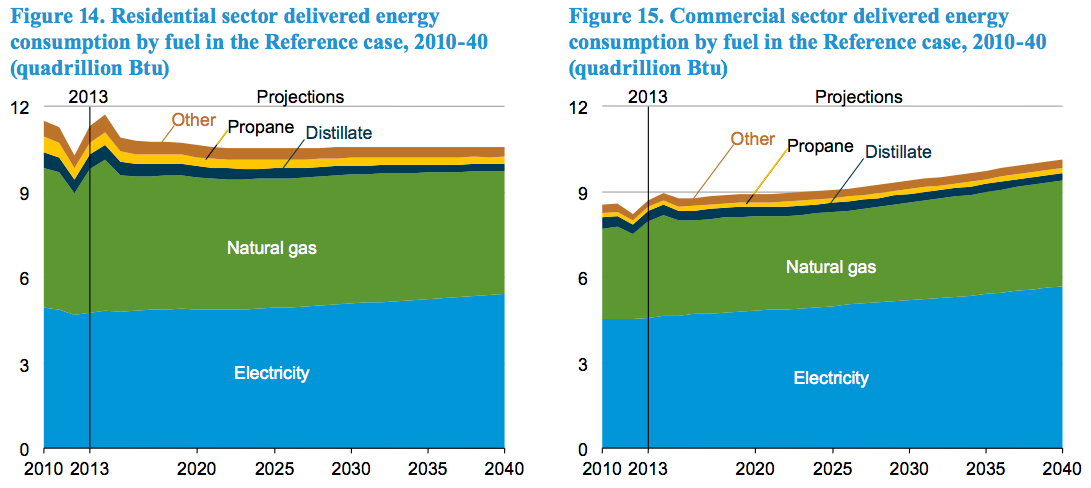
Delivered energy consumption decreases at an average rate of 0.3%/year in the residential sector and grows by 0.6%/year in the commercial sector from 2013 through 2040 in the AEO2015 Reference case (Figure 14 and Figure 15). Over the same period, the total number of households grows by 0.8%/year, and commercial floorspace increases by 1.0%/year (Table 4).
data available here and here
web chapter here
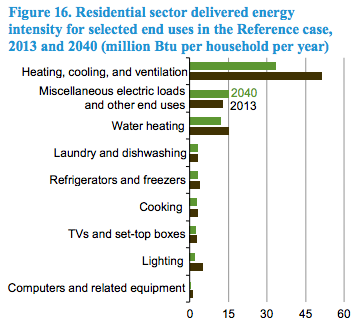
End-use energy intensity, as measured by consumption per residential household or square foot of commercial floorspace, decreases in the Reference case as a result of increases in the efficiency of equipment for many end uses (Figure 16 and Figure 17). Federal standards and voluntary market transformation programs (e.g., Energy Star) target uses such as space heating and cooling, water heating, lighting, and refrigeration, as well as devices that are rapidly proliferating, such as set-top boxes and external power supplies.
data available here
web chapter here
Src:
U.S. Energy Information Administration. April 2015. “The Annual Energy Outlook 2015.” DOE/EIA-0383(2015)
Contacts
Director: John J. Conti john.conti@eia.gov
General questions: Paul Holtberg paul.holtberg@eia.gov
[more contacts listed in the report TOC]
*
World Energy Council
The World Energy Council (WEC) is the UN-accredited global energy body comprised by more than 3000 member organizations drawn from governments, private and state corporations, academia, NGOs and energy-related stakeholders. WEC publishes many recurring reports, but in 2013 it released a set of projections to 2050.
The report focuses on two scenarios: a more consumer-driven scenario (called “Jazz”), and a more voter-driven scenario (called “Symphony”). Jazz has a focus on energy equity with priority given to achieving individual access and affordability of energy through economic growth. Symphony has a focus on achieving environmental sustainability through internationally coordinated policies and practices.
| Primary Energy Mix, 2010 and 2050 (Jazz and Symphony) | |||
| 2010 | 2050 Jazz | 2050 Symphony | |
| Fossil fuels (coal, oil, gas) | 79% | 77% | 59% |
| Renewables | 15% | 20% | 30% |
| Nuclear | 6% | 4% | 11% |
| World Energy Council Jazz and Symphony Projections for North America, 2010-2040 | |||||||||
| 2010 | 2020 | 2030 | 2040 | 2050 | 2020 | 2030 | 2040 | 2050 | |
| Total Primary Energy Supply (EJ/y) | 116 | 128 | 135 | 136 | 130 | 118 | 114 | 108 | 105 |
| Total Electricity Generation (TWh/y) | 5,214 | 6,152 | 6,903 | 7,728 | 8,024 | 6,100 | 6,733 | 7,695 | 8,057 |
| Carbon Price (US$2010/tCO2) | 8 | 15 | 21 | 28 | 21 | 28 | 55 | 70 | |
| CO2 – Emissions (GtCO2/y) | 6.5 | 7.2 | 7.3 | 7.2 | 6.7 | 6.2 | 5.4 | 4.4 | 3.1 |
| Carbon Capture, Use And Storage (GtCO2/y) | 0.0 | 0.0 | 0.0 | 0.1 | 0.2 | 0.0 | 0.1 | 0.3 | 1.1 |
10 Key Messages
- Energy system complexity will increase by 2050.
- Energy efficiency is crucial in dealing with demand outstripping supply.
- The energy mix in 2050 will mainly be fossil based.
- Regional priorities differ: there is no ‘one-size-fits-all’ solution to the energy trilemma.
- The global economy will be challenged to meet the 450ppm target without unacceptable carbon prices.
- A low-carbon future is not only linked to renewables: carbon capture, utilisation and storage (CC(U)S) is important and consumer behaviour needs changing.
- CC(U)S technology, solar energy and energy storage are the key uncertainties up to 2050.
- Balancing the energy trilemma means making difficult choices.
- Functioning energy markets require investments and regional integration to deliver benefits to all consumers.
- Energy policy should ensure that energy and carbon markets deliver.
Scenarios are alternative views of the future which can be used to explore the implications of different sets of assumptions and to determine the degree of robustness of possible future developments. While most widely known scenarios are normative, the WEC has adopted a different, exploratory approach. ‘Normative’ in this context means that the scenarios are being used to drive the world towards a specific objective such as a particular atmospheric CO2 level. In contrast, the WEC with its exploratory scenarios Jazz and Symphony, attempts to provide decision makers with a neutral fact-based tool that they will be able to use to measure the potential impact of their choices in the future.
This approach can only be done successfully by a network like the WEC’s with its impartial and inclusive membership structure. Over 60 experts from more than 28 countries have contributed to the WEC’s scenario building process over a period of three years.
Src:
World Energy Council. 2013. “World Energy Scenarios: Composing Energy Futures to 2050”
*
BP
BP produces a 20-year forecast based on a single, most-likely growth trajectory.
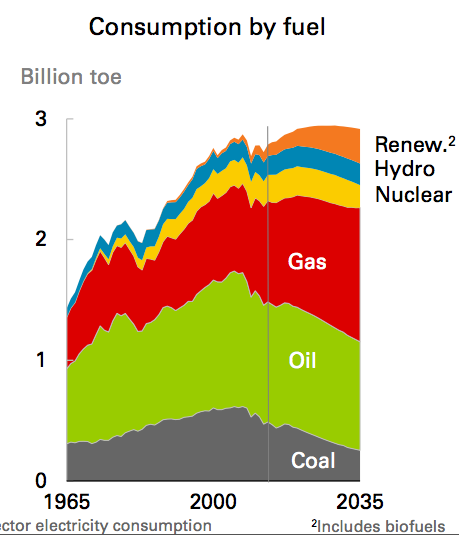
Oil consumption declines 0.5% p.a. over the Outlook as a result of falling demand in the transport sector. Coal declines by 2.9% p.a., driven by more aggressive environmental policies and competitively priced natural gas. Nuclear (-0.6% p.a.) demand also declines over the Outlook. Natural gas is the only fossil fuel to grow over the Outlook (1.3% p.a.). Renewables are the fastest growing group of fuels, increasing by 5.1% p.a.. Hydro-electric power increases 0.6% p.a., faster than total energy demand.
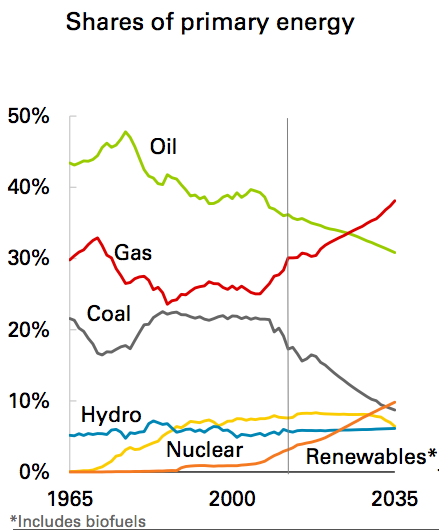
Shares of fossil fuels in the energy mix decline from 83% today to 78% by 2035. Shares of renewables (including biofuels) increase from 3% in 2013 to 10% in 2035, while hydro remains stable throughout the Outlook at 6% and nuclear remains near 8% until losing market share in the last few years of the Outlook. Shares of natural gas grow from 30% in 2013 to 37% in 2035, overtaking oil as the leading fuel around 2025. More than half of the increase in energy demand from 2013-2035 is met by natural gas. Oil’s market share declines throughout the Outlook, reaching just 31% by 2035, the lowest share on record and down from a high of 48% in 1977. Coal’s share drops to just 9%, also the lowest on record. Renewables overtake coal as the third largest fuel by market share by the end of the Outlook.
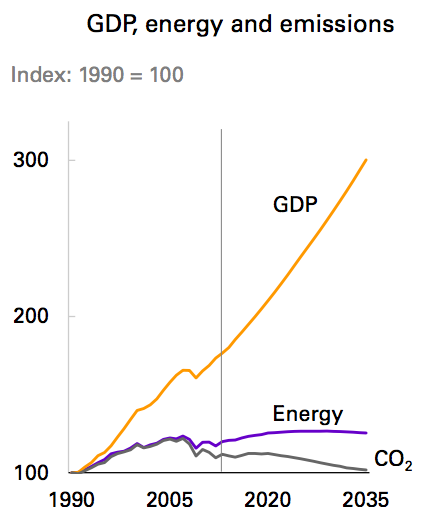
Continuing declines in energy intensity – the broadest indicator of improving energy efficiency across the economy – leads to a marked widening in the gap between GDP and energy consumption. Energy intensity declines by 39% by 2035 (-2.2% p.a.). Total carbon emissions from energy consumption decrease by 9% between 2013 and 2035 (-0.4% p.a.), with the rate of decline speeding up in the last half of the outlook, (-0.7% p.a. from 2025 to 2035).
Src:
BP. February 2015. “Energy Outlook 2035: Focus on North America.”
Excel tables (49.8KB)
Country Insights: US
*
The International Renewable Energy Agency
The International Renewable Energy Agency (IRENA) is an intergovernmental organisation that supports countries in their transition to a sustainable energy future, and serves as the principal platform for international co-operation, a centre of excellence, and a repository of policy, technology, resource and financial knowledge on renewable energy. As of December 2015, there are 144 member states, including the US.
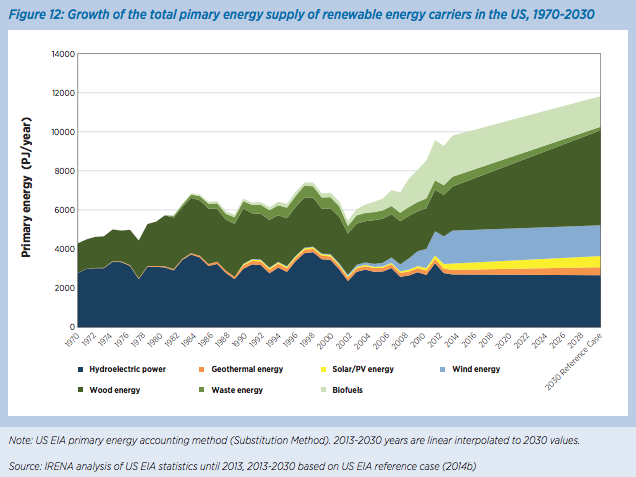
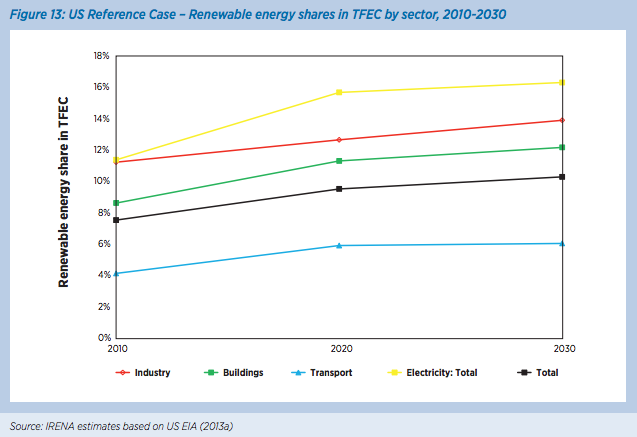
The following excerpts come from a report on renewable energy sources and consumption in the US. Although the report focuses on the potential to dramatically increase renewable energy, the excerpts here highlight it’s projections for conservative, or business as usual, usage of renewables. The data in their report is from the US Energy Information Agency.
In 2010, the US was the second largest energy consumer in the world with a total final energy consumption (TFEC) of 64 exajoules (EJ), equivalent to 19% of the global TFEC (IEA, 2013a). The US TFEC is projected to remain stable in the period between 2010 and 2030 growing by only 4% according to US Energy Information Agency‘s Annual Energy Outlook (AEO) (US EIA, 2013a). In the same time period, based on current policies or the Reference Case according to this study, the US share of renewable energy in the TFEC will only grow from 7.5% in 2010 to 10% in 2030, driven mostly by an increase in renewable power generation.
The Reference Case for the US was based on the U.S. Energy Information Agency’s “Annual Energy Outlook 2013”
Renewable energy share in TFEC of the US stood at 7.5% in 2010 (the base year of REmap 2030 analysis). This included 2.4% renewable power, 1.6% liquid biofuels and the remainder (3.4%) largely solid biomass in industry and building heating.
Src:
IRENA. 2015. “Renewable Energy Prospects: United States of America, REmap 2030 analysis.”
