

Prosthetic Limbs Forecast to 2050
Summary
In searching for prosthetic device usage rates and forecasts, I’m finding that the most accessible type of data available describes incidence of limb loss and associated prostheses. Data describing usage rates for other types of prostheses and assistive devices has been harder to find (for example, dental prostheses, cochlear implants, artificial heart valves, etc). This summary and set of excerpts focuses on limb loss and associated prostheses.
The CDC, via its National Health Interview Survey, collected data on the number of people using upper and lower limb prostheses. Data was collected in the mid 1990s – I’m not sure if CDC has more recent (or older) figures. (Email inquiry on Oct 6, 2015. No reply as of Oct 8.)
The US Department of Health and Human Services has documented rates of amputation in the US via its Healthcare Cost And Utilization Project (HCUP), although this effort does not document rate of prostheses usage. Estimated rates of prosthesis usage by amputees vary widely.
The National Commission on Orthotic and Prosthetic Education (NCOPE) has published a workforce demand study forecasting prosthesis user figures through 2020. An academic study has forecast amputee figures to 2050. We could apply the usage rate used in the NCOPE study to extrapolate a number of users from that second study.
*
Follow-up Notes
CC emailed CDC. CC emailed reps from SFB’s Devices & Materials Committee and BMES’s Medical Devices Special Interest Group (including someone from FDA).
Donna Lochner (FDA) is not aware of any centralized repositories for overall prosthetics data, but she made a few suggestions by email: check the Center for Medicare and Medicaid Services (CMS) for the Medicare population, and individual registries by product areas (eg: INTERMACS for mechanically-assisted circulatory support devices; the Society for Thoracic Surgeons and the American College of Cardiology for transcatheter heart valves). Lochner thinks the highest volume implants are intraocular lenses, and this might be an area where CMS data would capture the vast majority of the implants.
Emailed William Polglase of CMS for assistance in interpretting data (10/15).
Emailed Medtech Solutions (recommended by BMES) to ask about general tallies.
Research Excerpts
Currently, there are an estimated 1.9 million people living with limb loss in the United States, almost half of whom are non-white. At its peak, an estimated 185,000 amputations occurred in 1996 in the United States.
Amputation rates in the total population (including individuals without diabetes, or with peripheral artery disease alone) are not known and active surveillance efforts do not exist.
Src:
Limb Loss Task Force/Amputee Coalition. 2012. “Roadmap for Preventing Limb Loss in America: Recommendations From the 2012 Limb Loss Task Force.”
*
82% [of amputations] are due to Peripheral Vascular Disease and Diabetes. More than 65 percent of amputations are performed on people age 50 and older.
While diseases such as diabetes and peripheral vascular disease are the leading causes of amputation, accidents and war continue to play a major role in driving the limb prosthetics market.
Technological growth and an increasing consumer base of amputees are bolstering the prosthetics market growth, according to an analysis from the business and research consulting firm Frost & Sullivan. The overall prosthetics market in the United States earned revenues of $1.45 billion in 2006 and estimates that number to reach $1.85 billion by 2013. The global dental prosthetics market is estimated to exceed $5 billion. Hip and knee replacements are big drivers of the orthopedic prosthetic market. Over 100,000 cochlea implants are currently in place globally. The limb future prosthetics devices and the accompanying services market are estimated to exceed $5 billion (of which an estimated $3 billion alone is in amputee patient services) in the U.S.
The lack of common standards, a common lexicon and common data collections negatively impact on the ability to assemble precise market data on limb prosthetics. A National Institutes of Health study concluded, “For example, documented rates of prosthesis use vary from 27 to 56 percent for upper-limb amputation (ULA) and from 49 to 95 percent for lower-limb amputation (LLA). A number of studies have attempted to identify variables that explain inconsistent use rates and identify persons less likely to wear and benefit from a prosthesis. Unfortunately, the existing literature is equivocal and limited by a number of factors.”
Research at the Bioengineering Institute of Worcester Polytechnic Institution, University of Utah, University of Washington and the University of Illinois at Chicago are current leaders in osseointegration and limb transplantation research.
Among the sources for this market analysis are:
Walter Reed Army Medical Center
Henry Jackson Foundation
Amputee Coalition of America
O&P Edge
The Press-Enterprise
Frost & Sullivan
Securities and Exchange Commission
Boston Globe
Aetna Insurance
Atlas of Prosthetics
National Institutes of Health
Disabled-World.com
One Source
ArmDynamics.com
some of the above tallies are from:
Persons Living with Limb Loss, 1996
National Health Interview Survey, Vital Statistics Report, Series 10, No. 200.
New Cases of Limb Loss, 1996
Health Care Utilization Project National Inpatient Sample (HCUP-NIS), 1996.
It is estimated that approximately 199,000 persons in the U.S. were using an artificial limb in 1994, with the majority using an artificial leg or foot (173,000).
Datasource: National Center for Health Statistics,
Disability Report. Table 1
EMAILED nhis@cdc.gov TO SEE IF ITS BEEN UPDATED
Src:
Dr. Grant McGimpsey and Terry C. Bradford. “Limb Prosthetics Services and Devices” [White paper]. Bioengineering Institute Center for Neuroprosthetics, Worcester Polytechnic Institution.
*
The total number of persons with an amputation, and those using a prosthesis, is expected to increase by at least 47% by the year 2020.
The projected number of persons with amputations (excluding tips of fingers and toes) is based on rates by age group and sex determined in the 1993 Health Interview Survey. These projections (Table VII) assume that the rates will remain stable through the year 2020. The total number of persons with an amputation is expected to increase by 47% between 1995 and 2020. Of the total number of persons with amputations it is estimated that 75% use a prosthesis. The population using a prosthesis is also anticipated to increase by 47% during this time period. With the advent of improved prosthetic designs and lighter materials it is likely that the rate of use may increase, particularly if third party payers become more aware of the benefits of these products.
Table VII
Projected Number of Persons with Absence of Extremities
(excluding tips of fingers and toes) 2000-2020
Year — Total Number — No. Of Users of Prostheses*
2000 — 1,752,838 — 1,314,629
2005 — 1,904,035 — 1,428,026
2010 — 2,065,993 — 1,549,495
2015 — 2,224,022 — 1,668,017
2020 — 2,382,413 — 1,786,810
*Based on 75% of total numbers of persons with amputations.
Src:
Caroline C. Nielsen. 2002 May. “Issues Affecting The Future Demand For Orthotists And Prosthetists:Update 2002.” National Commission on Orthotic and Prosthetic Education
Citing:
Benson, V and Marano, MA. Current Estimates for the National Health Interview Survey, 1993. National Center for Health Statistics. Vital Health Statistics 10 (190). 1994.
Estimated number of persons with an amputation using a prosthesis (75%) estimated from data in 1) Current Estimates for the National Health Interview Survey, 1993 ; 2) Scremin, A.M. et al. Effect of Age on Progression Through Temporary Prostheses After Below-Knee Amputation. Am. J. of Phys. Med. and Rehab, 1993, and 3)Nielsen, C.C. A Survey of Amputees: Functional Level and Life Satisfaction, Information Needs and the Prosthetist’s Role, JPO, 1991.
NOTE: An updated version of this report was produced for NCOPE in 2015, but it does not provide estimates for the number of prosthesis users. (Instead it calculates the number of O&P doctors in demand.) I’ve written to the author to inquire if that data is available. The updated report is:
Joan E. DaVanzo, Audrey El-Gamil, Steven Heath, et al. 2015. “Projecting the Adequacy of Workforce: Supply to Meet Patient Demand.” National Commission on Orthotic and Prosthetic Education. p.17, Exhibit 5 – 2014 figures. p.19, Exhibit 6 – 2016, 2025 projections.
*
In the year 2005, 1.6 million persons were living with the loss of a limb. It is projected that the number of people living with the loss of a limb will more than double by the year 2050 to 3.6 million.
Table 3
Projected Prevalence of Limb Loss by Etiology and Age (in thousands)
Year — Total
2005 — 1,568
2010 — 1,757
2020 — 2,213
2050 — 3,627
…Most striking, however, are the projected trends for the number of people living with the loss of a limb. This increase is related to the aging of the population and the associated increase in the number of people living with dysvascular conditions, especially diabetes. The prevalence of diabetes in the United States is projected to nearly double by the year 2030 solely because of changes in the demographic composition of the population. Our estimates of limb loss reflect, and indeed magnify, these trends. Even assuming that age-, sex-, and race-specific rates of both diabetes and diabetes-related amputations remain unchanged, the number of people with diabetes who are living with the loss of a limb will nearly triple by the year 2050. Overall, the prevalence of limb loss will more than double from 1.6 to 3.6 million people. Given the increase in the prevalence of obesity and the known relationship between obesity and diabetes, a projected increase in the incidence of amputations secondary to dysvascular conditions is likely.
…A goal of Healthy People 2010 is to reduce the number of lower-extremity amputations in persons with diabetes by 55%, from 4.1 per 1000 to 1.8 per 1000 persons.
Src:
Ziegler-Graham K, MacKenzie EJ, Ephraim PL, et al. 2008. “Estimating the prevalence of limb loss in the United States: 2005 to 2050.” Archives of Physical Medicine and Rehabilitation, 89(3).
*
UPDATE 10/27: INTERMACS confirmed tallies for ventricular assist devices from 2006-2015. They estimate that their figures cover 90-95% of the market.

[click for larger]
Annual new patient tallies are at the top of the chart area.
Injuries Data
Current injuries data is collected by two federal agencies, the Centers For Disease Control, and the Bureau for Labor Statistics. The CDCs data describes overall injury rates (fatal and nonfatal) going back to 2002. BLS’s data describes work-related injury and illness rates (fatal and nonfatal) going back to 1992 (only 2003 for nonfatal incidents).
The Pardee Center for International Futures produces the most long-ranging forecasts for injury- and illness-related fatalities that I’ve found so far. (As far as I can tell, their forecasts do not included non-fatal incidents.) I’ve taken samples of their data from the top of the decade through 2050, but annual data are available from 2010 through 2100.
Data from all three sources (CDC, BLS, and Pardee) are aggregated in this Google Spreadsheet:
This graphic from a 2011 Pardee paper shows the general trend in fatalities due to injuries versus disease:

Src: Barry B. Hughes, Randall Kuhn, Cecilia M. Peterson, et al. 2011. “Projections of global health outcomes from 2005 to 2060 using the International Futures integrated forecasting model.” Bulletin of the World Health Organization.
Supplement Usage Prevalence
Usage Trends
The CDC tracks U.S. dietary supplement usage (which includes multivitamins and multiminerals) via its National Health and Nutrition Examination Survey (NHANES), which began in the 1970s. In 2011, the CDC said over half of U.S. adults were taking dietary supplements.
Overall usage trend:
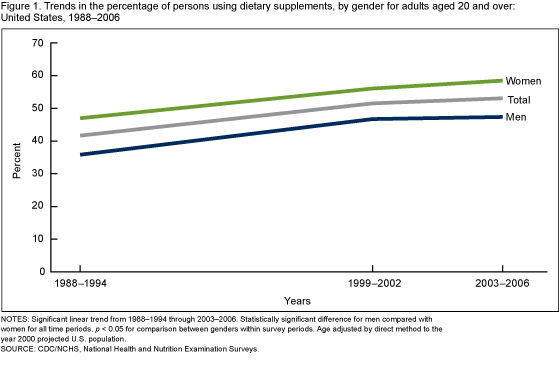
Usage prevalence percentages for adults over 20:
| Year | Men | Women |
| 1971-1975 | 28% | 38% |
| 1976-1980 | 32% | 43% |
| 1988-1994 | 35% | 44% |
| 1999-2000 | 47% | 56% |
| 2003-2006 | 47% | 59% |
Vitamin D use by age group and gender:
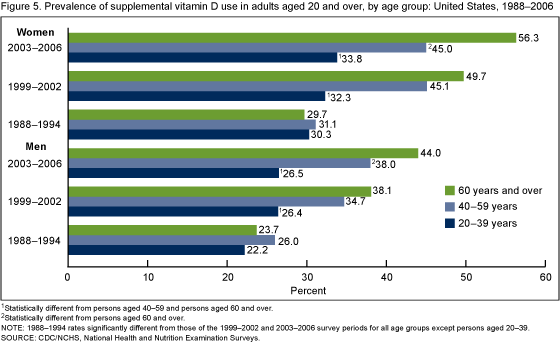
Srcs:
Gahche J, Bailey R, Burt V, et al. 2011. “Dietary Supplement Use Among U.S. Adults Has Increased Since NHANES III (1988–1994).” NCHS data brief, no 61. Hyattsville, MD: National Center for Health Statistics.
Madison Park. 2011 April 13. “Half of Americans Use Supplements.” CNN.
Market Research
Euromonitor tracks the vitamins and dietary supplements (VDS) market. In 2013, they estimated that the market would grow at a CAGR of 4% between 2013 and 2018 to reach $112 billion in 2018.
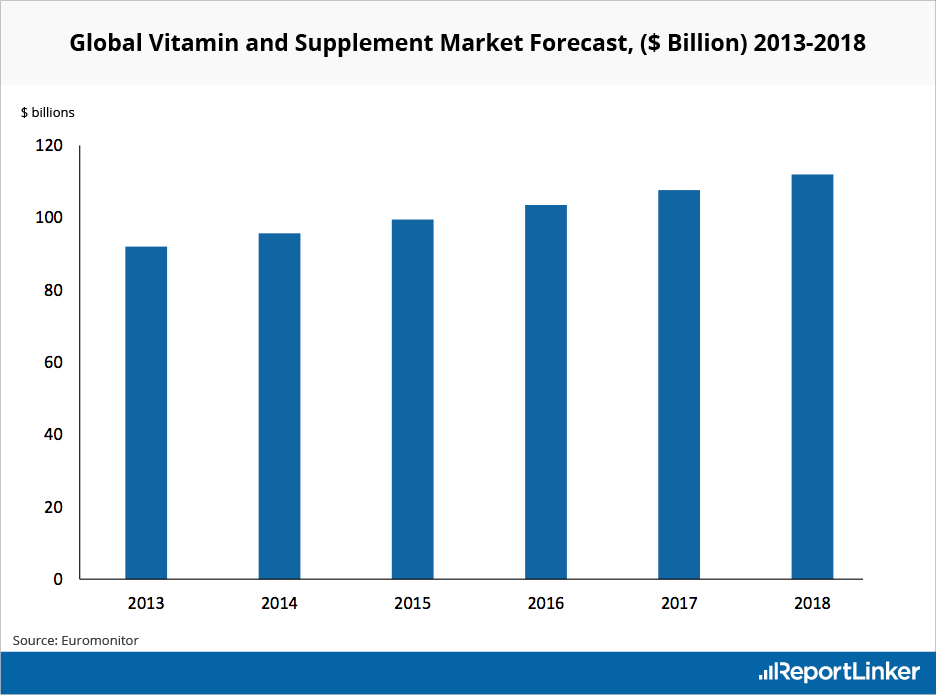
Src:
Euromonitor (via Reportlinker). 2013. “Global Vitamin and Supplement Industry Overview.”
