

Clothing Expenditures and Prices
Overview
The Bureau of Labor Statistics tracks apparel expenditures as well as indexed prices (CPI – prices relative to a base year, not actual prices). Apparel includes a broad range of subcategories. Where available, we have also sought item-level data, using men’s Tshirts as an exemplar. Expenditure data is available going back to 1990. CPI data is available going back to 1947. Tshirt CPI data is available back to 1997 (possibly earlier – awaiting clarification from BLS). No forecasts found.
Findings
Clothing Expenditures – 1990-2014
Google Spreadsheet
The apparel and services category had one of the largest increases in 2014.
Average expenditures per consumer unit in 2014 were $53,495, a 4.7percent increase from 2013 levels, the U.S. Bureau of Labor Statistics reported today. During the same period, the Consumer Price Index (CPIU) rose 1.6 percent(1). In 2013, spending decreased 0.7 percent. Average pretax income per consumer unit increased at about the same pace as expenditures, up 4.8 percent from 2013.
Consumer units include families, single persons living alone or sharing a household with others but who are financially independent, or two or more persons living together who share expenses.
Srcs:
[embedded in chart above]
Note: The “Apparel and Services” category includes apparel and footwear for adults, children, and babies (including sportswear, and uniforms), as well as material for making clothes, shoe repair, alterations, sewing patterns and notions, clothing rental, storage, dry cleaning and sent-out laundry, watches, jewelry, and repairs to watches and jewelry.
Src:
Consumer Expenditure Survey Glossary, Bureau of Labor Statistics
*
Consumer Price Index, Apparel – 1947-2014
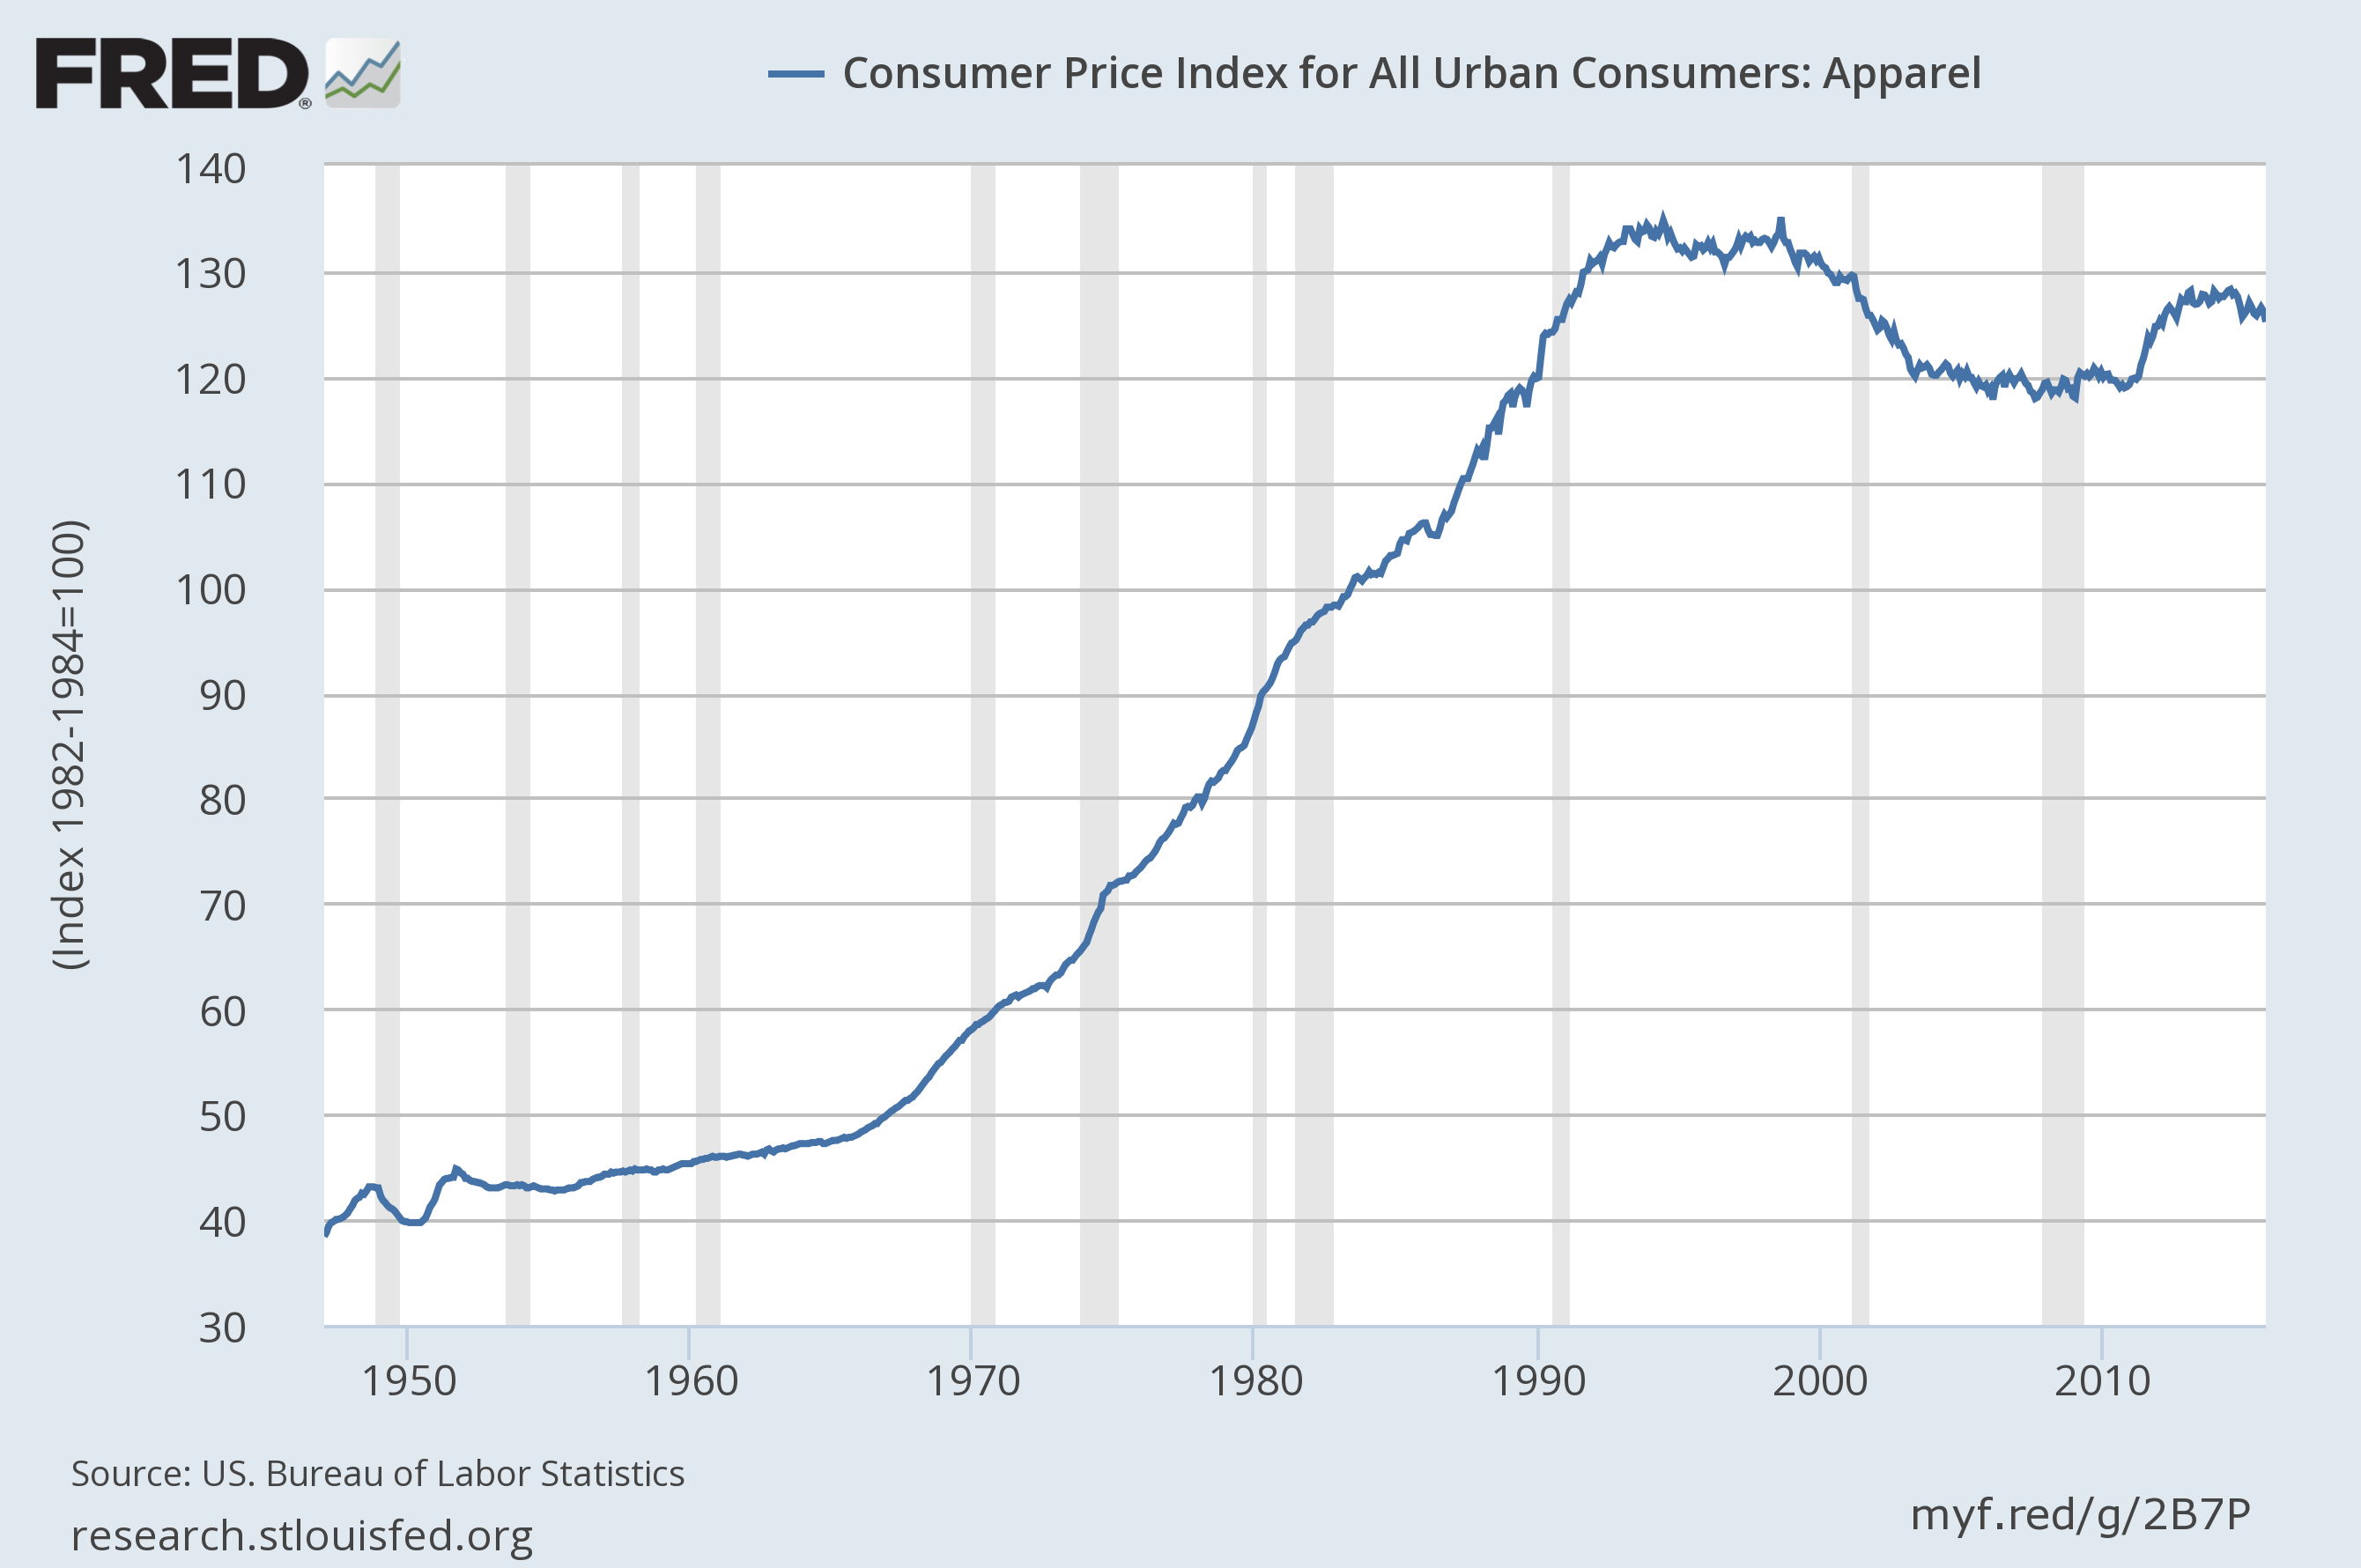
(click for larger)
Src:
US. Bureau of Labor Statistics, “Consumer Price Index for All Urban Consumers: Apparel [CPIAPPSL].” Retrieved from FRED, Federal Reserve Bank of St. Louis, November 18, 2015.
Note: Data available for download.
*
Shirt CPI 1998-2014
Men’s shirts and sweaters (SEAA03)
Series ID: CUUR0000SEAA03
base period: 1997
Annual average:
1998 100
1999 98.6
2000 98.3
2001 93.9
2002 88.8
2003 85.2
2004 85.3
2005 84.2
2006 84.7
2007 82.53
2008 80.444
2009 80.968
2010 78.642
2011 79.583
2012 82.224
2013 82.876
2014 80.973
Src:
“Consumer Price Index – All Urban Consumers.” Custom table, November 19, 2015. Bureau of Labor Statistics.
Nicole Rope, of the BLS CPI Apparel division, warns that there is much more volatility in individual clothing items that in the category on the whole (and more so compared with other items in other categories). She offers to speak with us if we have any other questions about apparel. 202-691-5395.
She also said that the Information and Analysis Section might also be helpful. Ken Stewart, manager, x6966. Steve Reed, senior economist x5378. They would be able to let us know if data older than 1997 is available. Shirt data was collected before that, but under a different name/definition.
UPDATE: Steve Reed shared the following data by email. He said that price data (not index data) older than 1977 may be available on an inconsistent basis. He will followup with whatever he can find later in December or January.
Annual Average CPI for Men’s Shirts 1978-1997
Series Id: MUUR0000SE3604
Not Seasonally Adjusted
Area: U.S. City Average
Item: Men’s shirts
Base Period: 198284=100
1978 81
1979 84.3
1980 91.4
1981 95.4
1982 98.4
1983 99.3
1984 102.4
1985 106.3
1986 107.1
1987 113.7
1988 119.9
1989 123.2
1990 128.1
1991 132.3
1992 135.3
1993 134.1
1994 131.5
1995 133
1996 135.3
1997 138.1
*
T-Shirt Prices – Misc dates 1938-2013
Based on old Sears catalogs featuring men’s white undershits
1938 .24 ($3.97 in 2013)
1945 .79 ($10.22 in 2013)
1955 .79 ($6.87 in 2013)
1970 1.492 (8.9512.01 in 2013)
1990 3.10 (Hanes)
2010 1.90 (Hanes)
2013 2.33 (Hanes)
Src:
Samantha Sharf. July 2, 2013. “The TShirt Turns 100.” Forbes.
