

Media/Internet Time Allotment
Overall Media Allotment
src:
Statista, accessed May 2018
citing: info not available (likely eMarketer)
*
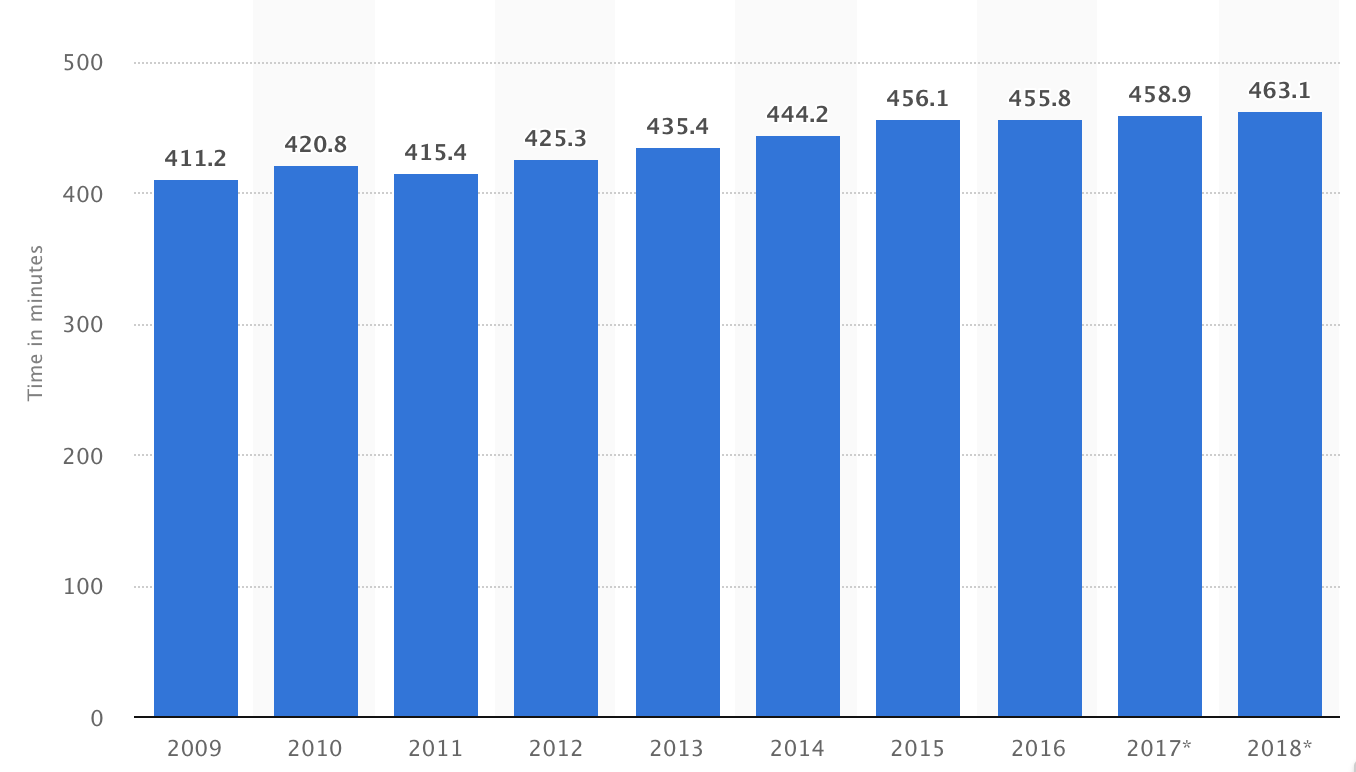
CC’s Note: eMarketer tracks the way people spend their time with media, showing comparison between desk/laptops, mobiles, non-streaming TV, radio, print
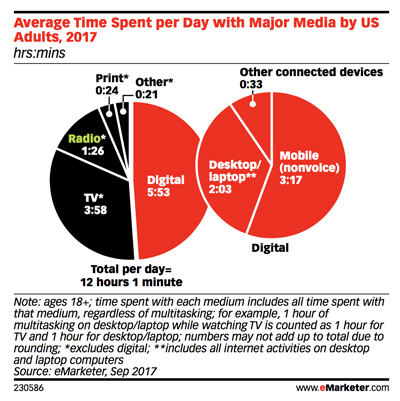
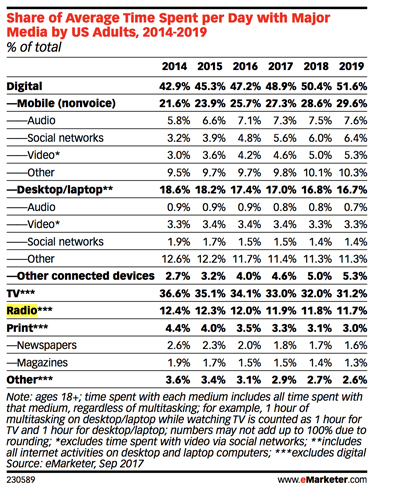
src: eMarketer, Sep 2017
via InsideRadio, Oct 2017
“EMarketer: Adults Spend Half Of Daily Media Usage On Digital”
*
UK Adults’ media time has plateaued
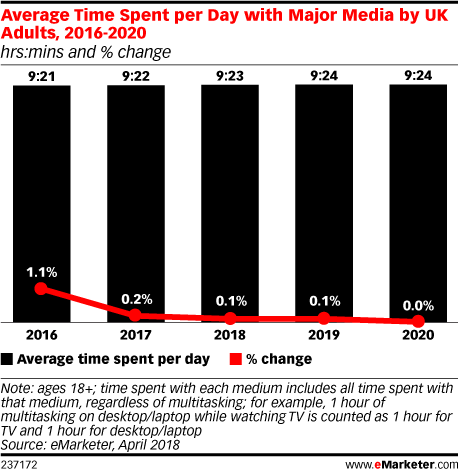
“The way that people consume media will continue to change,” said eMarketer’s UK analyst, Bill Fisher. “Many traditional habits are simply transitioning over to digital devices and platforms, while digital-only habits continue to proliferate. However, what’s apparent from this forecast is that UK adults have reached a plateau. While the media mix may ebb and flow, and it will increasingly flow toward mobile, adults’ media consumption capacity has reached its peak.”
*
src: eMarketer
small thumbnails retrieved 5/14/18
permalinks (data restricted by paywall)
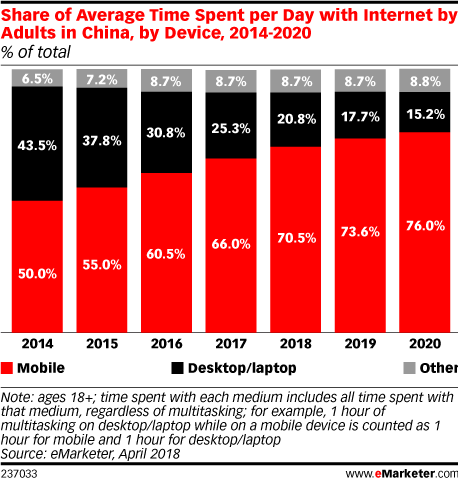
Average time spent per day with internet by adults in China by Device 2014-2020
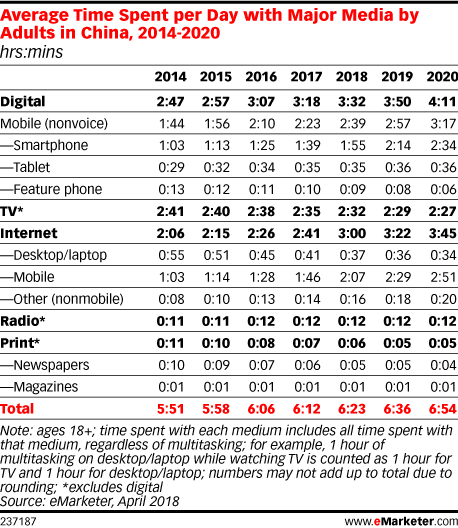
Average time spent per day with major media by adults in China 2014-2020
*
In 2017, daily time spent with digital media among adults will top 3 hours in Japan (3 hours 5 minutes) and South Korea (3 hours 26 minutes). Those in India will average less than half that time (1 hour 18 minutes), with digital accounting for just under one-third of total daily time spent with media.
src:
eMarketer, June 2017
*
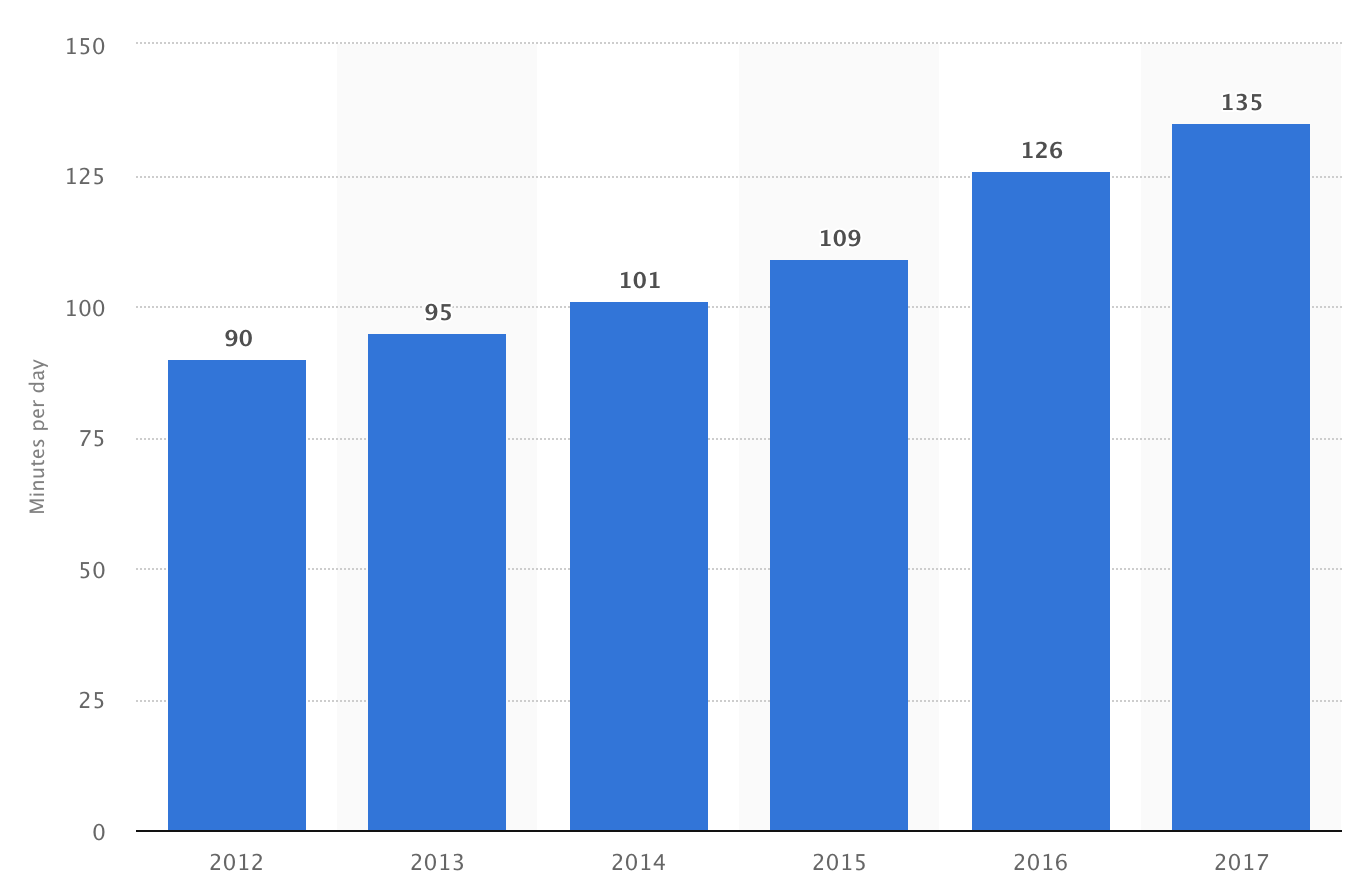
Daily time spent on social networking by internet users worldwide from 2012 to 2017 (in minutes)
src:
Statista, accessed May 2018
citing: untracked
*******
Mobile Time Allotment
FIGURE A3.1
Traffic Daily Profiles of the Five Major mobile Applications in North America (2020)
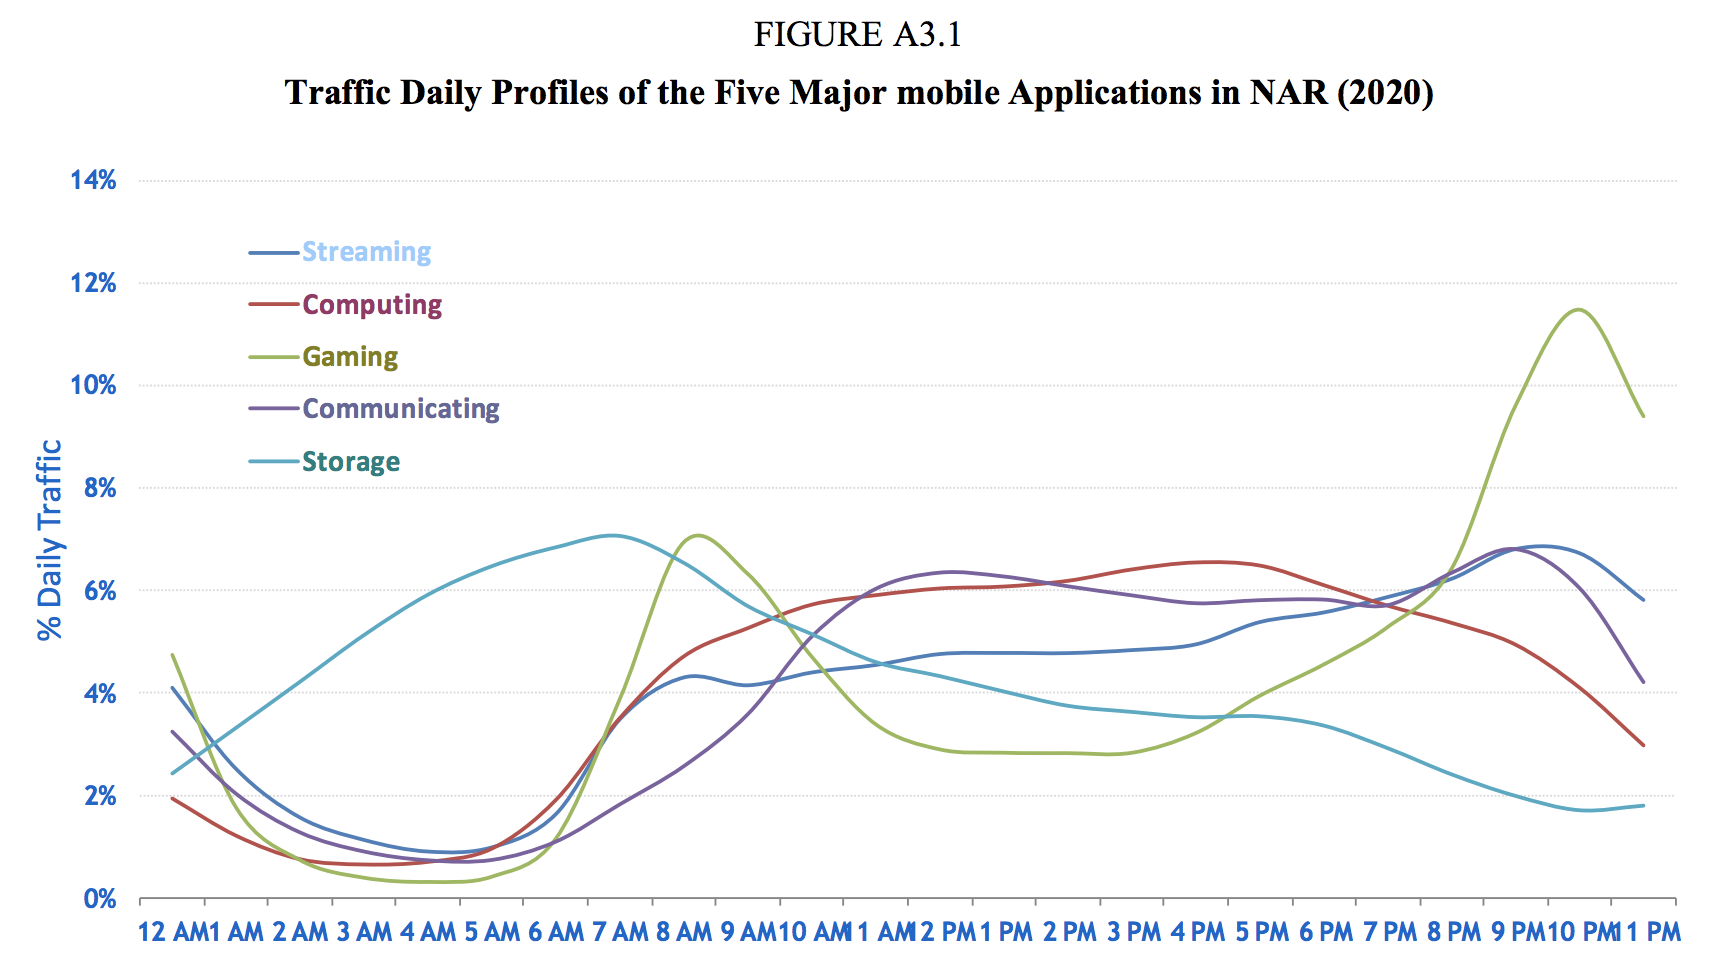
Figure A3.1 shows the daily profiles of the five major mobile applications in North American Region (NAR), namely, streaming (audio and video), computing (cloud processing, office productivity, other mobile applications), storage (media sharing, backup and device synchronisation), gaming (casual, interactive or emerging applications), and communicating (voice, video, e-mail and M2M). All these represent human behaviours and they are similar across geographies.
src:
International Telecommunication Union, July 2015
“Rep. ITU-R M.2370-0: IMT traffic estimates for the years 2020 to 2030”
P.40-41
citing:
Source: Bell-Labs, Alcatel-Lucent, 2015.
[CC’s note: Haven’t been able to track this down]
*
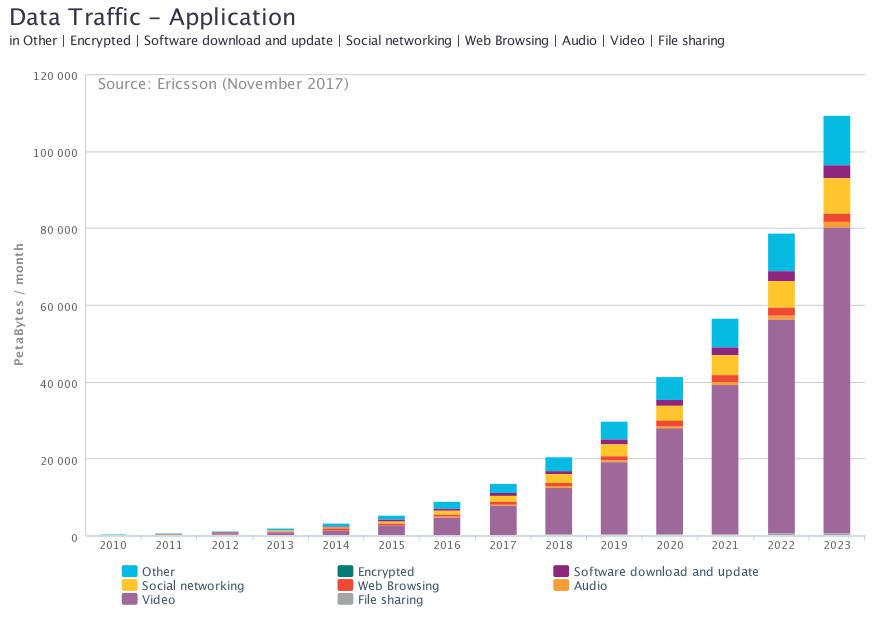
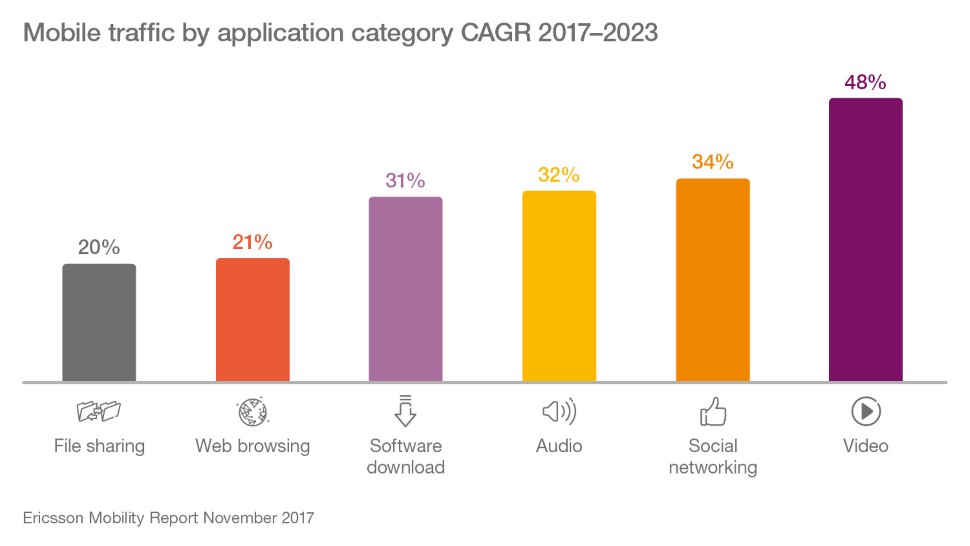
Mobile traffic distribution over different applications
Contrast with voice usage
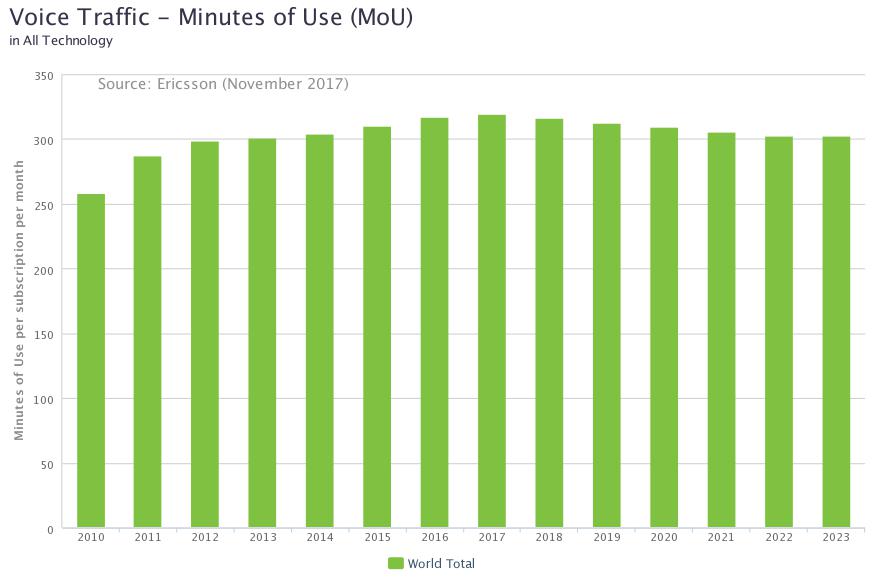
[Data here: Ericsson-Minutes-of-voice-monthly-2010-2023.xls]
src:
Ericsson, Accessed May 2018
Traffic Exploration [interactive data tool]
*
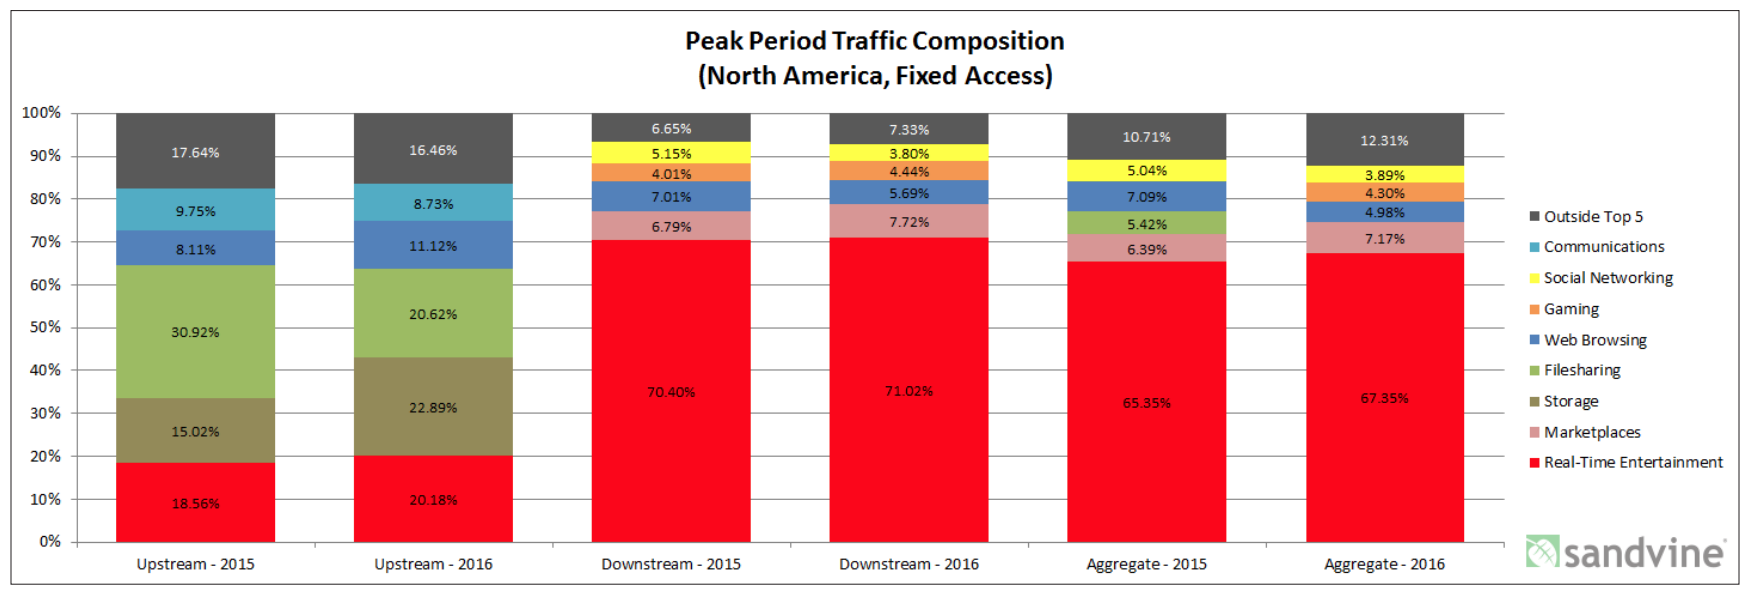
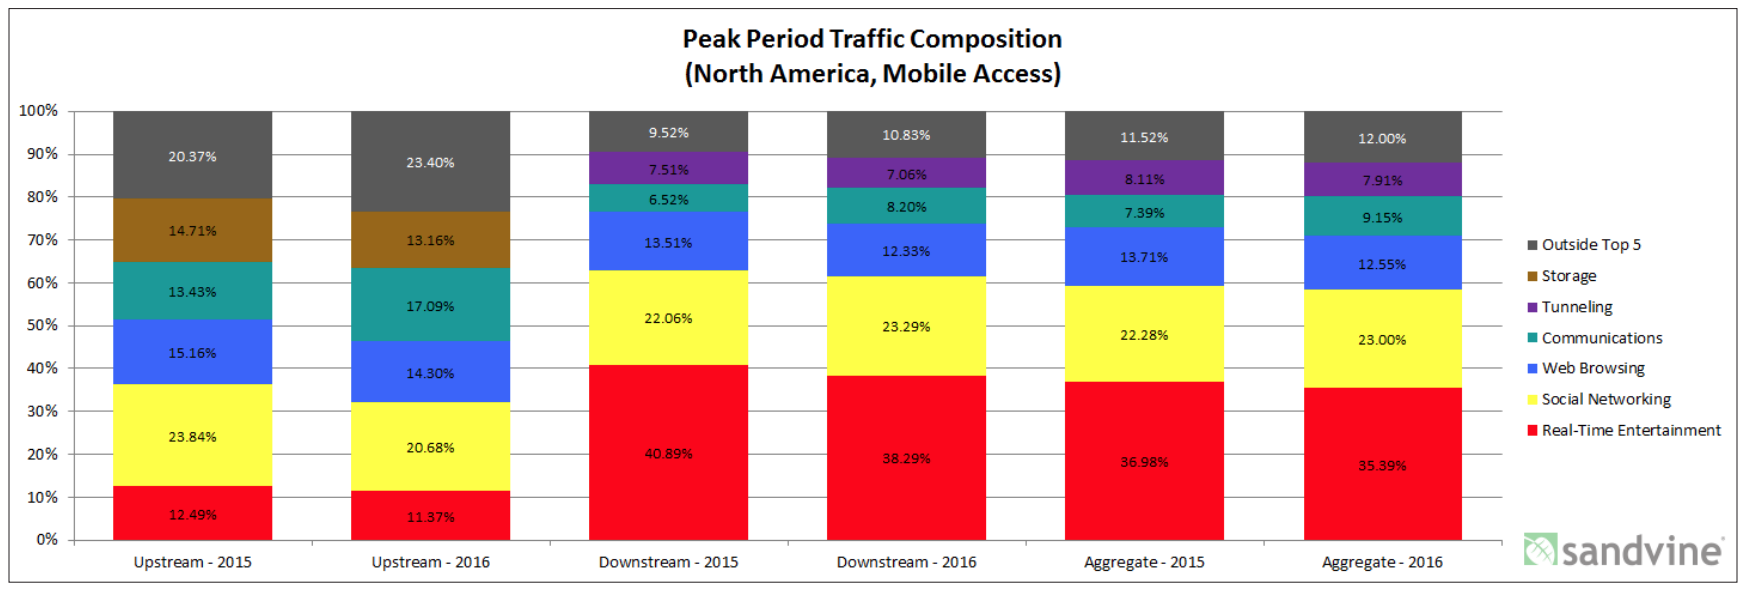
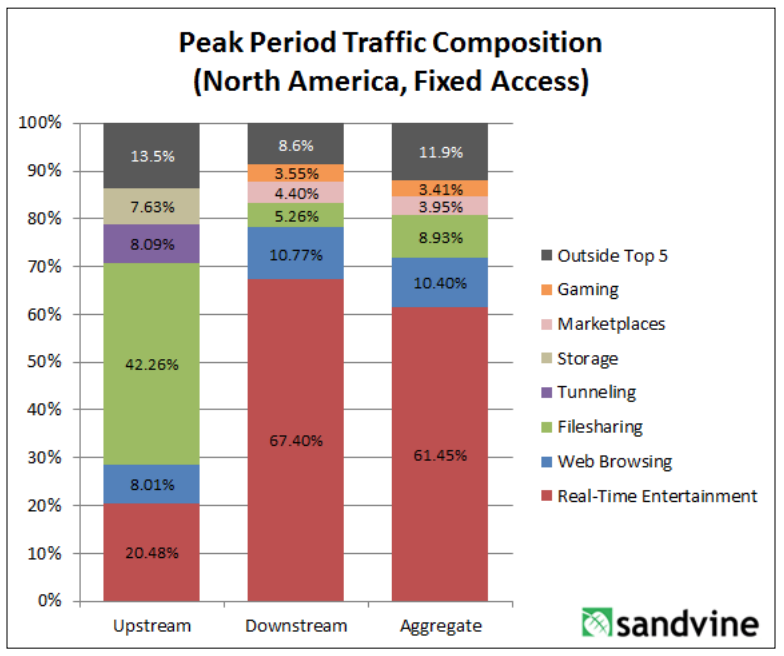
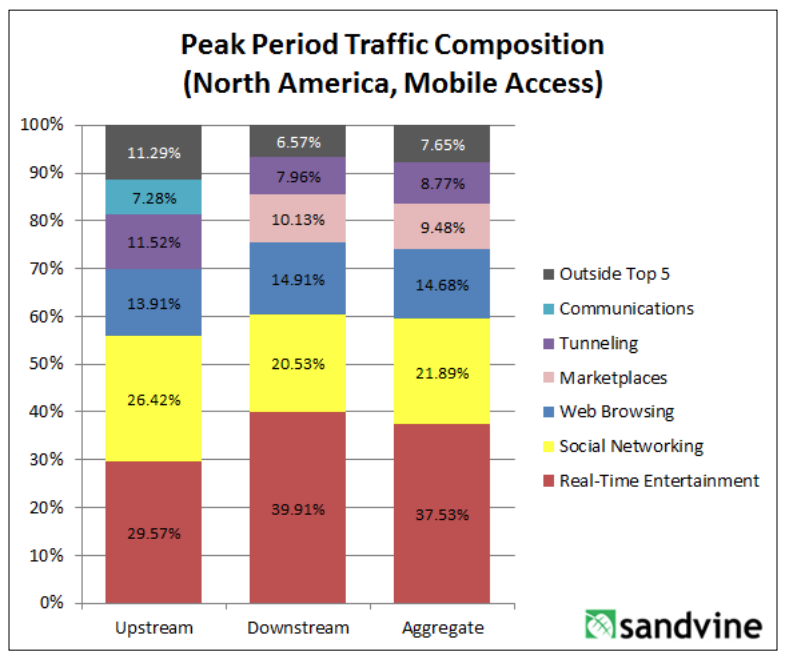
Sandvine, a Canadian network intelligence firm, tracks traffic composition. They’ve published a few reports with the current and previous year’s data, but I haven’t found anything more longitudinal. The reports describe peak period traffic composition across the following categories: real-time entertainment, marketplaces, storage, filesharing, web browsing, gaming, social networking, communications, and other. There are separate charts for mobile and fixed access.
from
“2016 Global Internet Phenomena: Latin America and North America”
from
“Global Internet Phenomena Report: 2H 2013”
CC’s Note: I’ve not been able to find a more recent version of the report. Sandvine was acquired recently, although the report author is still with the company. Could contact him to ask. Dan Deeth: ddeeth@sandvine.com
*
Comscore is tracking differences between desktop and mobile internet usage.
CC’s note: Not sure if historic data are aggregated, but here’s a sample of recent statistics (covering US, Canada, France, Germany, Italy, Spain, UK, Argentina, Brazil, Mexico, India, Indonesia and Malaysia)
Smartphones are the dominant platform in terms of total digital minutes, in every region Comscore examined.
Most pronounced in India – 89% total minutes
Least noticeable in Canada – 43% of total minutes (42% desktop, 15% tablet)
US: 60% (30% desktop, 10% tablet)
Mobile minutes are overwhelmingly spent with apps – over 80%
Top apps (everywhere, in various rankings) include:
Google Search, Whats App, Facebook, YouTube, Google Play, FB Messenger
Three largest categories where digital time is spent:
Multimedia (includes several large video streaming services), Social Networking, Instant Messengers
Looking specifically at mobile digital time, the top four categories are:
Entertainment, Social Media, Instant Messaging, and Games
On average, Social Media has the largest average share of mobile minutes, but Entertainment is larger in the US and Canada.
Among Social Media apps, Facebook, totally dominates, followed by Instagram, then Snapchat, then Twitter (Twitter’s share is tiny).
Among Messaging apps, WhatsApp totally dominates, then Facebook Messenger (less than half), then WeChat (very small share).
The report includes visualization of platform preferences for certain categories. Business/Finance (which includes banking) shows the most even split between mobile and desktop reach. In the majority of markets, retail is heavily biased toward mobile. News/Information is overwhelmingly biased toward mobile.
(shown for UK and India – both show a fairly even split between desktop and mobile for banking minutes).
The report also includes visualization of subtle seasonality in certain categories of content (shown for UK and Brazil).
src:
Comscore, 2018
“Global Digital Future in Focus”
Social Media Users
Hootsuite and We Are Social publish an annual report detailing internet use and social media growth. In their 2018 report, they list the most active social platforms (slide 59), led by Facebook (2,167B MAUs), with WeChat at #5 (980M MAUs). Because Facebook is still not used in China (not broadly), we have added the Facebook and WeChat user figures to roughly approximate the number of people using social media. At 3.147B, this comes very close to the report’s estimate of active social media users (3.196B).
src:
We Are Social/Hootsuite, Jan 2018
“2018 Global Digital”
full set of slides
I tallied historic MAU data from Facebook (Q3 2008 – Q4 2017) and WeChat (Q2 2011 – Q2 2017)
src:
Facebook via Statista, Jan 2018
“Number of monthly active Facebook users worldwide as of 4th quarter 2017 (in millions)”
src:
Tencent via Statista, Aug 2017
“Number of monthly active WeChat users from 2nd quarter 2010 to 2nd quarter 2017 (in millions)”
I calculated this tally as a percentage of global population, to be compared against the percent of global internet users (reported by the Internet Telecommunications Union).
global population src:
United Nations, Department of Economic and Social Affairs, Population Division. World Population Prospects: The 2017 Revision. (Medium-fertility variant).
via Worldometers
I used Excel to create trend lines (2deg polynomial) showing when each set (internet users and social media users) might reach 100% saturation.
The data are collected in the following Excel file:
global-internet-users-ITU-2001-2017-extrap-to-2030
And a simplified Google Drawing is here:
https://docs.google.com/drawings/d/1qbYyLORAMPYAtwZkrZxN0-VTfjUpPLoZL-SV-z-IB9E/edit?usp=sharing
Other bits of interest:
Dragon Social, Oct 2017
“10 Most Popular Social Media Sites in China”
eMarketer, June 2017
“Percent of Internet users who use a social network at least 1x/month”
2016-2021
Business Insider, Sep 2016
“Messaging apps are now bigger than social networks”
[crossing chart]
2011-2017
100% Internet Penetration
ASK: Forecasts for global 100% internet users?
FINDINGS:
eMarketer publishes a ~5-year forecast of internet penetration every year. It’s most recent publicly accessible forecast showed a downward revision from the previous year’s forecast.
As of June 2016
2014 41.1%
2015 44.3%
2016 46.8%
2017 49.0%
2018 51.1%
2019 53.0%
2020 54.6%
src: eMarketer, June 2016
Revised, as of April 2017
2016 44.6%
2017 46.8%
2018 48.8%
2019 50.6%
2020 52.2%
2021 53.6%
This is the only significant forecast I’ve found for this indicator.
*
The International Telecommunications Union tracks internet users as a percentage of the global population. Historic data is available back to the mid 1990s.
I’ve added a trendline projection, which suggests ~2030 as a possible saturation date.
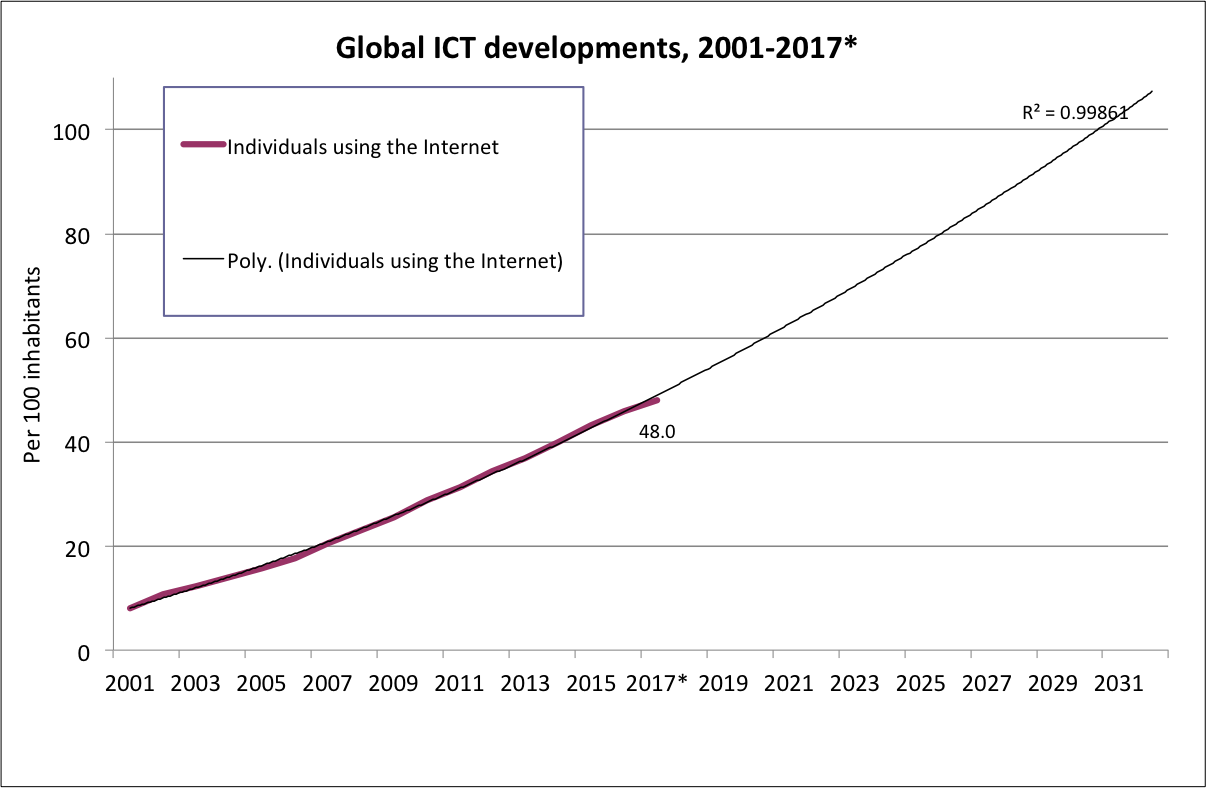
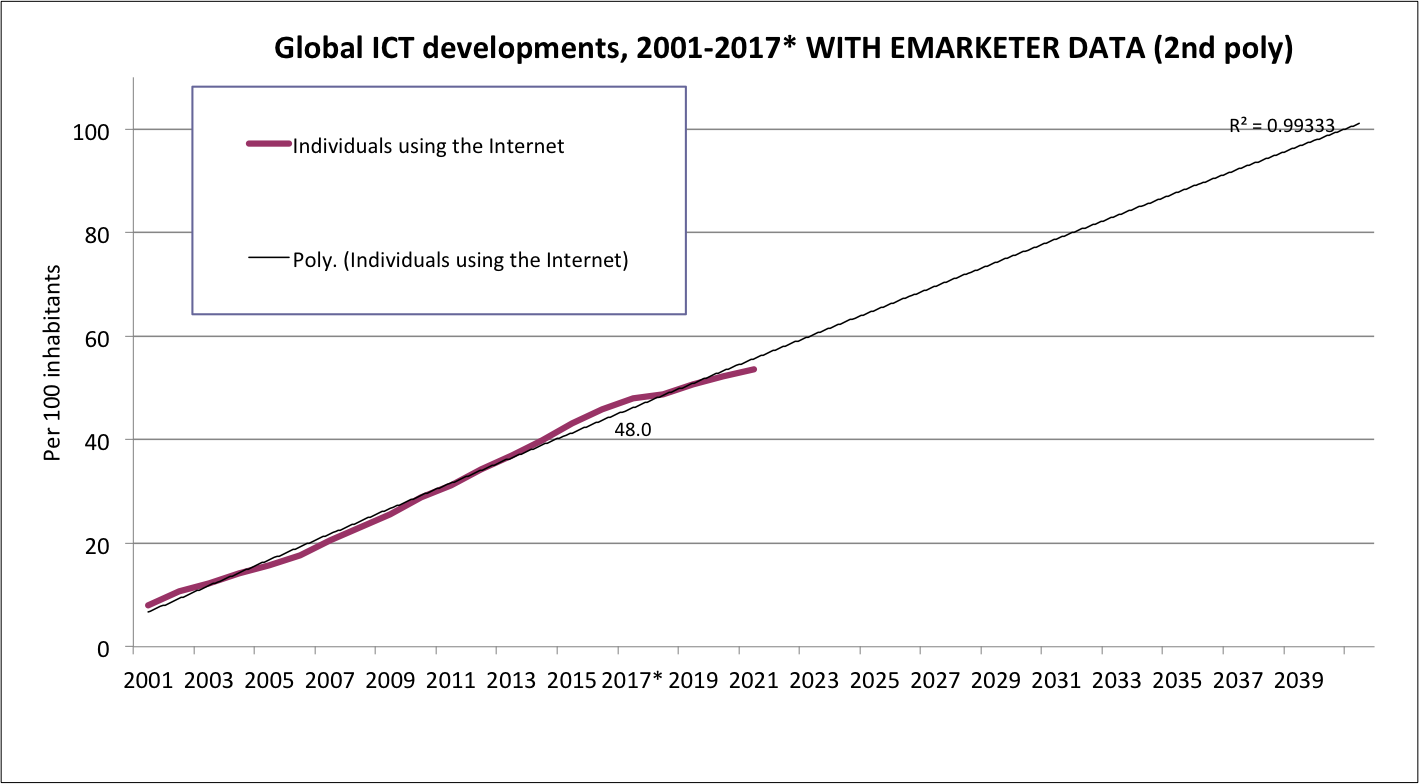
However, when eMarketer’s most recent forecast figures are added, the trendline wiggles. The same type of trendline (2nd order polynomial) then delays saturation until 2040.
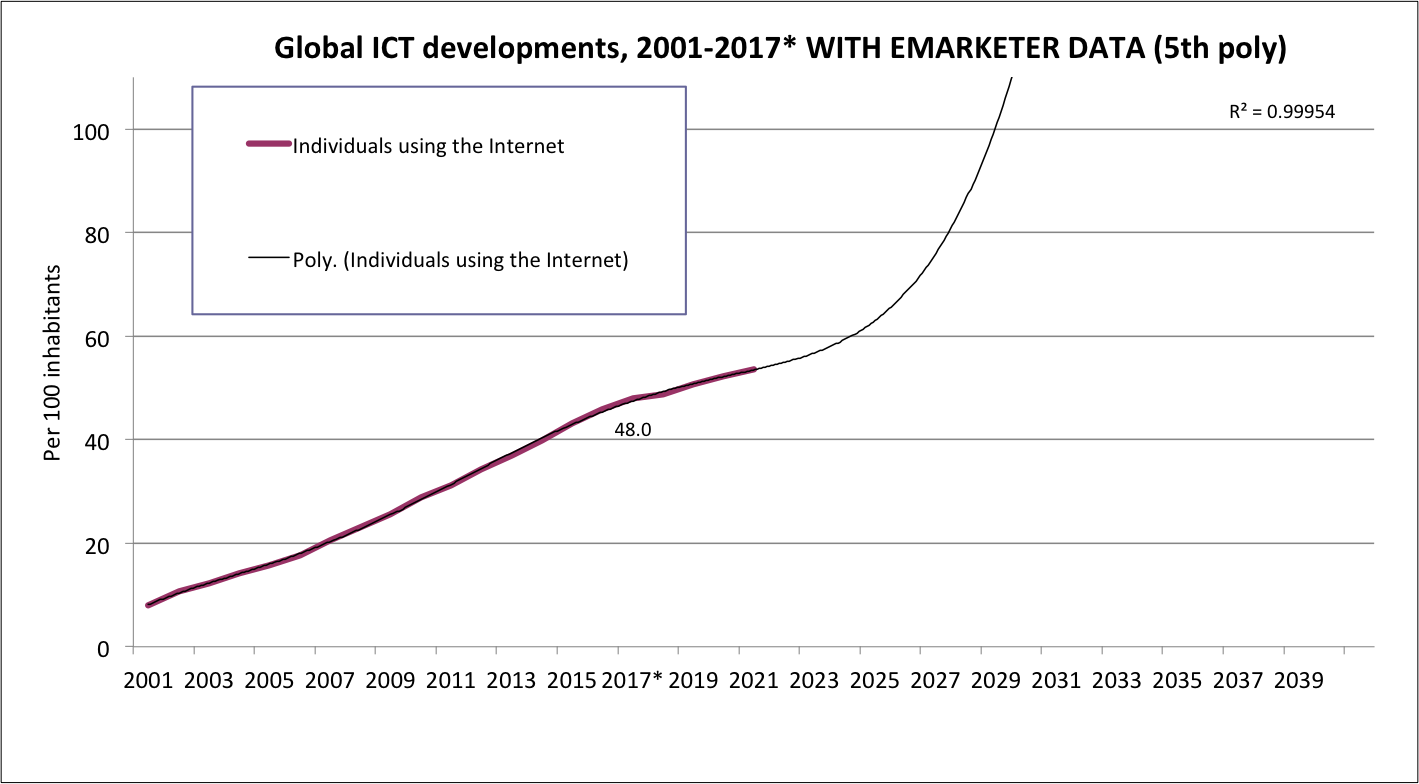
Adjusting the trendline type (to a 5th order polynomial) gives a better R-squared value, and again brings saturation back to ~2030.
[Black and yellow simplified chart here]
src:
International Telecommunications Union, 2017
“Global ICT developments, 2001-2017*” [XLS file]
Here’s a tidy chart, showing data points, of basically the same data (1997-2017) aggregated at Wikipedia, with separate lines for global, developed world, and developing world:
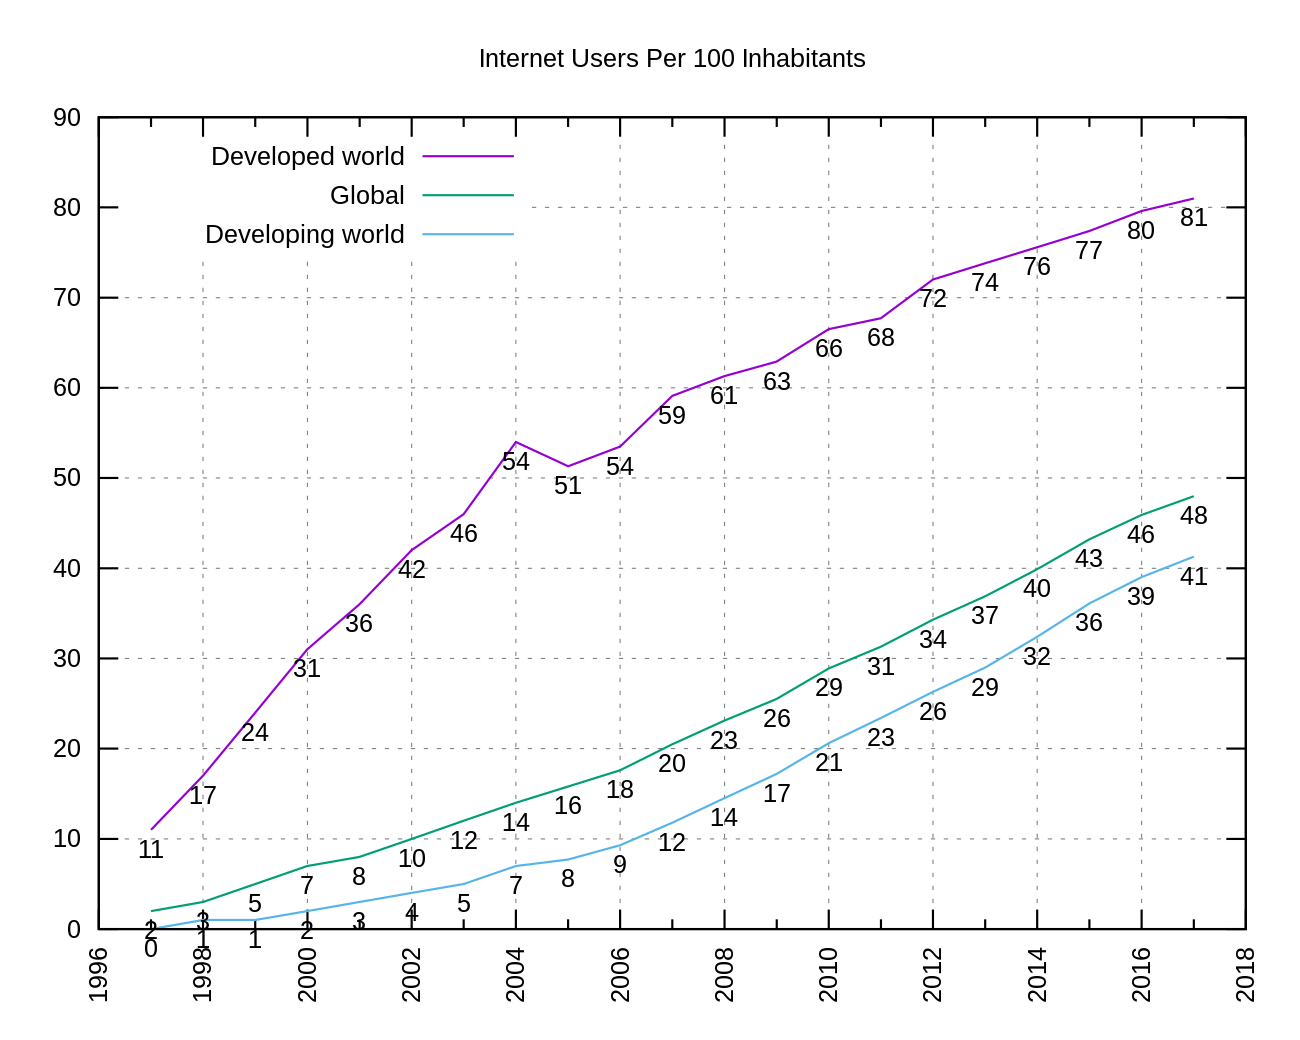
src: Wikipedia citing Internet Telecommunications Union
*
Newsweek projection of when the number of active Facebook users will equal the current (2017) population of the world (7.6B) — 2048
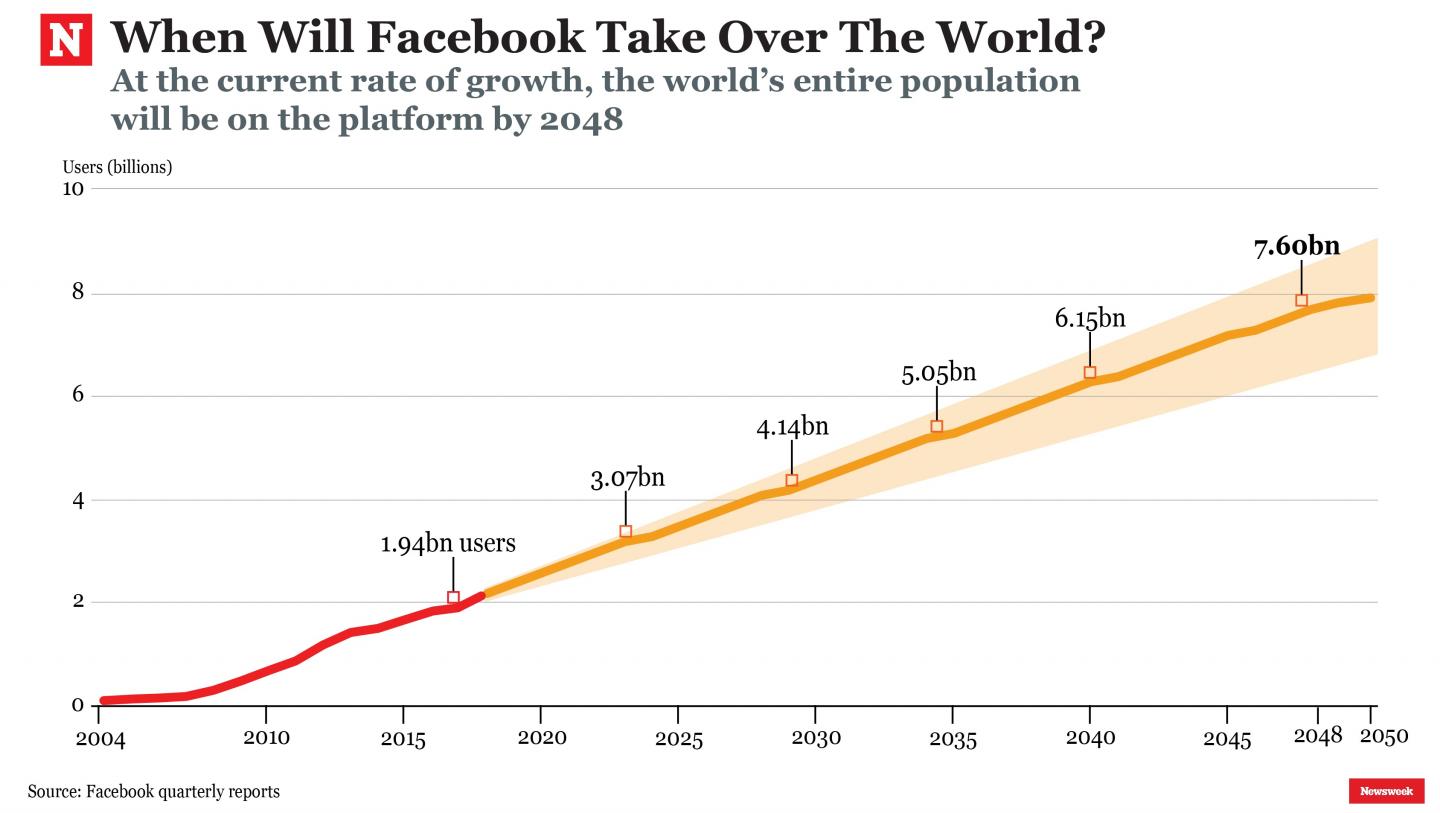
Newsweek’s fine print: The forecast has been calculated only using the annual figures provided by Facebook’s reports since 2004, and does not take into consideration technological progress or demographic changes.
CC’s NOTE: In 2048, the UN medium fertility variant projection for world population is 9.7 billion. At 7.6 billion users, that would be about 78% of the projected 2048 population. That would be a big jump from the 26% of global population FB users accounted for in 2017, but still not literally everyone.
src:
Newsweek, May 2017
“How Long Until Facebook Takes Over The World?”
Internet Connectivity and Infrastructure
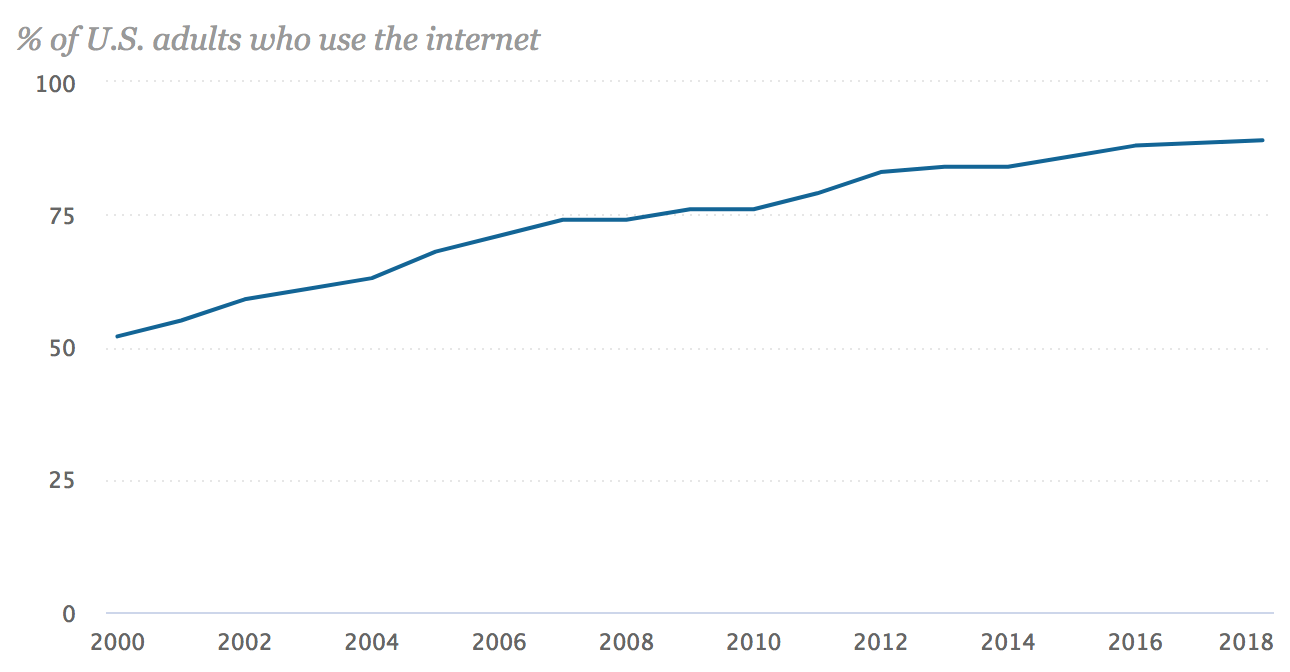
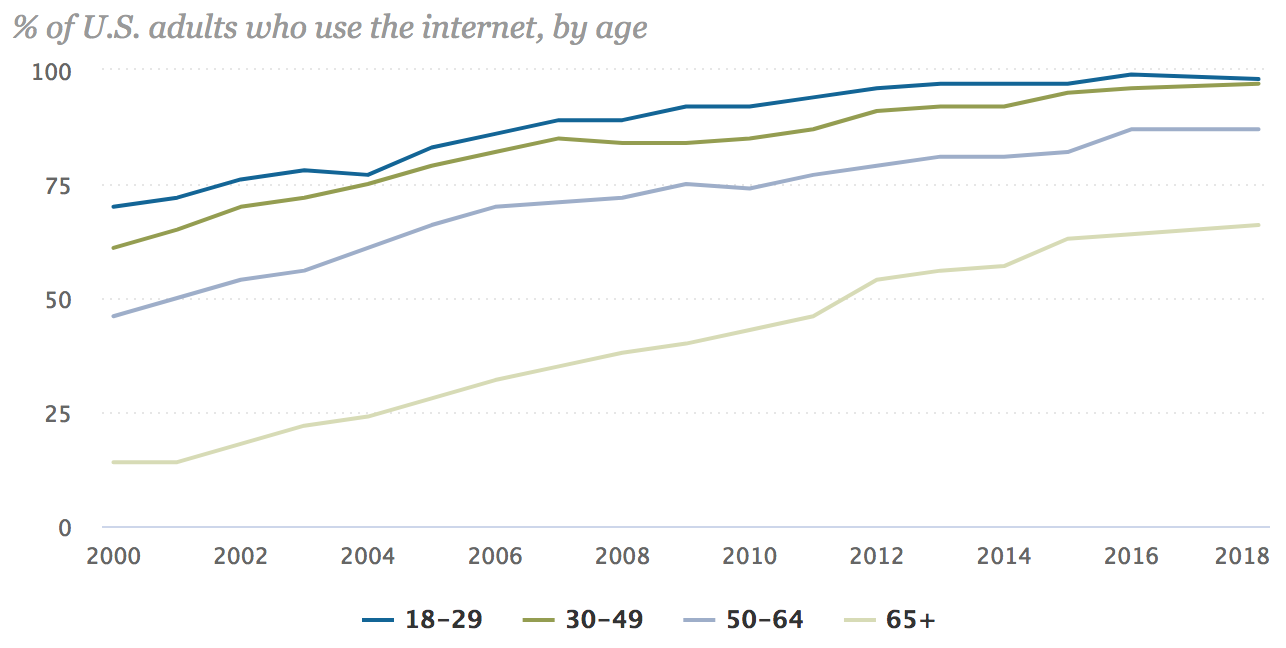
Pew Internet/Broadband Fact Sheet


src:
Pew Research Center, Feb 2018
“Pew Internet/Broadband Fact Sheet”
*
FCC Fixed Broadband Deployment Map


See the source link for an interactive version of the map.
src:
FCC Fixed Broadband Deployment
Accessed April 2018
Note: Discussion of the FCC map and it’s latest version is available here. The latest map is based on 2016 data. FCC does not have an equivalent map for mobile broadband, although it does publish an annual report on mobile wireless competition.
*
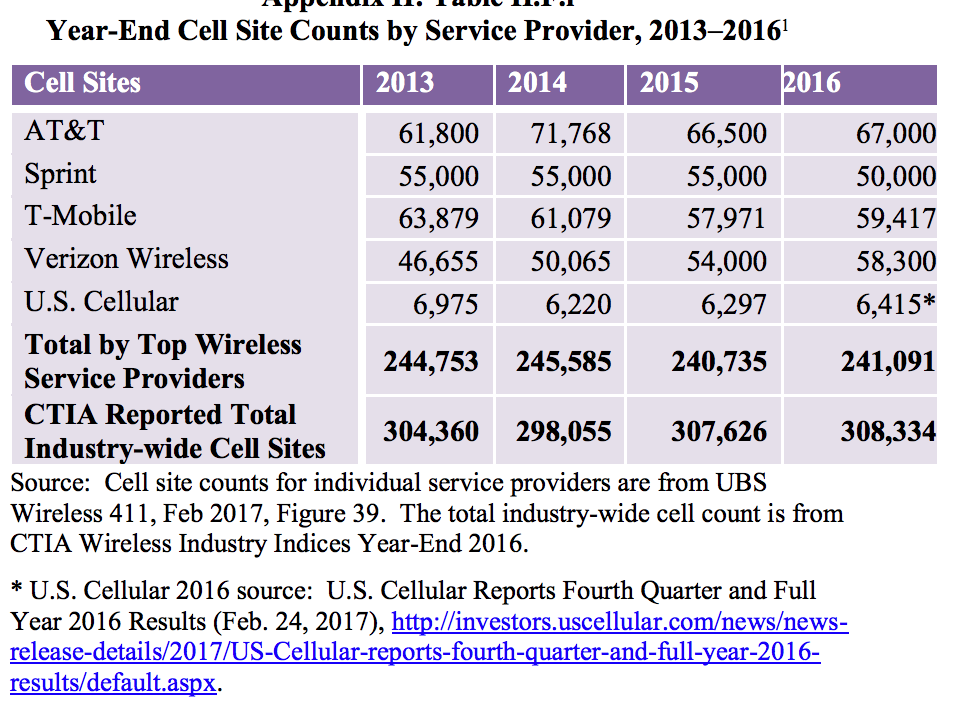
20th Mobile Wireless Competition Report Quick Facts


src:
FCC, September 2017
20th Mobile Wireless Competition Report Quick Facts
A couple more interesting bits from the full report…
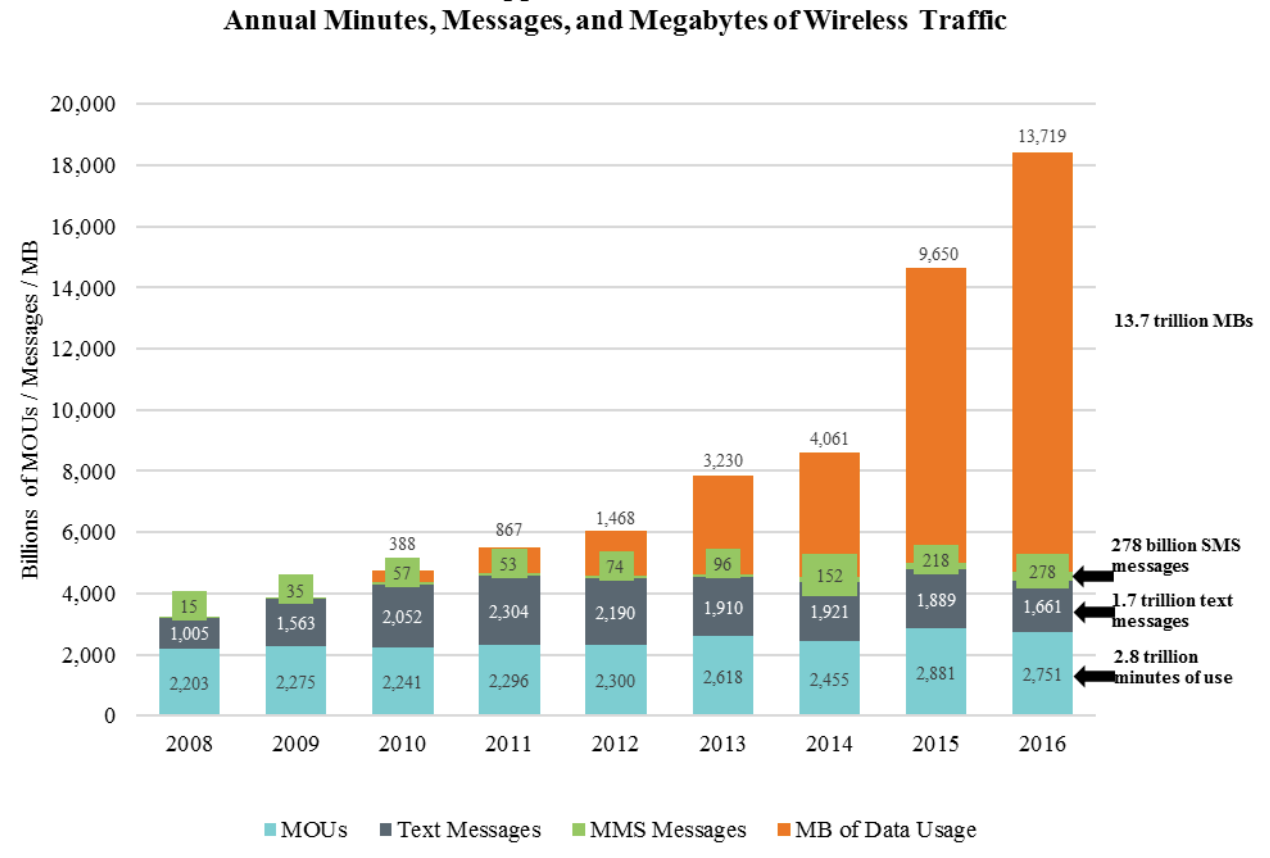
NOTE: MOU = minutes of voice use
[p.72]

Note: A “connection” is a paid subscription, equivalent to the number of ‘lines’ when discussing landline phone service.
[p.73]
[p.74]
Note: According to CTIA, there has been an approximate 57 percent growth in the number of cell sites over the last ten years (in 1986, there were 1,531 cell sites in service).
The report notes that, according to CTIA, the number of cell sites will significantly increase as the mobile wireless industry densifies and prepares for 5G. Also, because multiple cell sites can be co-located in the same “tower” site, the reported cell sites should not be equated with “towers.” The reported cell sites include repeaters
and other cell-extending devices (e.g., femtocells or distributed antenna systems).
A specialized communications tower industry has developed to provide and manage the
support structures for the cell sites. Today, there are more than 120 tower and DAS operators in the United States, and a majority of towers are now owned or operated by independent companies rather than by mobile wireless service providers.142 Independent tower operators own, operate and lease shared wireless communications and broadcasting towers, manage other tall structure sites (such as rooftops and water towers), and to a lesser extent, own and operate neutral facilities to host small cells and DAS networks for mobile service providers. [p.32]
src:
FCC, Sep 2017
“Implementation of Section 6002(b) of the Omnibus Budget Reconciliation Act of 1993, Annual Report and Analysis of Competitive Market Conditions with Respect to Mobile Wireless, Including Commercial Mobile Services”
*
[In the U.S.] Expected arrival time-frame for 5G roll out with decent coverage and availability in handsets:
early 2020s
(Although 2019 phones will be advertising capacity, even if there’s no network to connect to right away.)
“I believe that eventually consumers will pay for just one broadband connection, fixed and mobile. When I say 50M or more homes, I mean wireless substitution. I think you can draw a parallel with local telephone service and long distance. The long distance business evaporated. Similarly, today’s fixed and mobile broadband services will collapse into one. The cellular operators today are better positioned to take that market.” Peter Rysavy (wireless technologies consultant)
src:
Forbes, Sep 2017
“The Dawn Of 5G: Will Wireless Kill the Broadband Star?”
Ericsson (Nov 2017) has the same prediction for 5G, anticipating coverage for more than 20% of the global population (1 billion) by the end of 2023. First deployments are expected in 2019.
*
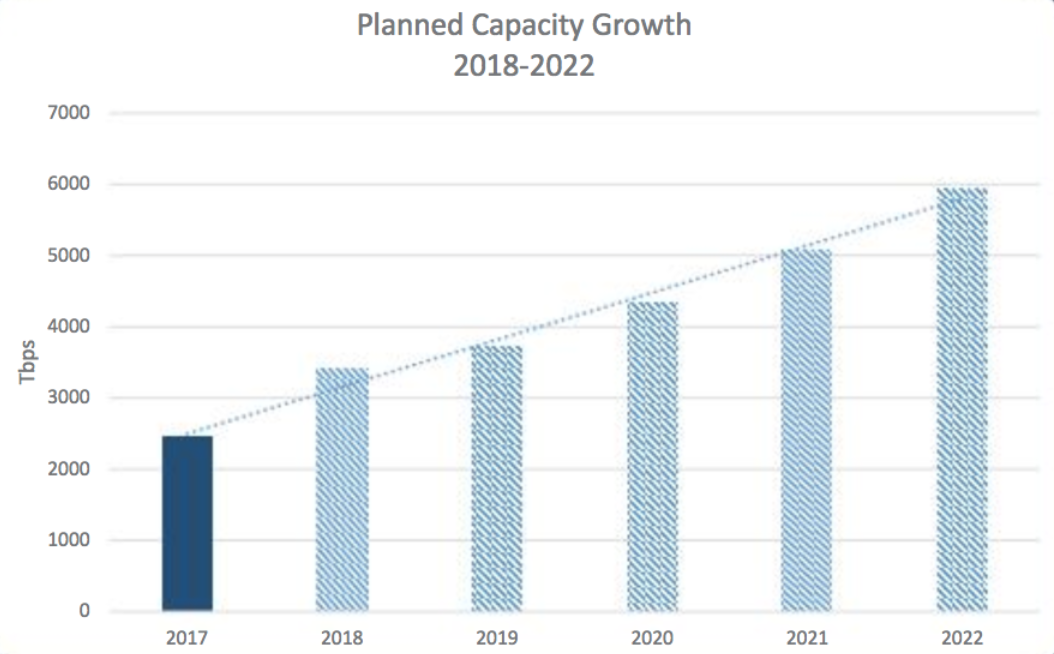
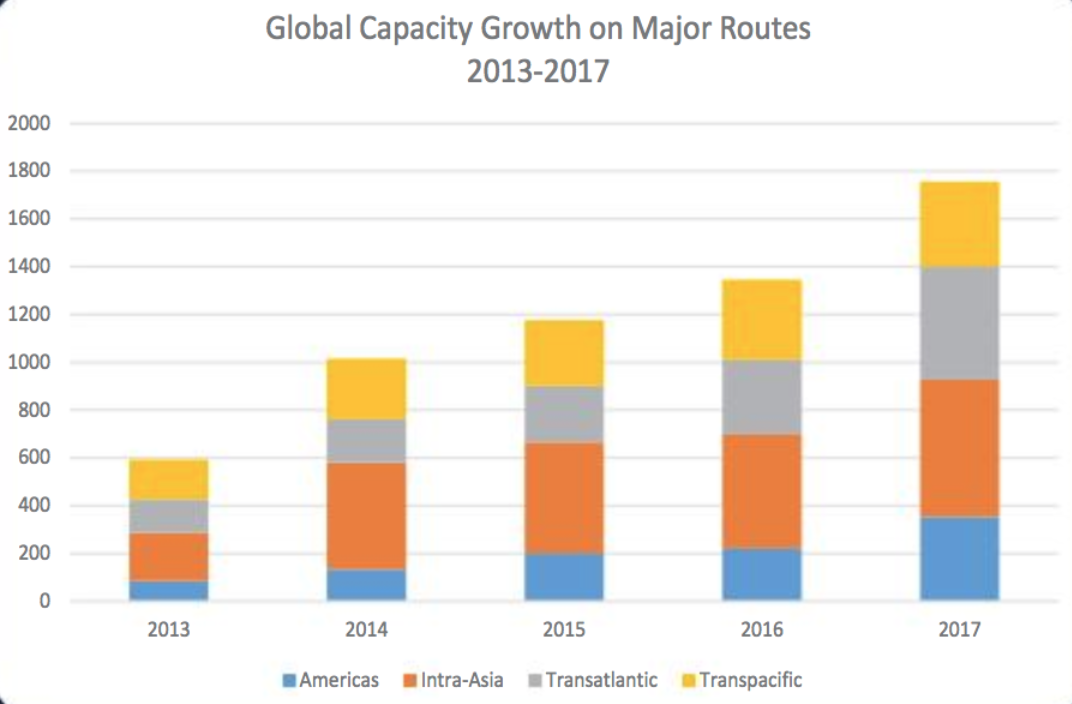
Submarine Cable Capacity

src:
Submarine Telecoms Industry Report 2017
[p.17]
*
Network World, Mar 2018
“Submarine cable boom fueled by new tech, soaring demand”
Excerpts:
Between 2013 and 2017, the subsea cable industry has added an average of 32 percent of capacity annually on major submarine cable routes.
SubTel Forum projects global submarine cable capacity will increase up to 143 percent between 2017 to 2022, and it also notes that a construction boom is already underway. Last year, 62,000 miles of submarine cable was added globally. This, after global averages didn’t crack 19,000 miles of added cable between 2013 to 2016.
According to TeleGeography, the international capacity deployed by companies such as Google, Facebook, Microsoft, and Amazon rose 14-fold between 2012 to 2016. … By investing in them, these mega-companies get them built faster. They also get a level of control over construction, maintenance and operation that’s ultimately more economical than becoming a paying customer on a telecom’s cable.
[It’s now cheaper to build systems with greater bandwidth. In 2013, new systems averaged 9 terabits per second (Tbps) — multiple systems planned for 2018 and 2019 will have capacities of 60 Tbsp. Tech advances are also eliminating costly and complex infrastructure layers, such as regen equipment. In addition, new cables can land directly inside multi-tenant data centers, rather than a traditional cable landing station (CLS) on the beach.]
*
Telegeography, Nov 2017
“A Complete List of Content Providers’ Submarine Cable Holdings”
This article lists cables owned or strongly supported by Amazon, Facebook, Google, and Microsoft.
Excerpt:
The amount of capacity deployed by content providers has outpaced all other customers of international bandwidth in recent years. Between 2012 and 2016 the amount of international capacity deployed by companies like Google, Facebook, Microsoft, and Amazon has risen 13-fold to 179 Tbps. (In contrast, international capacity deployed by all other operators only rose threefold, to 272 Tbps).
Content providers prioritize some submarine cable routes more than others in their network deployments. Between 2012 and 2016, content provider demand was the strongest across the Atlantic where capacity rose at a compound annual rate of 66 percent to 42 Tbps.
And as such, the largest content providers have built U.S.-centric network architectures. Their investments on systems directly connecting Europe to Asia are almost non-existent, in comparison. In the Atlantic and Pacific, content providers accounted for over half of total demand in 2016. In contrast, content providers represented only a small share of capacity usage on routes connected to the Middle East and Africa.
Used International Bandwidth by Source, 2002-2016

*
Submarine Telecoms Industry Report 2017
Excerpts:
Submarine fiber systems ownership
2013-2017: 61% private, 39% consortium
2018 and beyond: 83% private, 17% consortium
A recent trend towards private ownership has been observed compared to historical trends of primarily consortia ownership. Business cases for smaller systems have been prevalent, and the demand driving these systems has differed from years past. Globe-spanning infrastructure cables that require consortium ownership have fallen out of favor, contributing to this trend shift.
The boom of private ownership will continue to extend well into the future, as more niche and point-to-point systems are implemented. Much of this is driven by intra-regional needs — typically for smaller nations looking to get connected. However, a growing number of systems are being driven by factors not previously seen in the submarine fiber industry.
[p.22]
*
Norway Telecom Trends
The Norwegian Communications Authority prepares a twice annual report of statistics showing developments in electronic communications services, including fixed telephony, mobile telephony and services, broadband and TV transmissions.
See especially Chapter 2, Development Trends, stating on page 11
src:
Norwegian Communications Authority, May 2016
“The Norwegian Electronic Communications Service Market 2015”
Media
Summary
This collection of data includes the following indicators, dates, and sources:
GLOBAL
ownership vs. access ($ millions), 2009-2019, McKinsey
total media consumption CAGR, 2010-2015, Zenith
total media consumption min/day, 2010/2015-2018, Zenith
total internet consump min/day, 2015/2018, Zenith
mobile internet consump min/day, 2016, Zenith
all other (besides mobile internet) media consump % change, 2016, Zenith
desktop internet consump min/day, 2010/2014/2016, Zenith
traditional cinema consump % change, 2016, Zenith
traditional outdoor consump % change, 2016, Zenith
traditional television consump min/day, % of consump, % change, 2015/2016/2018, Zenith
traditional radio consump % change, 2016, Zenith
Traditional newspapers consump, % change, 2016, Zenith
traditional magazines consump % change, 2016, Zenith
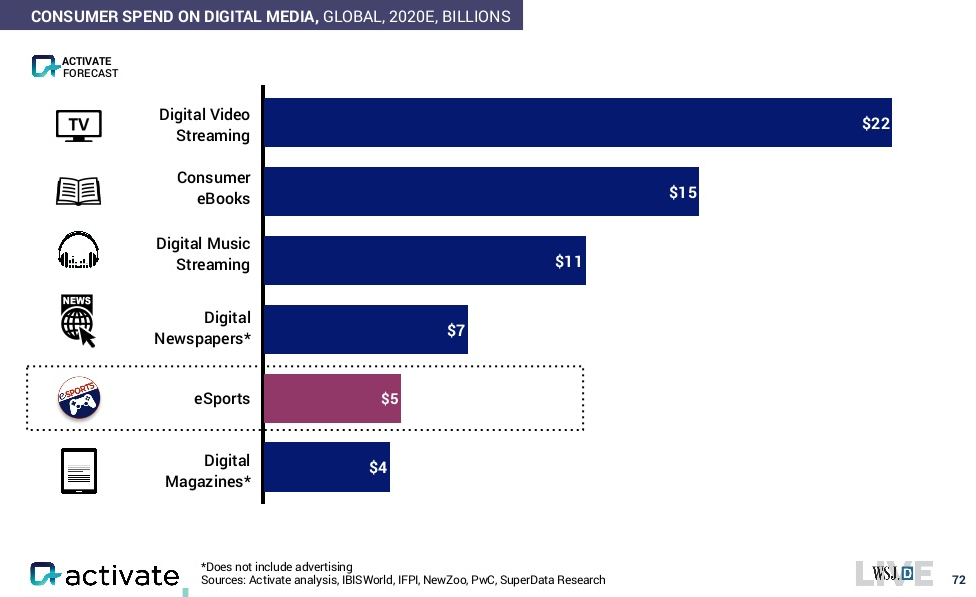
consumer spending, billions, 2020, Activate
digital video streaming
consumer ebooks
digital music streaming
digital newspapers
esports
digital magazines
UNITED STATES PER ADULT
all digital media time/day, 2012-2018, eMarketer
all mobile (nonvoice) media time/day, 2012-2018, eMarketer
mobile radio time/day, 2012-2018, eMarketer
mobile social networks time/day, 2012-2018, eMarketer
mobile video time/day, 2012-2018, eMarketer
mobile other media time/day, 2012-2018, eMarketer
all desk/lap-top media time/day, 2012-2018, eMarketer
desk/lap-top video time/day, 2012-2018, eMarketer
desk/lap-top social media time/day, 2012-2018, eMarketer
desk/lap-top radio time/day, 2012-2018, eMarketer
desk/lap-top other media time/day, 2012-2018, eMarketer
other connected devices time/day, 2012-2018, eMarketer
non-digital TV time/day, 2012-2018, eMarketer
non-digital radio time/day, 2012-2018, eMarketer
non-digital print media time/day, 2012-2018, eMarketer
non-digital newspapers time/day, 2012-2018, eMarketer
non-digital other media time/day, 2012-2018, eMarketer
all digital and non-digital media total time/day, 2012-2018, eMarketer
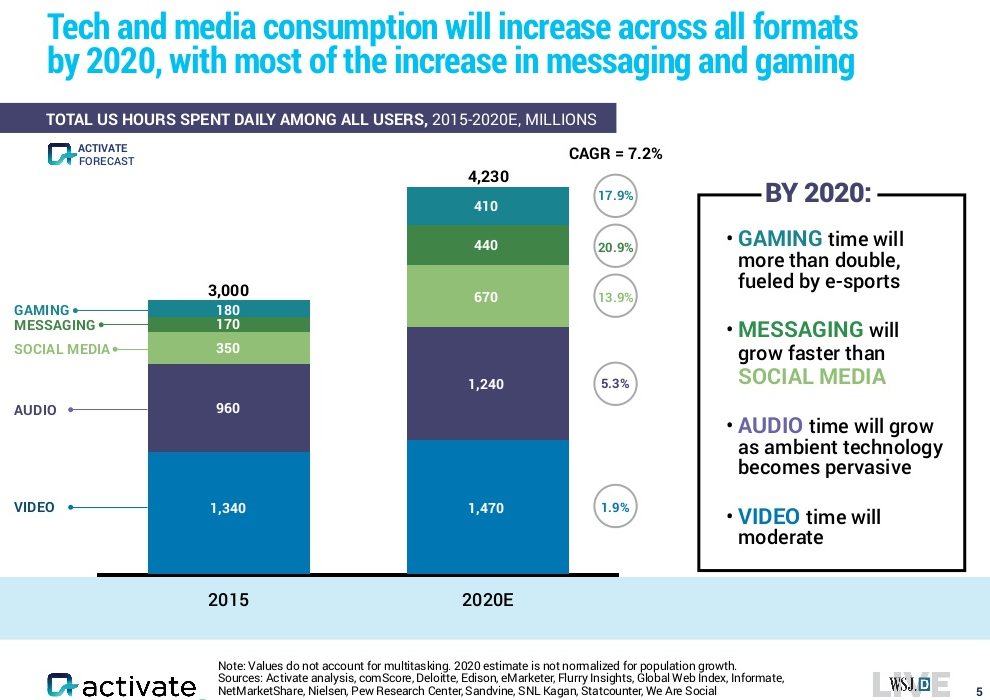
UNITED STATES, TOTAL AMONG ALL USERS
gaming hours/day and CAGR, 2015/2020, Activate
messaging hours/day and CAGR, 2015/2020, Activate
social media hours/day and CAGR, 2015/2020, Activate
audio hours/day and CAGR, 2015/2020, Activate
video hours/day and CAGR, 2015/2020, Activate
UNITED STATES
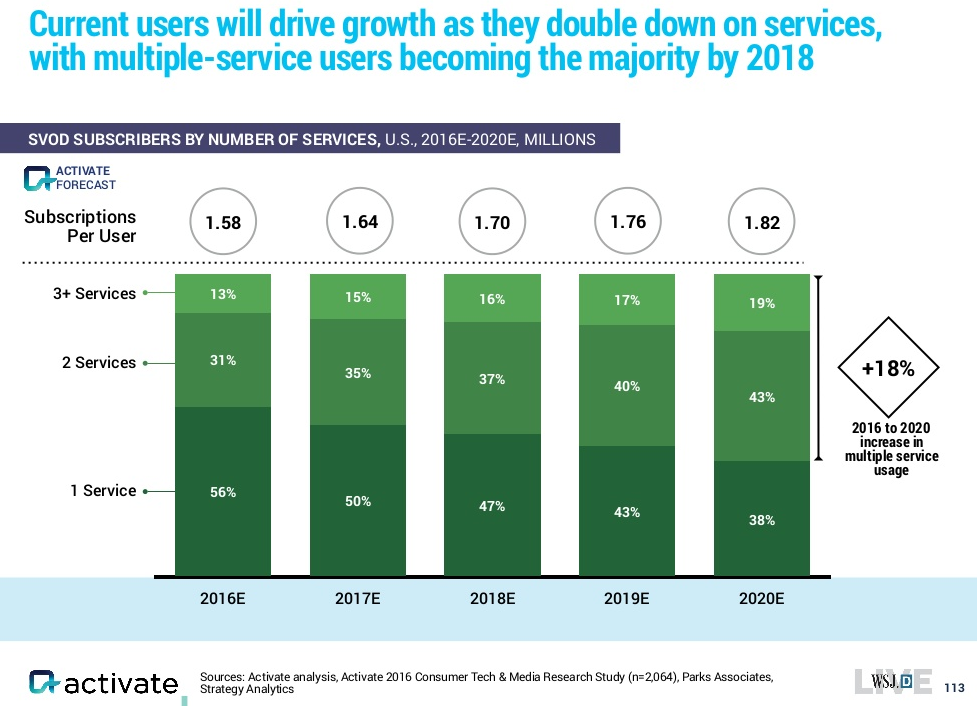
subscription video on demand, subscribers by number of services, 2016-2020, Activate
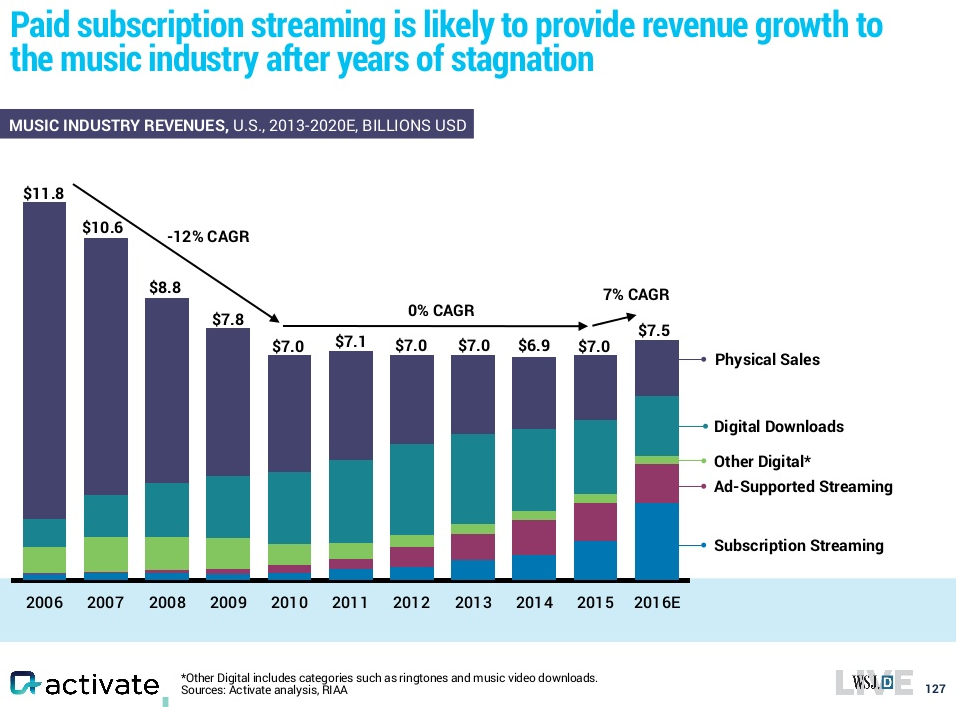
music revenues by sale type, $ and CAGR, 2006-2016, Activate
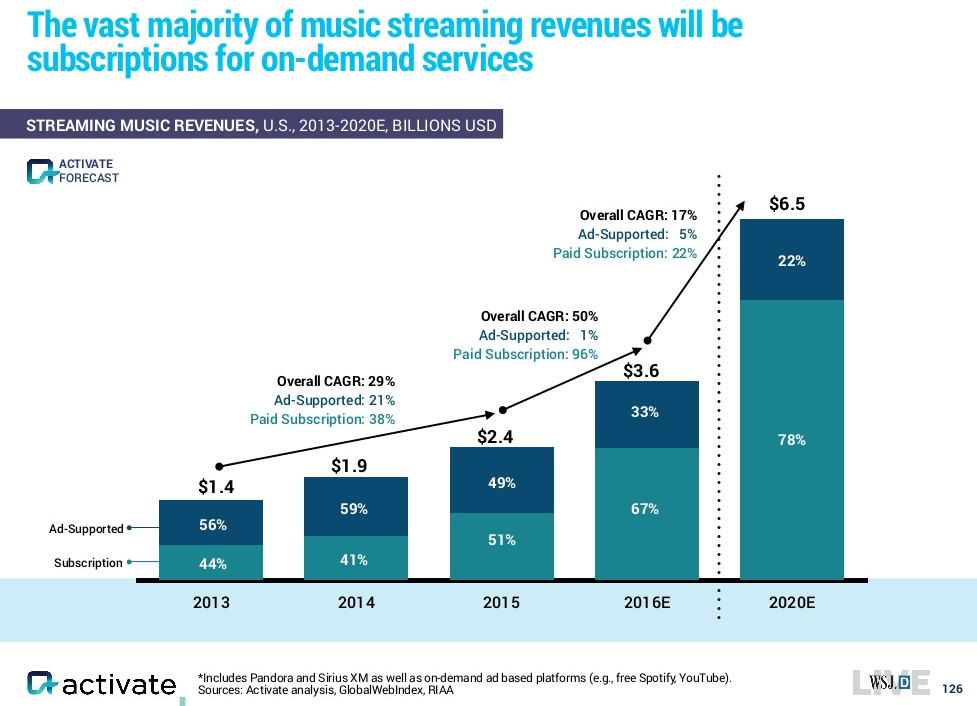
music streaming revenue, ads vs. paid subscriptions, 2013-2020, Activate
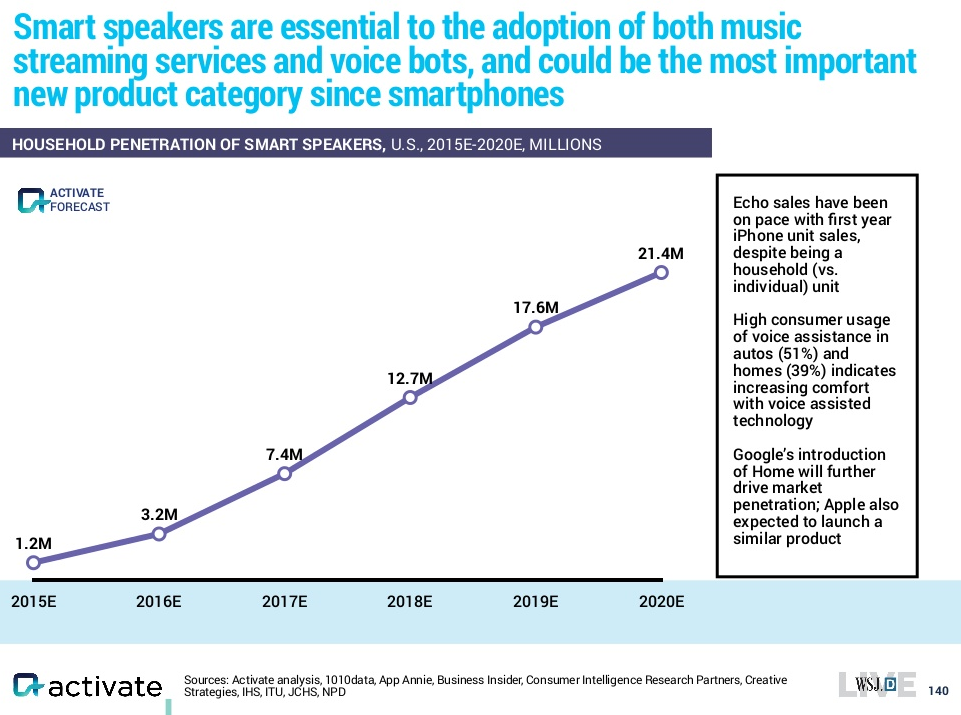
smart speakers household penetration, millions, 2015-2020, Activate
aggregate media spending CAGR, 2016-2020, Activate
internet advertising
internet access
out-of-home advertising
video games
music
tv advertising
business-to-business
book publishing
radio
cinema
tv & video
magazine publishing
newspaper publishing
internet users % of population, 2000-2014, ITU
broadband subscriptions, 2000-2015, ITU
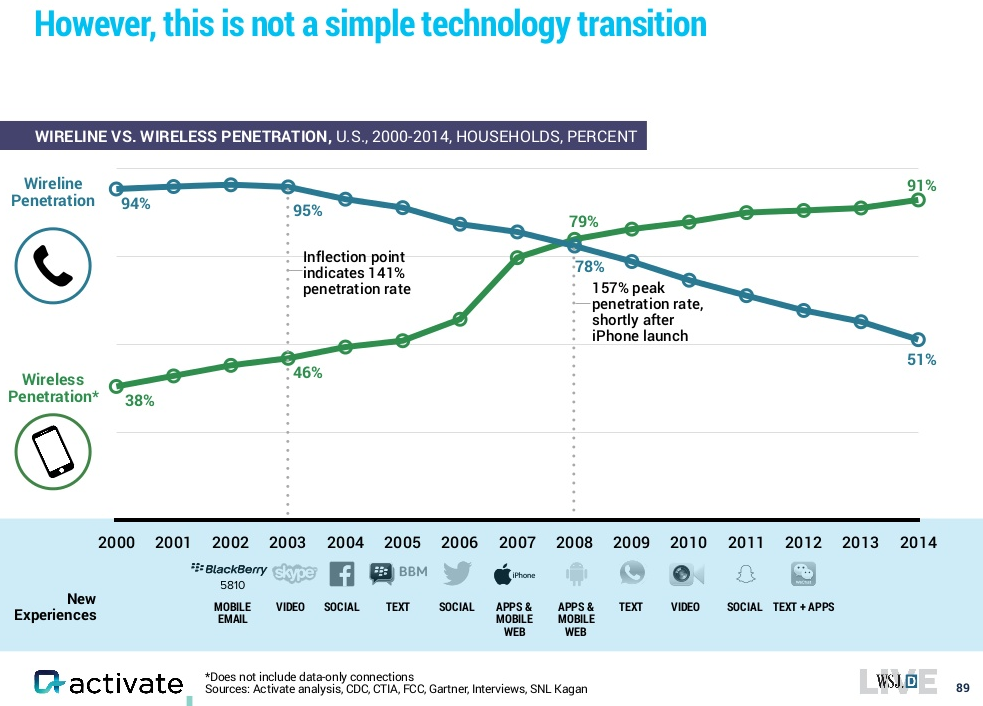
wired-line vs. wireless users, 2000-2014, Activate
In addition to these data sets, I’ve also noted a large set of VR predictions by Jesse Schell.
Findings
General Media Consumption
McKinsey publishes an annual global media spending/revenues report examining the last five years of historic data and forecasting trends for the next five years. The most recent report includes the following ownership vs. access chart:
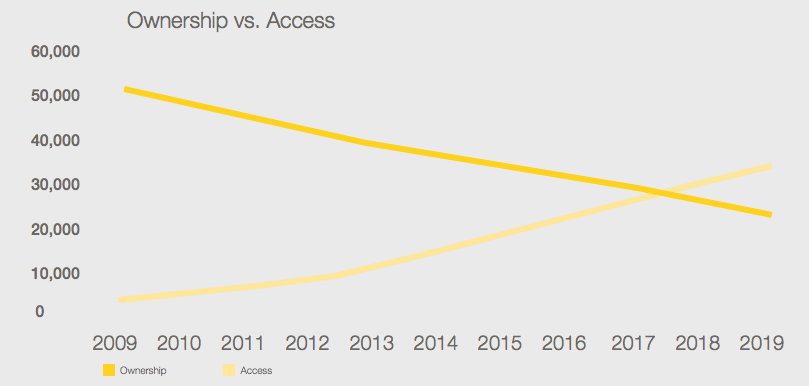
Note: Ownership consists of home video physical sales, physical recorded music sales and recorded music digital downloads. Access consists of OTT digital
video, recorded music digital subscriptions and recorded music ad-supported digital streaming.
Src:
McKinsey&Company. July 2016.
“Global Media Report 2015: Global Industry Overview.” P.21.
Citing:
McKinsey & Company, Wilkofsky Gruen Associates
Older McKinsey reports are available, which offer some older, historic data points. For example, the 2014-2018 Outlook includes some historic data going back to 2013.
*
Zenith (part of Publicis Media) is a marking consulting firm. It’s annual, global survey (two years running), “Media Consumption Forecasts,” estimates recent, current, and near-term media consumption patterns. The current report forecasts general media consumption trends two years out, to 2018. The report estimates time spent reading newspapers and magazines, watching television, listening to the radio, visiting the cinema, using the internet, and viewing outdoor advertising while out of the home. 71 countries are covered, and regional estimates are available (although the freely available excerpts below are global).
Excerpts:
Total media consumption
2010-2015: +7.9% (driven by internet consump), avg +1.5% per year
2010: 403 min/day
2015: 435 min/day
2016: +1.4%
2017: +1.2%
2018: 448 min/day, +0.4% (mobile consump levels off)
Total internet consumption
2015: 110 min/day
2018: 31% global media consumption
Mobile internet consumption
2016: +27.7%, 86 min/day, accounting for 71% of internet consump
Overall media consumption
2016: +1.4%
All other media consumption (besides mobile internet)
2016: -3.4%
Desktop internet consumption
2010: 36 min/day
2014: 52 min/day
2016: 36 min/day
Traditional cinema consumption
2016: -0.5%
Traditional outdoor consumption
2016: -0.8%
Traditional television consumption
[declining, but still the most popular medium]
2015: 177 min/day, 41% of media consumption
2016: -1.5%
2018: 38% of media consumption
Traditional radio consumption
2016: -2.4%
Traditional newspapers consumption
2016: -5.6%
Traditional magazines consumption
2016: -6.7%
Note: [The traditional media] figures only refer to time spent with these media in their traditional forms – with printed publications and broadcast television channels and radio stations. Much of the time that consumers spend on the internet is devoted to consuming content that has been produced by traditional publishers and broadcasters.
Src:
Zenith. June 2016.
“Media Consumption Forecasts.”
Via:
Contact:
Jonathan Barnard, Head of Forecasting, jbarnard1@publicisgroupe.net
Tim Collison, Global Communications Director, tcolliso@publicisgroupe.net
*
eMarketer has been publishing short-term forecasts of general media consumption longer than Zenith. It’s latest forecasts to 2018 show similar trends, although the total time consumed estimates are quite different.
Excerpts:
While mobile devices enable people to consume media content anywhere at any time, the numbers suggest a saturation point is near—and that increased time spent with one medium will tend to come at the expense of time spent with another, as explored in a new eMarketer report, “US Time Spent with Media: eMarketer’s Updated Estimates for Spring 2016.”
Src:
eMarketer. June 2016.
“Growth in Time Spent with Media Is Slowing.”
*
Technology strategist Michael Wolf, of Activate, recently presented a number of media forecasts at WSJDLive, The Wall Street Jounral’s global tech conference.
Here are excerpts:
Src:
Activate. October 2016.
“Tech and Media Outlook 2017.”
*
PwC produces an annual 5-year outlook for the entertainment and media industry which includes forecasts of consumer spending and advertising revenues.
Here are forecasts for US aggregate media spending for 2016-2020:

Src:
PRNewswire. June 2016.
“PwC’s Entertainment & Media Outlook Forecasts U.S. Industry Spending to Reach $720 Billion by 2020.”
citing:
PwC. June 2016.
“PwC Global Media and Entertainment Outlook: 2016-2020.”
*
PwC’s Chris Lederer, Partner, PwC’s Strategy&, Entertainment & Media practice, gave the following generalizations and examples from the latest report:
“At the highest level our annual Global entertainment and Media Outlook shows a mature media industry with slowing growth prospects.”
“The countries with large populations under 35 are faster growers than countries with larger aged populations,” Lederer observes.
More specifically, PwC’s analysis found that “on average, E&M spending in the 10 youngest markets is growing three times as rapidly as in the 10 oldest markets.”

2016 is the year when global Internet advertising revenue will surpass TV advertising

src:
Damian Radcliffe. August 2016.
“PwC’s global media outlook 2016-2020: six key trends.”
The Media Briefing.
***
Internet Users
ITU publishes an annual estimate of the percentage of internet users in each country.
United States, 2000-2014
Src:
ITU. 2016.
“Percentage of Individuals using the Internet (excel).”
[ICT Statistics]
***
Broadband Subscriptions

Src:
Andrew Meola. Jun 2016.
“All media consumption is declining – with one exception.”
Business Insider.
Citing: ITU
ITU data is here:
Src:
ITU. 2016.
“Key ICT indicators for developed and developing countries and the world (totals and penetration rates).” [XLS]
[ICT Statistics]
***
Wired-Line Vs. Wireless Users
Src:
Activate. October 2016.
“Tech and Media Outlook 2017.”
***
VR Predictions
Game Designer Jesse Schell has made a large set of 40 (mostly) falsifiable predictions for VR, looking out as far as 2025.
Src:
Jesse Schell. March 2016.
“40 VR/AR Predictions – GDC 2016”
Media
Summary
This collection of data includes the following indicators, dates, and sources:
GLOBAL
ownership vs. access ($ millions), 2009-2019, McKinsey
total media consumption CAGR, 2010-2015, Zenith
total media consumption min/day, 2010/2015-2018, Zenith
total internet consump min/day, 2015/2018, Zenith
mobile internet consump min/day, 2016, Zenith
all other (besides mobile internet) media consump % change, 2016, Zenith
desktop internet consump min/day, 2010/2014/2016, Zenith
traditional cinema consump % change, 2016, Zenith
traditional outdoor consump % change, 2016, Zenith
traditional television consump min/day, % of consump, % change, 2015/2016/2018, Zenith
traditional radio consump % change, 2016, Zenith
Traditional newspapers consump, % change, 2016, Zenith
traditional magazines consump % change, 2016, Zenith
consumer spending, billions, 2020, Activate
digital video streaming
consumer ebooks
digital music streaming
digital newspapers
esports
digital magazines
UNITED STATES PER ADULT
all digital media time/day, 2012-2018, eMarketer
all mobile (nonvoice) media time/day, 2012-2018, eMarketer
mobile radio time/day, 2012-2018, eMarketer
mobile social networks time/day, 2012-2018, eMarketer
mobile video time/day, 2012-2018, eMarketer
mobile other media time/day, 2012-2018, eMarketer
all desk/lap-top media time/day, 2012-2018, eMarketer
desk/lap-top video time/day, 2012-2018, eMarketer
desk/lap-top social media time/day, 2012-2018, eMarketer
desk/lap-top radio time/day, 2012-2018, eMarketer
desk/lap-top other media time/day, 2012-2018, eMarketer
other connected devices time/day, 2012-2018, eMarketer
non-digital TV time/day, 2012-2018, eMarketer
non-digital radio time/day, 2012-2018, eMarketer
non-digital print media time/day, 2012-2018, eMarketer
non-digital newspapers time/day, 2012-2018, eMarketer
non-digital other media time/day, 2012-2018, eMarketer
all digital and non-digital media total time/day, 2012-2018, eMarketer
UNITED STATES, TOTAL AMONG ALL USERS
gaming hours/day and CAGR, 2015/2020, Activate
messaging hours/day and CAGR, 2015/2020, Activate
social media hours/day and CAGR, 2015/2020, Activate
audio hours/day and CAGR, 2015/2020, Activate
video hours/day and CAGR, 2015/2020, Activate
UNITED STATES
subscription video on demand, subscribers by number of services, 2016-2020, Activate
music revenues by sale type, $ and CAGR, 2006-2016, Activate
music streaming revenue, ads vs. paid subscriptions, 2013-2020, Activate
smart speakers household penetration, millions, 2015-2020, Activate
aggregate media spending CAGR, 2016-2020, Activate
internet advertising
internet access
out-of-home advertising
video games
music
tv advertising
business-to-business
book publishing
radio
cinema
tv & video
magazine publishing
newspaper publishing
internet users % of population, 2000-2014, ITU
broadband subscriptions, 2000-2015, ITU
wired-line vs. wireless users, 2000-2014, Activate
In addition to these data sets, I’ve also noted a large set of VR predictions by Jesse Schell.
Findings
General Media Consumption
McKinsey publishes an annual global media spending/revenues report examining the last five years of historic data and forecasting trends for the next five years. The most recent report includes the following ownership vs. access chart:
Note: Ownership consists of home video physical sales, physical recorded music sales and recorded music digital downloads. Access consists of OTT digital
video, recorded music digital subscriptions and recorded music ad-supported digital streaming.
Src:
McKinsey&Company. July 2016.
“Global Media Report 2015: Global Industry Overview.” P.21.
Citing:
McKinsey & Company, Wilkofsky Gruen Associates
Older McKinsey reports are available, which offer some older, historic data points. For example, the 2014-2018 Outlook includes some historic data going back to 2013.
*
Zenith (part of Publicis Media) is a marking consulting firm. It’s annual, global survey (two years running), “Media Consumption Forecasts,” estimates recent, current, and near-term media consumption patterns. The current report forecasts general media consumption trends two years out, to 2018. The report estimates time spent reading newspapers and magazines, watching television, listening to the radio, visiting the cinema, using the internet, and viewing outdoor advertising while out of the home. 71 countries are covered, and regional estimates are available (although the freely available excerpts below are global).
Excerpts:
Total media consumption
2010-2015: +7.9% (driven by internet consump), avg +1.5% per year
2010: 403 min/day
2015: 435 min/day
2016: +1.4%
2017: +1.2%
2018: 448 min/day, +0.4% (mobile consump levels off)
Total internet consumption
2015: 110 min/day
2018: 31% global media consumption
Mobile internet consumption
2016: +27.7%, 86 min/day, accounting for 71% of internet consump
Overall media consumption
2016: +1.4%
All other media consumption (besides mobile internet)
2016: -3.4%
Desktop internet consumption
2010: 36 min/day
2014: 52 min/day
2016: 36 min/day
Traditional cinema consumption
2016: -0.5%
Traditional outdoor consumption
2016: -0.8%
Traditional television consumption
[declining, but still the most popular medium]
2015: 177 min/day, 41% of media consumption
2016: -1.5%
2018: 38% of media consumption
Traditional radio consumption
2016: -2.4%
Traditional newspapers consumption
2016: -5.6%
Traditional magazines consumption
2016: -6.7%
Note: [The traditional media] figures only refer to time spent with these media in their traditional forms – with printed publications and broadcast television channels and radio stations. Much of the time that consumers spend on the internet is devoted to consuming content that has been produced by traditional publishers and broadcasters.
Src:
Zenith. June 2016.
“Media Consumption Forecasts.”
Via:
Contact:
Jonathan Barnard, Head of Forecasting, jbarnard1@publicisgroupe.net
Tim Collison, Global Communications Director, tcolliso@publicisgroupe.net
*
eMarketer has been publishing short-term forecasts of general media consumption longer than Zenith. It’s latest forecasts to 2018 show similar trends, although the total time consumed estimates are quite different.
Excerpts:
While mobile devices enable people to consume media content anywhere at any time, the numbers suggest a saturation point is near—and that increased time spent with one medium will tend to come at the expense of time spent with another, as explored in a new eMarketer report, “US Time Spent with Media: eMarketer’s Updated Estimates for Spring 2016.”
Src:
eMarketer. June 2016.
“Growth in Time Spent with Media Is Slowing.”
*
Technology strategist Michael Wolf, of Activate, recently presented a number of media forecasts at WSJDLive, The Wall Street Jounral’s global tech conference.
Here are excerpts:
Src:
Activate. October 2016.
“Tech and Media Outlook 2017.”
*
PwC produces an annual 5-year outlook for the entertainment and media industry which includes forecasts of consumer spending and advertising revenues.
Here are forecasts for US aggregate media spending for 2016-2020:
Src:
PRNewswire. June 2016.
“PwC’s Entertainment & Media Outlook Forecasts U.S. Industry Spending to Reach $720 Billion by 2020.”
citing:
PwC. June 2016.
“PwC Global Media and Entertainment Outlook: 2016-2020.”
*
PwC’s Chris Lederer, Partner, PwC’s Strategy&, Entertainment & Media practice, gave the following generalizations and examples from the latest report:
“At the highest level our annual Global entertainment and Media Outlook shows a mature media industry with slowing growth prospects.”
“The countries with large populations under 35 are faster growers than countries with larger aged populations,” Lederer observes.
More specifically, PwC’s analysis found that “on average, E&M spending in the 10 youngest markets is growing three times as rapidly as in the 10 oldest markets.”
2016 is the year when global Internet advertising revenue will surpass TV advertising
src:
Damian Radcliffe. August 2016.
“PwC’s global media outlook 2016-2020: six key trends.”
The Media Briefing.
***
Internet Users
ITU publishes an annual estimate of the percentage of internet users in each country.
United States, 2000-2014
Src:
ITU. 2016.
“Percentage of Individuals using the Internet (excel).”
[ICT Statistics]
***
Broadband Subscriptions
Src:
Andrew Meola. Jun 2016.
“All media consumption is declining – with one exception.”
Business Insider.
Citing: ITU
ITU data is here:
Src:
ITU. 2016.
“Key ICT indicators for developed and developing countries and the world (totals and penetration rates).” [XLS]
[ICT Statistics]
***
Wired-Line Vs. Wireless Users
Src:
Activate. October 2016.
“Tech and Media Outlook 2017.”
***
VR Predictions
Game Designer Jesse Schell has made a large set of 40 (mostly) falsifiable predictions for VR, looking out as far as 2025.
Src:
Jesse Schell. March 2016.
“40 VR/AR Predictions – GDC 2016”
Media was originally published on Extrapolations
Homes: Space Use, Moves, Bandwidth
The following indicators describe how people use the space in their homes, how frequently they move, and how internet-connected households are.
Descriptions of the way people use the space in their homes are largely qualitative and general. Some historical surveys describe general differences in home design and space use from one historic period to another, but these surveys are not quantitative. In the early 20th century, there were a few time-use and space-use studies conducted by home economists, but I’ve not seen a single source that aggregates the data from different geographic zones, and I’m not aware of any contemporary surveys. These early 20th-century studies, which mostly focused on kitchens, informed the development of minimum standards, which continued to evolve into the middle and later part of the century. Again, I’ve found single instances of minimum standard recommendations, but no historical quantitative comparisons of how the standards have evolved. I’ve come across one 10-year and one 20-year outlook describing general changes in housing plans, which may be on-going.
Historic fixed-line broadband subscriptions are available from the UN’s International Telecommunication Union (ITU), 2000-2014. Pew surveys going back to 2000 show that home broadband adoption has plateaued between 2013 and 2015. A 2009 Technology Futures broadband forecast to 2020 also shows predicts plateauing starting from about 2015. Cisco has published a four-year forecast of broadband speeds to 2019.
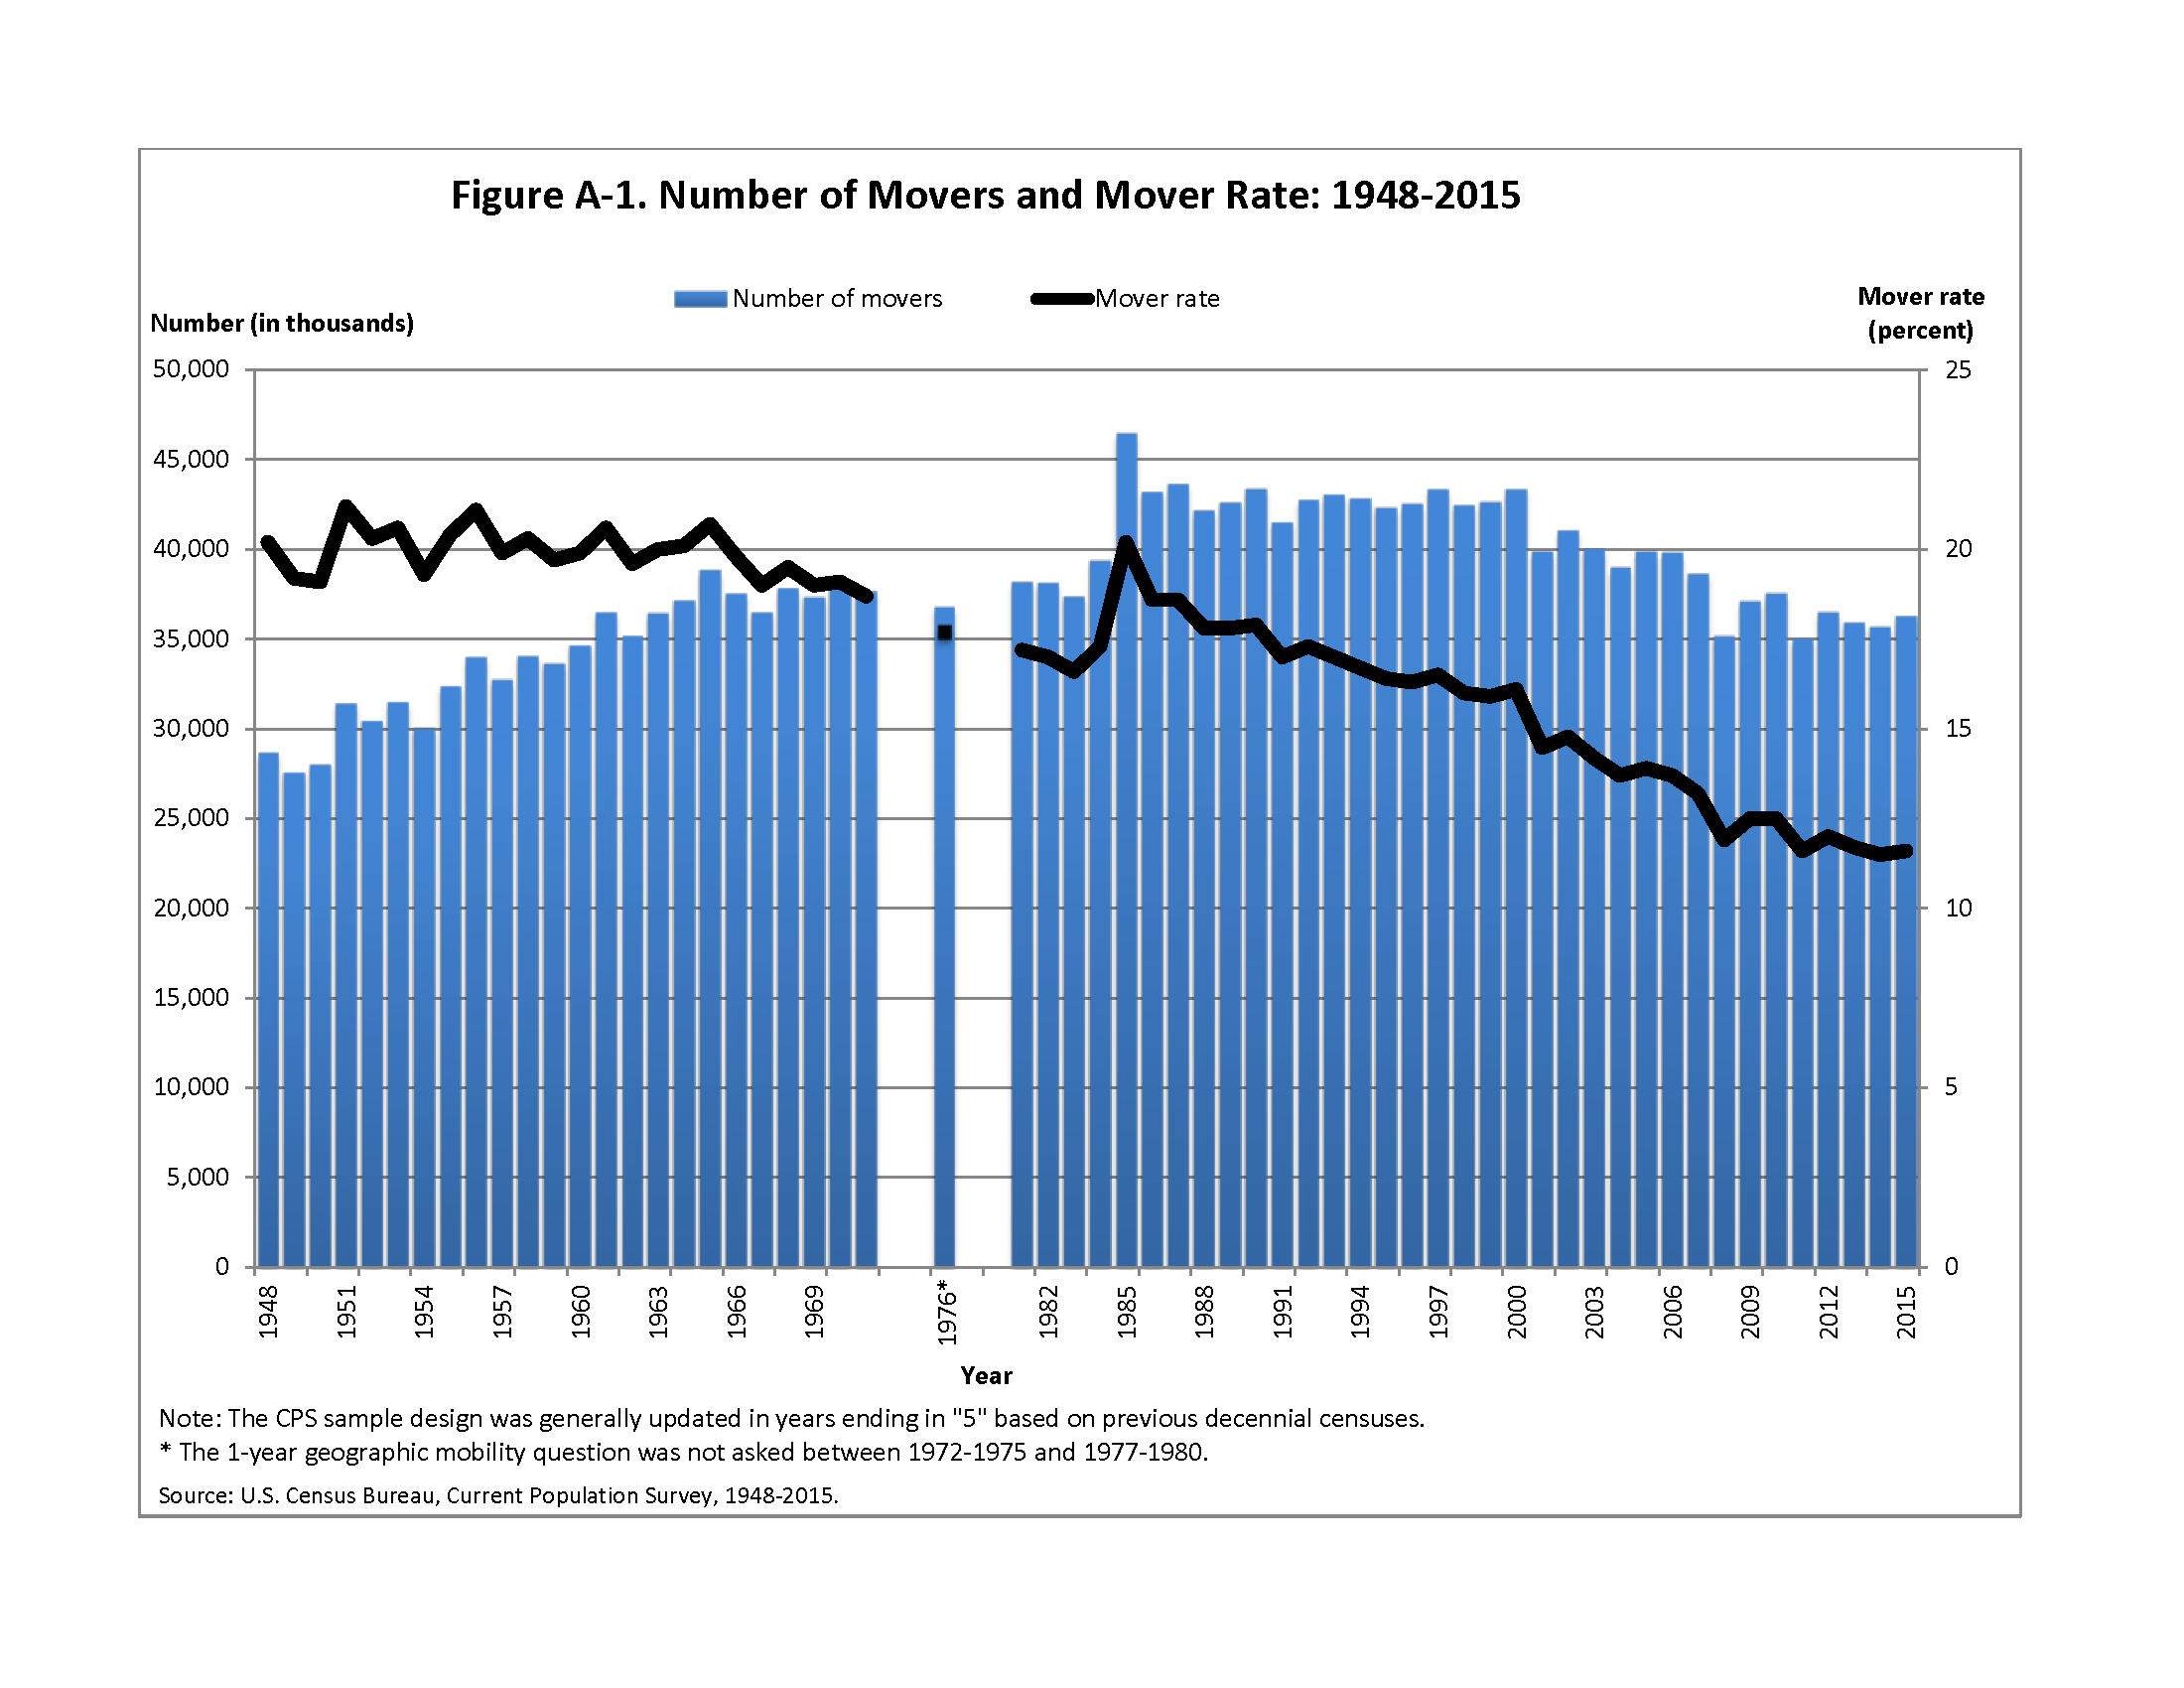
The US Census Bureau estimated the number of times a typical American will move in 2007. FiveThirtyEight updated that estimate in 2013. It may be possible to calculate this figure for previous years using older Census data. Historic estimates of the number of people moving each year are available from the Census going back to 1948.
Use of Rooms/Space
Moya K. Mason. 2009.
“Housing: Then, Now, and Future”
(date inferred via Internet Archive)
This is a general overview describing changes in the size and utilization of residential spaces, from the 18th century to present. The author has also collected excerpts from their sources here.
Ebby Halliday, REALTORS. 2009.
“Residential Housing 2030 and Beyond”
This is an outline of a focus group conversation among 25-to-40-year-olds discussing their present housing needs, and anticipated needs in the next 20 years. Very rough notes. Appears to be a consensus for smaller square footage of homes with larger, multi-purpose rooms, and larger back yards. This document was presented at the 2009 conference “North Texas Alternative Futures” in Irving, Texas, an on-going series sponsored by the Urban Land Institute.
“Residential: Embracing New Lifestyles”
Section in 2016 Gensler Design Forecast — Lifestyle
Gensler is a global architecture, design, and planning firm.
10-year outlook for trends in residential building. Brief, and highly qualitative. Communal housing (cohousing), with shared amenities, will become acceptable to post-college adults, single parents, and the elderly. Changes in work style and lifestyle will increase the need for part-time housing. Mixed-use developments will increasingly include housing. “Uburbs,” midway between the city and suburbs, are an emerging residential market.
TO-DO: CONTACT GENSLER TO INQUIRE IF THIS IS AN ON-GOING FORECAST, AND THE DATE OF THE OLDEST.
*
EMAILED ARTHUR C. NELSON
Professor of Urban Planning and Real Estate Development, Univ. Arizona
HE WAS INTERESTED IN THE TOPIC, BUT NOT AWARE OF ANY SOURCES
*
Other possible sources:
The American Institute of Architects
Virginia Tech College of Architecture & Urban Studies
Georgia Institute of Technology College of Architecture
Design Futures Council (DFC)
American Society of Interior Designers
contact:
David Krantz
Vice President, Research and Knowledge Management
dkrantz@asid.org
EMAILED 6/1 – REPLIED SAYING NO IMMEDIATE LEADS, BUT HE’LL LOOK INTO IT
Interior Design Society
Designer Society of America
Certified Interior Decorators
University of Illinois Small Homes Council-Building Research Council
US Minimum Property Standards
Best Interior Design Graduate Schools, Design Intelligence (DFC)
Savannah College of Art and Design
Pratt Institute
Rhode Island School of Design
EMAILED LILIANE WONG 6/2, HEAD OF THE INTERIOR ARCH DEPT
Kansas State University
New York School of Interior Design
Best Architecture Graduate Schools, Design Intelligence (DFC)
Harvard Univ
Cornell Univ
EMAILED KATHLEEN GIBSON 6/2, WHO MAINTAINS THEIR INTYPES DATABASE
SHE’S ON SABATICAL THROUGH 2017
EMAILED JAN JENNINGS 6/2, WHO FOUNDED THE INTYPES DB
SHE HAS NO SUGGESTIONS
Yale Univ
Columbia Univ
MIT
UC Berkeley
EMAILED PAUL GROTH 6/2
HE RECOMMENDS ASKING Richard Longstreth (GWU) AND URBAN LAND INST
TO-DO: FOLLOW UP WITH THESE LEADS
U. Michigan
Rice Univ.
Virginia Tech
EMAILED KATHLEEN PARROTT 6/1
Washington Univ. St. Louis
*
Interior Designer Jobs
Number of Jobs, 2014 — 58,900
Job Outlook, 2014-24 — 4% (Slower than average [which is about 7%])
Employment Change, 2014-24 — 2,200
src:
“Interior Designers.” 2014. Bureau of Labor Statistics, U.S. Department of Labor, Occupational Outlook Handbook, 2016-17 Edition.
Note: This 4% growth is a significant slowing from the BLS’s 2010 estimate of 19% job growth from 2010 to 2020 [average at the time].
Number of Jobs, 2010 — 56,500
src:
“Interior Designers.” 2012. Bureau of Labor Statistics, U.S. Department of Labor, Occupational Outlook Handbook, 2012-13 Edition. Via Internet Archive.
*
Virginia Tech conducted survey-based research in 2000 examining what people do in their kitchens, they have in them, what kind of cooks they are, and what they want from their kitchens.
I don’t think the survey has been updated, and the research summary does not contain much specific historic information, but I’ve written to the lead author to inquire about historic data and forecasts. EMAILED 6/1.
Excerpts:
What do people do in their kitchens? What types of cooks are they? What do they have in their kitchens and how do they react to the design, layout, convenience, and function of their existing kitchens? And perhaps most importantly, what does this tell us about how to plan and design the kitchens of the future?
In an effort to answer these questions, a multi-stage research project was developed. First, a content analysis of shelter, design, and kitchen magazines investigated current trends and features of kitchen design. Then a local sample of over 75 cooks was brought to the Center for Real Life Kitchen Design at Virginia Tech. These cooks were interviewed about their home kitchens and how they used them. The cooks were measured and then videotaped cooking a meal. Finally, a national telephone survey with 630 respondents gathered broad information about kitchens and cooks from around the country.
Household Characteristics
Who participated in the research project? The local and national samples were similar in their demographic make-up. In addition:
*A majority of the respondents in both samples (over 90%) were from households of fewer than four people. The most common types of households were a family or adult couple (approximately 1/3 each).
*Both samples included more females than males, within a wide variety of age and income brackets.
*Approximately 75% of each sample lived in single-family residences they owned. There was not a dominance of any particular age or size of residence.
*The national sample was equally divided among small town, rural, city and suburban residences.
Key conclusions from the study can be grouped into categories: what people do in their kitchens, who is cooking, how people cook, what people have in their kitchens, and what people want in their kitchens.
People have many small appliances (an average of 12 per household).
Some small appliances are stored on counter tops (four is typical).
src:
“Someone’s in the Kitchen… – A summary of the Findings of the Kitchen Space and Storage Research Projects.”
Kathleen Parrott, Ph.D., CKE
JoAnn Emmel, Ph.D.
Julia Beamish, Ph.D., CKE
Center for Real Life Kitchen Design
Department of Apparel, Housing, and Resource Management
Virginia Tech
Accessed June 1, 2016. This page was published in 2015, but the research was conducted in 2000, per this new release. The research informed a 2007 text book, Kitchen Planning, referenced below.
contact:
Kathleen Parrott — homes@vt.edu
*
One-off study from 1963 with household storage minimums (specific recommended minimums for closets, clothes closets, linen closets, kitchen storage, access, and general storage). Unable to find a contemporary equivalent.
src:
Rudard A. Jones. July 1963.
“Household Storage Study.”
Research Report 13-1
University Of Illinois
Small Homes Council — Building Research Council
Several other “universal design” papers and recommendations have been published throughout the 20th century (for example, DeMerchant & Beamish, 1995).
This trend toward recommended standards began in the 1930s when home economists with USDA started systematically researching and documenting the use of time and space in homes (especially kitchens) as a way of improving rural housing conditions. Results of many early USDA time-use surveys are available here.
Some home design books include discussion of recent home design trends. For example, Kitchen Planning (NKBA, 2013), includes discussion of general housing trends and consumer preferences, drawing upon recent surveys by NAHB, Better Homes and Gardens, and the American Institute of Architects. This work also includes a very general description of older kitchen and work-area research studies (like the USDA’s, mentioned above). However, the discussion focuses on the current demand, and does not give detailed attention to the pace of the change. TO-DO: IT MIGHT BE POSSIBLE TO MINE THE SURVEYS AND REPORTS REFERENCED IN NKBA 2013 FOR SPECIFIC STANDARDS FROM THE 1930S, 1950S, 1970S, 1990S, AND 2000S TO CHART THE METRIC EVOLUTION OF THE STANDARDS. THE CHAPTER DOES INCLUDE A NARRATIVE SUMMARY OF CHANGES BY DECADE FROM 1900 THROUGH THE 21ST CENTURY (MY PREVIEW TOPS OUT AFTER THE 1920S SUMMARY).
References include:
Beecher & Stowe 1869
Frederick 1913
Deane G. Carter 1932 — AES bulletin
Maud Wilson 1938 “The Willamette Valley Farm Kitchen”
Maud Wilson 1947b “Considerations in Planning Kitchen Cabients”
Heiner and McCullough 1948 “Functional Kitchen Storage”
Small Homes Council (SHC) 1949 “Cabinet Space for the Kitchen”
McCullough 1949
Heiner and Steidel 1951
Howard 1965
Kapple 1964; Wanslow 1965
Jones and Kapple 1975
Yust and Olsen 1992 “Residential Kitchens: Planning Principles for the ‘90s”
Cheever 1992 “Utensil Survey Project”
NOTE: THIS WORK FOUND THAT THE NUMBER OF ITEMS STORED IN THE KITCHEN HAD INCREASED 110% FROM THE NUMBER REPORTED IN 1948 (BY HEINER AND MCCULLOUGH).
Emmel, Beamish and Parrott 2001 “Someone’s in the Kitchen”
NAHB 2011
“New Homes in 2015 Will be Smaller, Greener and More Casual.”
Sullivan 2010
“Home Sizes Continue to Shrink.”
Better Homes and Gardens survey
Baker 2010
“Small Talk: Kitchens and Baths Do More With Less”
search for ref to AIA survey
Frequency of Moves
How many times will a typical American move in their life?
2007 – 11.7
2013 – 11.3
US Census Bureau doesn’t ask directly, but it calculates this figure based on which age groups are most likely to move in a given year and the overall composition of the US population.
src:
Mona Chalabi. January 29, 2015.
“How Many Times Does The Average Person Move?”
FiveThirtyEight
TO-DO: FIND/COMPUTE THIS FIGURE USING CENSUS DATA FOR PREVIOUS YEARS.
The Census Bureau describes their methodology here.
The move data comes from the American Community Survey, questions about “State-to-State Migration Flows.”
Tables are available from 2005 through 2014 at the American Factfinder portal.
Data is also available from the decennial censuses going back to 1940, links below.
1980 (page 85+)
*
Note: Slightly different from 2007 and 2013 values suggested above
src:
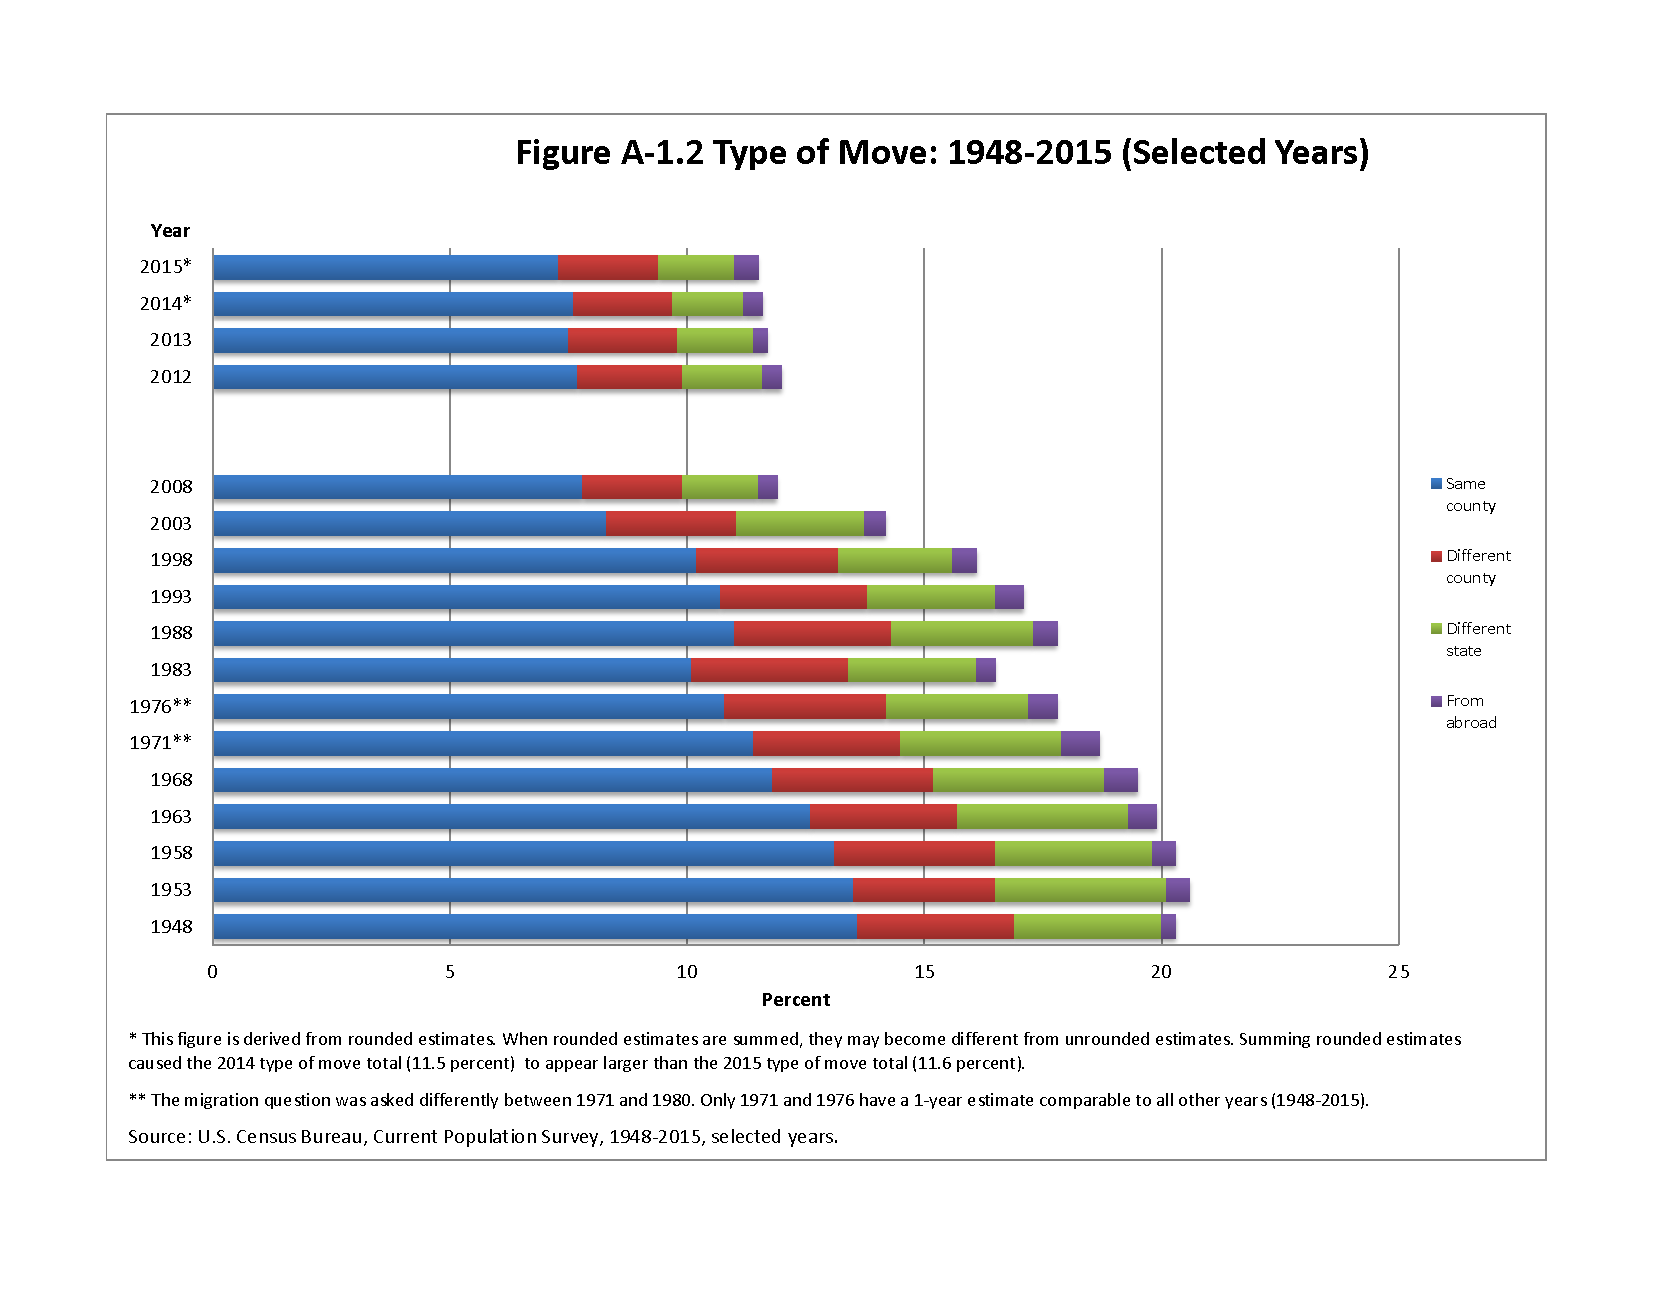
“CPS Historical Migration/Geographic Mobility Tables” 2015.
US Census Bureau.
Figure A-1.1
Figure A-1.2
*
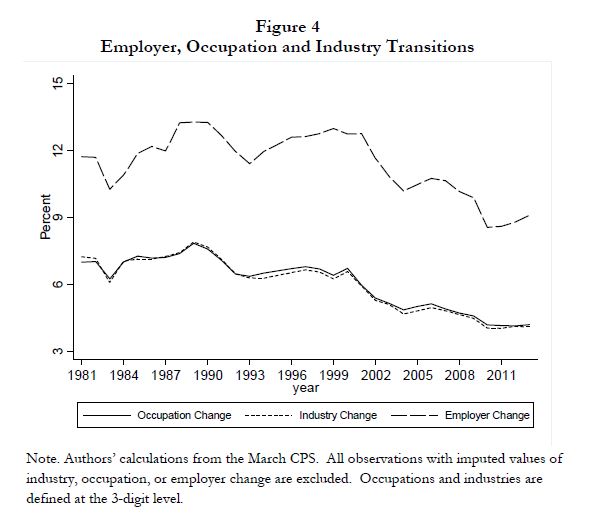
A 2014 white paper by the National Bureau of Economic Research argues that, since the 1980s, Americans are moving less because they’re changing jobs less often.
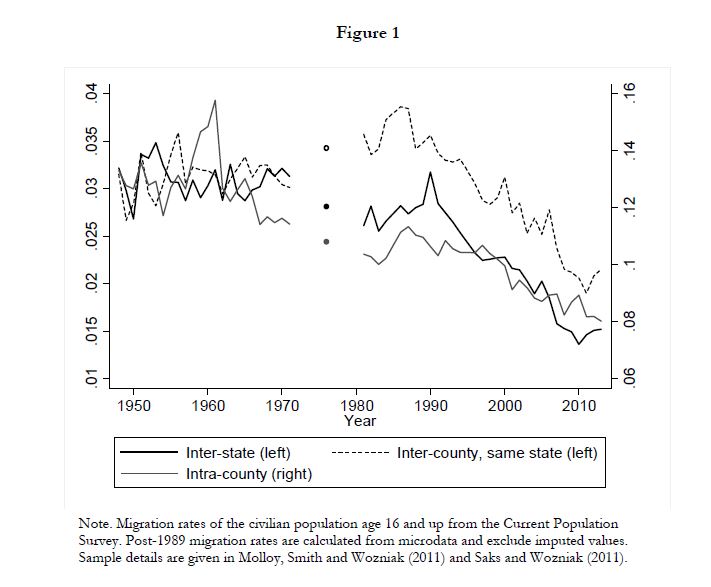
Using data from the Current Population Survey, US Census.
Using data from National Longitudinal Surveys of Youth from the late 1970s to the late 2000s
TO-DO: CHECK IF THE ANNUAL DATA ARE AVAILABLE IN THE NBER PAPER. THE PAPER IS FREE FOR JOURNALISTS TO DOWLOAD, BUT WE NEED TO COMPLETE REGISTRATION (PENDING AS OF 6/2).
src:
Raven Molloy, et al. April 2014.
“Declining Migration within the U.S.: The Role of the Labor Market”
National Bureau of Economic Research (NBER)
via:
Richard Florida. April 28, 2014.
“Why Americans Are Moving Less: New Jobs Aren’t Worth It.”
CityLab — The Atlantic
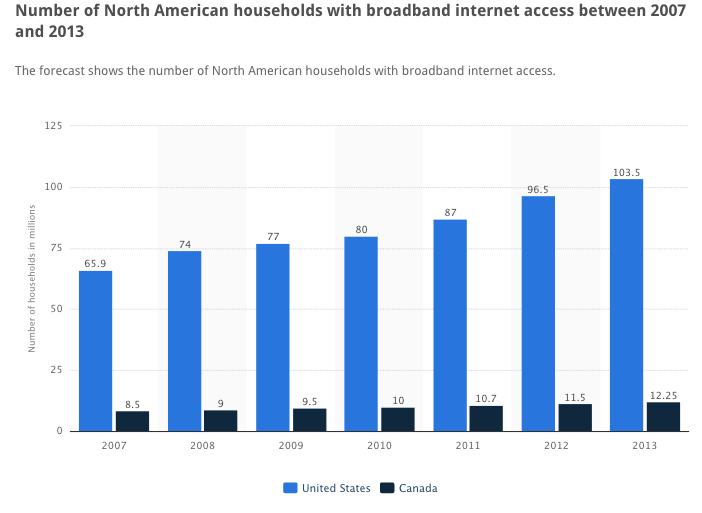
Bandwidth to Homes
U.S. Fixed-broadband subscriptions, 2000-2014
Aggregated in the following Google Sheet:
src:
ITU. 2015.
“U.S. Fixed-broadband subscriptions.”
via the ITU Statistics page
*
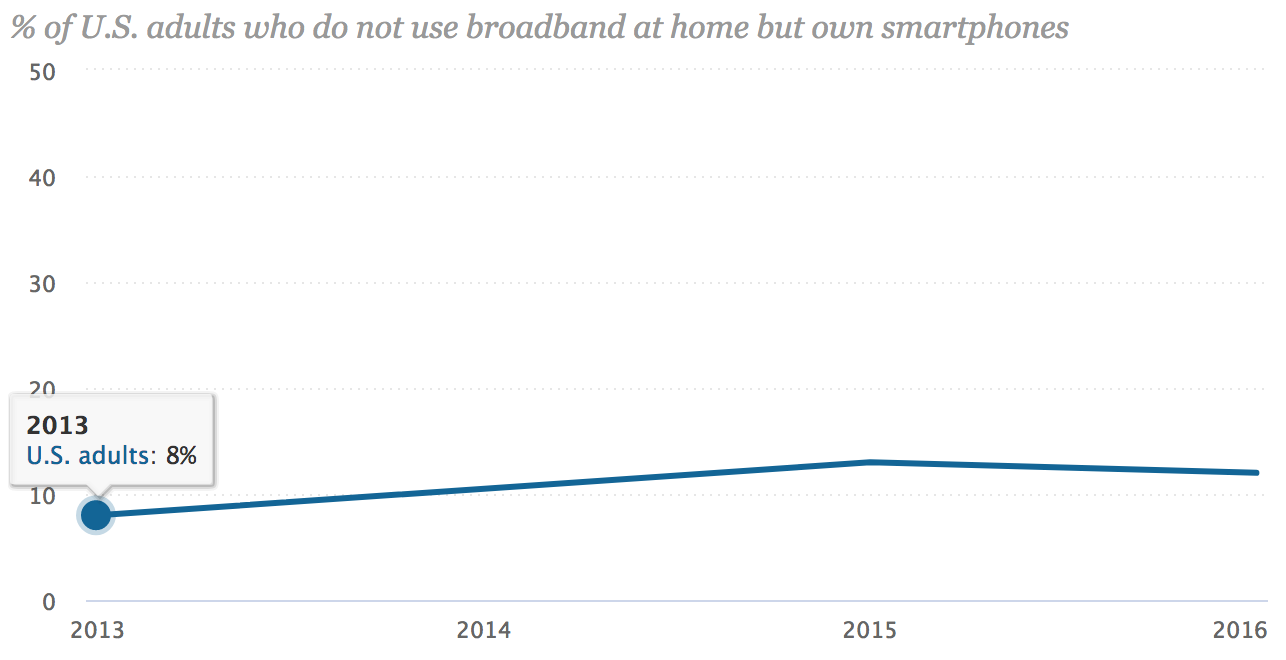
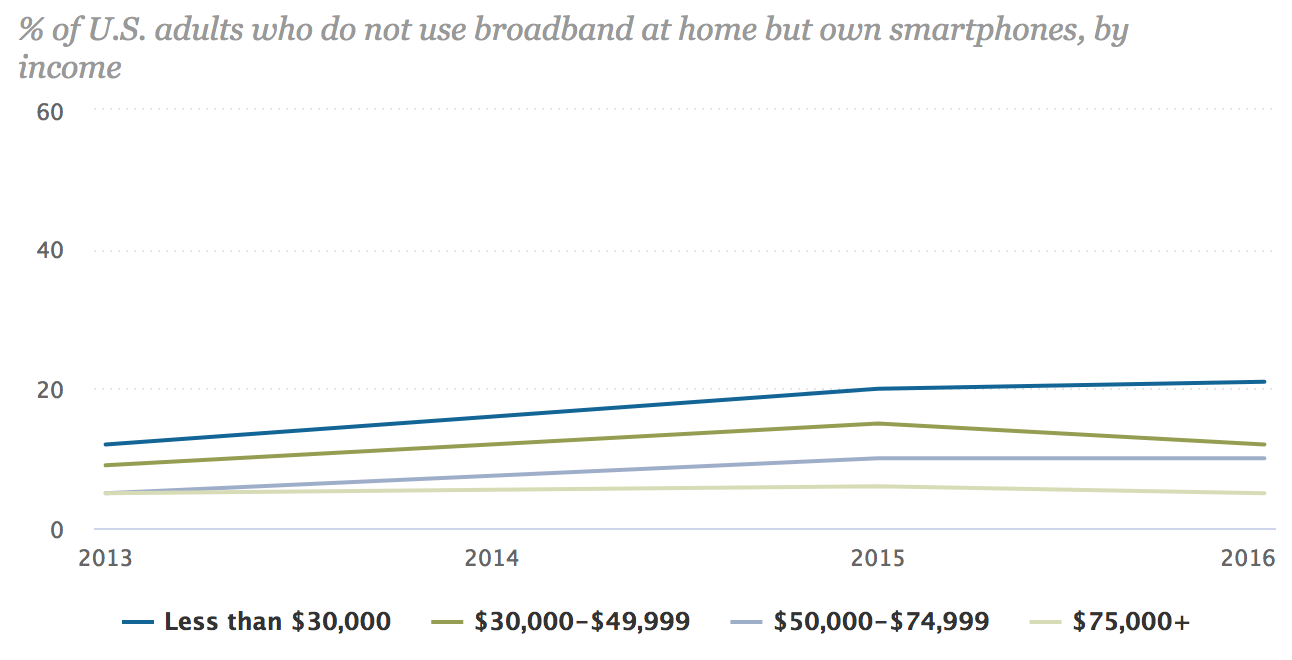
Pew finds that home broadband use has plateaued
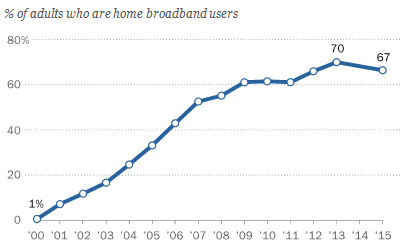
Pew also finds that several groups are shifting their home internet connectivity away from broadband and toward smartphones.
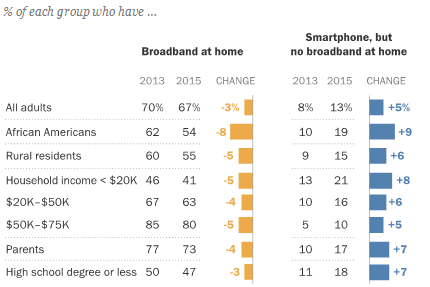
src:
Pew Research Center. December 2015.
“Home Broadband 2015.”
*
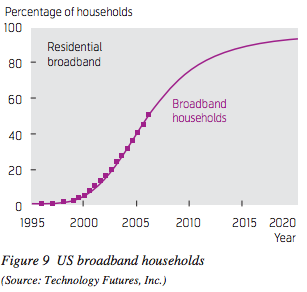
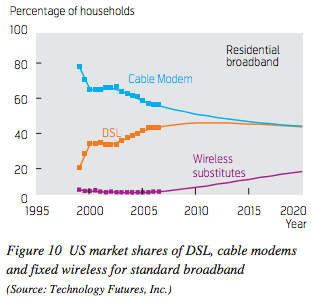
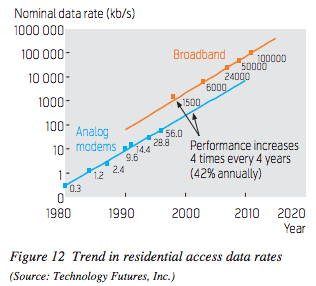
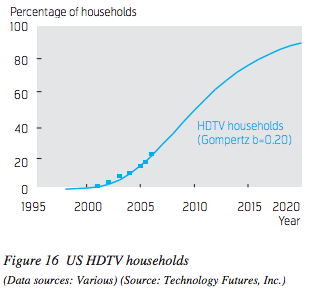
In 2002, Technology Futures published several forecasts of residential broadband subscriptions and speeds looking out to 2020. The base model forecast is informed by the Gompertz model, which is usually followed by major consumer adoptions.
The forecasts are notably off from the Pew and ITU reports above. However, one of the historical comparisons in the paper, to Pay Cable adoption, might help to explain the problem with their own forecast for broadband subscriptions.
Pay Cable’s adoption figures from 1973-1981 do not follow the Gompertz model because of a disruption by VCR adoption. Home broadband subscriptions may be experiencing a similar disruption by mobile devices with internet subscriptions.
src:
Lawrence K. Vanston, et al. 2002.
“Residential Broadband Forecasts.”
Technology Futures Inc.
contact: lvanston@tfi.com
In 2009, Technology Futures published an updated broadband forecast to 2020:
src:
Lawrence K. Vanston, Ray L. Hodges. February 2009.
“Forecasts for the US Telecommunications Network.”
Telektronikk 3/4.2008.
*
Chart 3: Actual download speeds by ISP, 2011 to 2014
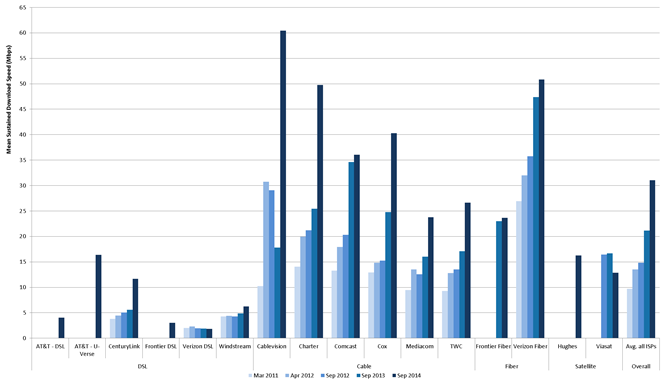
Excerpt:
Chart 3 shows the actual download speeds experienced by each participating ISP’s subscribers — averaged across all analyzed speed tiers, geography, and time — from 2011 to 2014. The actual download speed, averaged across all participating ISPs, has tripled during this period, from approximately 10 Mbps in March 2011, to approximately 15 Mbps in September 2012, to nearly 31 Mbps in September 2014.
src:
FCC. December 30, 2015.
“2015
Measuring Broadband America Fixed Broadband Report.”
*
Table 4. Fixed Broadband Speeds (in Mbps), 2014–2019, North America
2014 — 21.8
2015 — 25.4
2016 — 28.7
2017 — 33.7
2018 — 38.7
2019 — 43.7
CAGR 2014-2019 — 15%
Excerpt:
Broadband speed is a crucial enabler of IP traffic. Broadband speed improvements result in increased consumption and use of high-bandwidth content and applications. The global average broadband speed continues to grow and will more than double from 2014 to 2019, from 20.3 Mbps to 42.5 Mbps. Table 4 shows the projected broadband speeds from 2014 to 2019. Several factors influence the fixed broadband speed forecast, including the deployment and adoption of fiber to the home (FTTH), high-speed DSL, and cable broadband adoption, as well as overall broadband penetration. Among the countries covered by this study, Japan, South Korea, and Sweden lead in terms of broadband speed largely due to their wide deployment of FTTH.
Note: North America is tied with Central and Eastern Europe for the lowest CAGR.
src:
Cisco. June 23, 2015.
“The Zettabyte Era—Trends and Analysis.”
*
Census – Type of Household Internet Connection
2013 data here.
2013 is the first year of tracking
done under the American Community Survey (ACS)
Only other year with this data available is 2014.
The Current Population Survey (CPS) has asked about internet access since 1997.
*
src:
Statista (original source hidden behind paywall)
