

Refractive Surgery
Summary
Refractive surgery (corrective eye surgery) includes PRK, LASIK, and SMILE procedures, among others.
Market Scope is a research firm that collects data on LASIK procedure rates, and seems to be the primary (if not the only) source for such data. I’ve found an 18-year dataset, 1996-2014 (the last two-years of which were forecast). I’ve contacted Market Scope to inquire if they have long-term forecasts as well.
No US forecasts obtained yet. The best academic paper addressing refractive surgery forecasts (in China) suggests that procedure rates are fairly stable in the US.
Research Excerpts
As of 2011, more than 11 million LASIK procedures had been performed in the United States.
Src:
Dan Lindfield and Tom Poole. 2013 February. “Nd:YAG Treatment of Epithelial Ingrowth.” Cataract & Refractive Surgery Today Europe.
Citing Market Scope.
*
Number of LASIK (laser-assisted in situ keratomileusis) surgeries in the United States from 1996 to 2014 (in 1,000s).
Src:
Market Scope via Statista
(source inferred via other sources quoting the same numbers and attributing to Market Scope. Statista hides their name behind a paywall)
*
In 2012 U.S. procedure volumes were approximately 700,000 procedures per year. The average price point of $1500 per eye in the United States factors to a total U.S. market size of $1.05 Billion / Year.
The model for potential market growth is based on the observation that the laser refractive surgery market in the United States demonstrated saturation at approximately 2.7% penetration, and showed a baseline volume at approximately 1.2% penetration. In this context, market penetration is defined as annual procedure volume compared to the potential candidate pool.
Potential U.S. Candidate Pool = Overall Population (310 Million People)
x Patients in Treatable Age Group of 18 to 45 Years (36.5%)
x Patients with Treatable Refractive Errors (50%)
x Patients with Adequate Disposable Income (50%)
EQUATION 1: General estimate of United States candidate pool for laser refractive surgery. The result calculates to 28.3 million people.
Laser refractive surgery volumes in the United States grew steadily to peak in 2000 at about 1.5 million procedures (eyes). Volume declined during the economic downturn that began in Q4 2001 and rebounded slightly from 2003 through 2007. The U.S. market has not recovered following the macroeconomic downturn of 2008. It stood at approximately 700,000 procedures in 2012. [Citing Market Scope figures given above.]
Src:
Guy Kezirian, et al. 2013. “Forecast of Laser Refractive Surgery in China: 2013-2023.” Northwestern University Kellogg School of Management. Pages i, iii, Figure 1.
Dr. Kezirian (info@surgivision.net) is a board certified and sub-specialty trained ophthalmologist. His company has run several FDA studies for excimer laser approvals. He is an industry consultant in ophthalmology through his company, SurgiVision Consultants.
Email inquiry sent 10/9 seeking recent figures and U.S. forecasts.
*
Ron Krueger, MD, of the Cleveland Clinic in Cleveland, Ohio, discusses his forecast for the future of LASIK procedures.
LASIK will probably be replaced by something else in the next 10 years due to flap complications, biomechanical concerns, dry eye concerns.
SMILE procedure (or something like it) will probably replace it.
Src:
Mark Kontos and Ron Krueger. 2014. “Will LASIK Still Be Kind in 2025?” Aspen 2014. American-European Congress of Ophthalmic Surgery. Eyetube.net.
*
Professional Organizations (inquiries sent 10/13)
American-European Congress of Ophthalmic Surgery
contact form
American Society of Cataract and Refractive Surgery
media inquiries form
Outpatient Ophthalmic Surgery Society
Kent L. Jackson, Executive Director, kjackson@ooss.org
American Academy of Ophthalmology
media@aao.org
Update
Trudy Larkins, Executive Direction of AECOS, says:
I think Dave Harmon and Bill Freeman of MarketScope are your best resources.
Since these procedures are elective (i.e. not covered by any type of medical insurance), figures have historically been “best estimates.”
Toric IOLs are extremely popular and perhaps the most widely used. The patient pays out of pocket and the surgeon is able to significantly reduce the amount of pre-op as well as post-op (surgically induced) astigmatism.
We had hoped that having LASIK would become as anticipated as getting braces on your teeth. Unfortunately, this did not happen and some bad PR apparently resonated much more than we anticipated.
I would suggest that you contact someone from the American Refractive Surgery Council. AECOS is an Advisor to this group which is made up of industry as well as refractive surgery physicians. I do know that Richard Lindstrom MD, Eric Donnenfeld MD and Kerry Solomon MD are all very actively involved in this organization and would be great to interview.
CC emailed Dave Harmon at Market Scope directly (10/16/15)
Supplement Usage Prevalence
Usage Trends
The CDC tracks U.S. dietary supplement usage (which includes multivitamins and multiminerals) via its National Health and Nutrition Examination Survey (NHANES), which began in the 1970s. In 2011, the CDC said over half of U.S. adults were taking dietary supplements.
Overall usage trend:
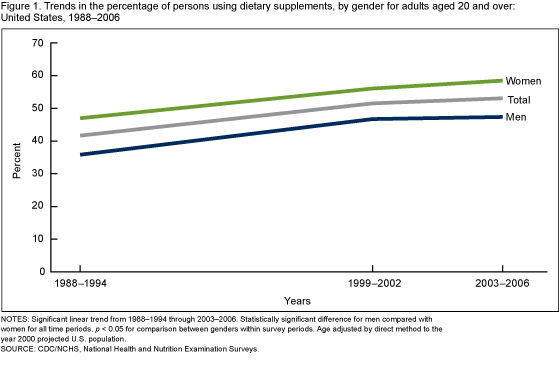
Usage prevalence percentages for adults over 20:
| Year | Men | Women |
| 1971-1975 | 28% | 38% |
| 1976-1980 | 32% | 43% |
| 1988-1994 | 35% | 44% |
| 1999-2000 | 47% | 56% |
| 2003-2006 | 47% | 59% |
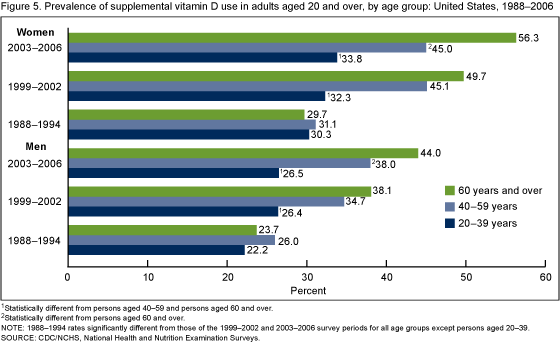
Vitamin D use by age group and gender:
Srcs:
Gahche J, Bailey R, Burt V, et al. 2011. “Dietary Supplement Use Among U.S. Adults Has Increased Since NHANES III (1988–1994).” NCHS data brief, no 61. Hyattsville, MD: National Center for Health Statistics.
Madison Park. 2011 April 13. “Half of Americans Use Supplements.” CNN.
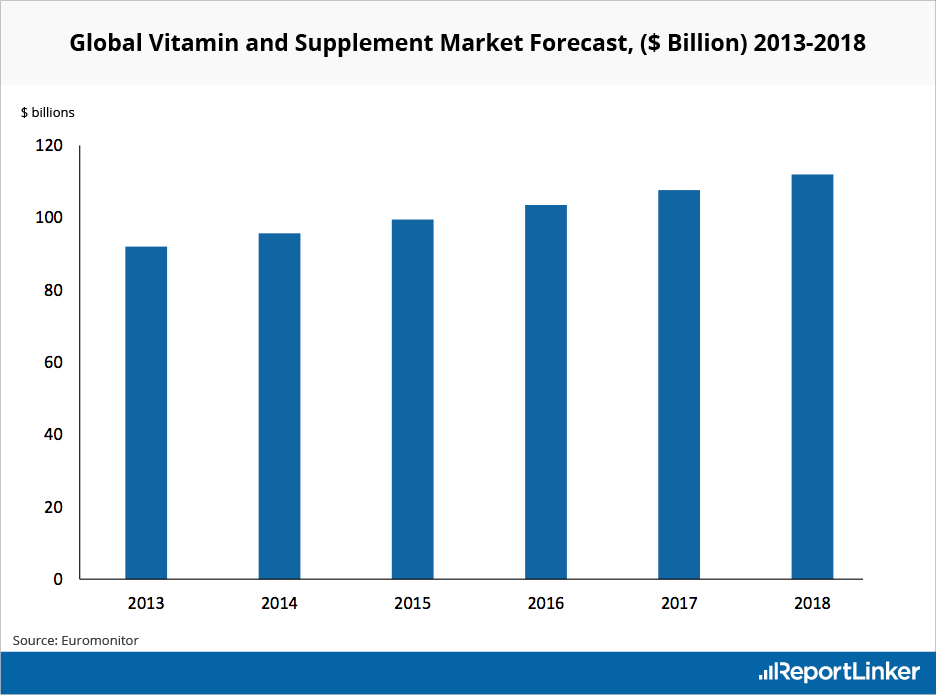
Market Research
Euromonitor tracks the vitamins and dietary supplements (VDS) market. In 2013, they estimated that the market would grow at a CAGR of 4% between 2013 and 2018 to reach $112 billion in 2018.
Src:
Euromonitor (via Reportlinker). 2013. “Global Vitamin and Supplement Industry Overview.”
Per Capita Rx Usage
Current data
Evaluate and IMS Health both track current and recent rates of drug prescription per capita.
From Evaluate:
2011: 10
2013: 9
src: 2013. Evaluate. Medical Expenditure Panel Survey. Spreadsheet shared by email, 2015 Sep 10.
From IMS Health:
2010: 11.46
2011: 11.33
2013: 12.2
2014: 2.1% more than 2013
Src (2010, 2011): 2012. IMS Institute for Healthcare Informatics. “The Use of Medicines in the United States: Review of 2011.″
Src (2013): 2014. IMS Institute for Healthcare Informatics. “Medicine use and shifting costs of healthcare: A review of the use of medicines in the United States in 2013.″
Src (2014): 2015. IMS Institute for Healthcare Informatics. “Medicines Use and Spending Shifts: A Review of the Use of Medicines in the U.S. in 2014.″
Michael Kleinrock, of IMS, explains via email that Rx usage rates have been very consistent for a very long time. Their data goes back to the early 90s, but the collection of age-band data is a relatively recent addition. They haven’t yet produced harmonized figures showing all of their historic data.
Forecast data
In 2008, a paper published by the Department of Health and Human Services gave forecasts for prescriptions dispensed per visit to the year 2030. Three forecasts were made for prescriptions per physician office visit, per hospital/clinic outpatient visit, and per emergency visit. The forecasts are divided into age bands for patients aged 0-44, 45 to 64, and 65 years and older. The forecasts are all based on analysis of the CDC’s National Ambulatory Medical Care Survey (NAMCS) from 1995 to 2004, with trend extrapolation from 2005 to 2030.
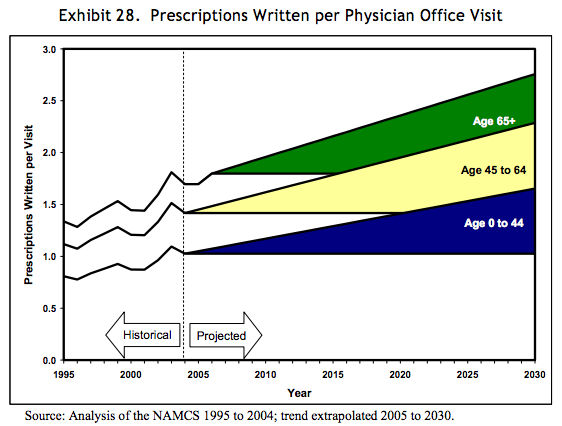
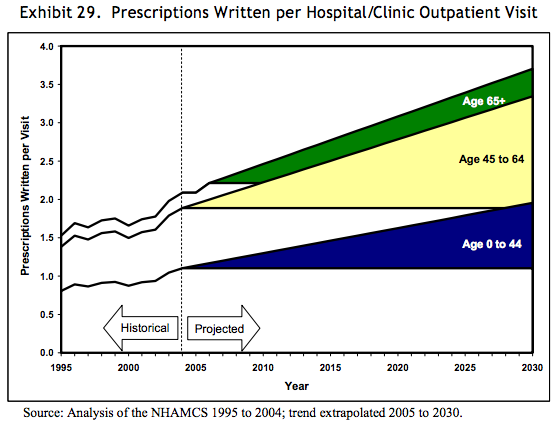

Src: 2008. Department of Health and Human Services. “The Adequacy of Pharmacist Supply: 2004 to 2030.” Exhibits 28-30, pp 31, 32.
Pharmaceutical Sales Through 2020
EvaluatePharma (life science market research firm) releases an annual report of current pharmaceutical sales figures with forecasts looking 5 years out.
According to the 2015 report, Novartis was the number one pharmaceutical company in 2014 and is forecast to maintain its position in 2020
Other indicators reported:
worldwide prescription drug sales (2006-2020)
regional prescription drug sales
Top 20 Companies by Rx sales in 2020
worldwide R&D spending by company
worldwide Rx drug & OTC sales by therapy area in 2020
Src: “World Preview 2015, Outlook to 2020.” 2015. Evaluate.
They also track sales volume and pricing including cost and volume per patient for the U.S. and other regions. Not available in the free report – contact them.
Media Contacts:
Evaluate and EP Vantage (for general questions)
Christine Lindgren
+1 617-866-3906
christine.lindgren@evaluategroup.com
Chempetitive Group (for U.S. media)
Rachel Wallace
+1 781-775-3640
rwallace@chempetitive.com
