

Historic Variety of Sports
Summary
To get a sense for the growth in the variety of commonly practiced sports, I considered which organizations would have been tracking individual sports in an official capacity. The International Olympic Committee (IOC) has a fairly long modern history, but sports included in the Olympic Games are restricted by the organizations rules, so while the IOC list certainly includes many of the most popular sports, and reflects some shifts over the last century, it certainly does not include many emerging but popular sports, or sports that are very popular in a particular region (like American football). I wrote to a number of organizations that lobby on behalf of sports that may have international federations, but lack representation in the Olympics, but I was not able to obtain historic data from any of them. I also thought to consult lists maintained by the National Federation of State High School Associations (NFHS) and the National Collegiate Athletic Association (NCAA), but these share limitations similar to the sports represented by the IOC. At the other end of the spectrum, I found one website, Topend Sports, which has a fantastic list of sports from around the world which seems quite comprehensive, but unfortunately offers no date information (either documenting when the sport was created or when it became popular).
Findings
International Olympic Committee (IOC)
Some context on IOC terminology and rules:
The IOC uses the terms “event,” “discipline” and “sport” to organize their athletic competitions. An event is any competition that results in the awarding of medals, such as the women’s 100-meter backstroke. The discipline of swimming, which comprises various events like the backstroke, breaststroke and freestyle, is a branch of the sport aquatics.
For a sport or discipline to be considered for the Summer Olympics, it must demonstrate popularity among both genders in various parts of the world. Men from at least 75 countries and women from at least 50 countries should practice a given sport on four continents.
When determining which sports to include in an Olympic program, at least 25 of the sports offered must come from the 28 sports established by the IOC. Up to three additional sports may be added that are not from among this pre-established group.
src:
Greg Soltis. July 27, 2012. “The Incredible Evolution of the Olympics.” LiveScience.
After writing to the International Society of Olympic Historians, I was referred to Bill Malon, who maintains an extensive Excel document with data from 1896-2012, including:
Number of Events per Sport by Year (by gender)
Total # of Events by Year (broken down by gender)
Total # Sports by Year (broken down by gender)
List of Sports and Events by Year (by gender)
List and Total # of Countries by Year
Mr. Malon’s Excel file (originally shared as OGCompShort.xls) is available in this Google Sheets document:
A simple list of the number of sports in each Olympic Games by year is also maintained by Topend Sports: Olympic Games Sports Changes. The list notes which sports were added or dropped in each Games.
*
Agencies That Support the IOC
SportAccord
An association composed of autonomous and independent international sports federations and other international organisations contributing to sport in various fields.
SportAccord promotes sports, increases its and its members’ recognition by the Olympic Movement, and organizes multi-sports games.
To be a Member, an organization must group together the majority of the National Federations throughout the world practicing its sport and regularly hold international competitions. To be an Associate Member, an organization can either group together the activities of several Members or National Olympic Committees for the purpose of organizing competitions, or have objectives recognized by the Council as benefiting the other Members of the Association.
(Previously known as GAISF, the General Association of International Sports Federations.)
src: SportAccord. “2014 Statutes.” Accessed April 7, 2016.
Members list – 106 members
Contact: sportaccord@sportaccord.com
EMAILED 4/13. No reply.
Also sent inquires to The Association of IOC Recognised International Sports Federations (ARISF), info@arisf.org, and the Alliance of Independent Recognised Members of Sport (AIMS), contact form. No reply from them either.
*
Sports counted in the NFHS Annual Survey, 1969-2015
Counting each sport that gets its own major subject heading in the tables. For example, “Skiing — Alpine” and “Skiing — Cross Country” count for a total of two sports. However, “Football — 11-player”, which often includes three subheadings (“6-player,” “8-player,” and “9-player”), is only counted once. “Flag Football,” with its own heading is counted separately from “Football — 11-Player.”
For example:
[NFHS-skiing-headings.png]
…
NFHS-football-headings.png
Note: Each of the annual surveys are freely available, but this is a sampling of every five years.
1969/70 – 29 sports
1975/76 – 31 sports
Added: Archery, Drill Teams, Table Tennis, Weightlifting
Dropped: Rowing, Rugger
1980 – 36 sports
Added: Canoeing, Crew, Eskimo Games, Judo, Soft Tennis, second Softball category
Dropped: Rugby
1985 – 31 sports
Dropped: Curling, Drill Teams, Eskimo Games, Soft Tennis, Table Tennis
Added: Equestrian, Heptathalon
Condensed to one entry each: Softball, Track & Field
1990 – 32 sports
Added: Other
1995 – 38 sports
Added: Adapted Sports, Competitive Spirit Squads, Team Tennis,
De-condensed: Skiing, Softball, Track & Field
2000 – 35 sports
Condensed: Skiing, Softball, Track & Field
2004/05 – 41 sports
Added: 4 Dance categories, Flag Football, Skiing category, Snowboarding
Dropped: Decathalon, Heptathalon, Pentathalon, Water Polo
De-condensed: Skiing, Softball, Track & Field
2009/10 – 42 sports
Added: Air Riflery, Rodeo, Synchronized Swimming, Water Polo
Condensed: 3 Dance categories, 2 Skiing categories
2014/15 – 53 sports
Added: Boce, Dance category, Decathalon, Heptathalon, Kayaking, Mixed Coed Valleyball,
Mountain Biking, Rugby, Sailing, Soft Tennis, Surfing,
Srcs:
The National Federation Of State High School Associations.
“1969-2014 High School Athletics Participation Survey Results.” Pp. 1, 23, 56, 112, 176, 258, 344, 418, 501.
and
“2014-15 High School Athletics Participation Survey.” Pp. 1-2
*
International Sports Federations
Wikipedia – List of international sports federations
Includes federations recognized by IOC, ASOIF, AIOWF, ARISF, IPC, and SportAccord. Many of the federations have Wikipedia pages showing the date of creation.
Topend Sports also maintains a list of international sport federations, sorted alphabetically by sport. Current total count: 171.
Note: No links to the federation websites. Links to internal pages about the sport – no date information, just short, general descriptions of the sports.
*
More Comprehensive Sports Lists
Topend Sports maintains a “Complete List of Sports from Around the World.”
The list currently has 806 entries, but no date information. Separately, they maintain a list of “Ancient and Extinct Sports.”
Topend Sports also has an interesting list of “New and Unusual Sports” submitted by readers, but I think many of the sports are just theoretical.
*
Other Resources
North American Association of Sports Economists
Journal of Sports Management
current editor: David Shilbury
Published by the North American Society For Sports Management (NASSM)
Indexed in Human Kinetic Journals
North American Society for Sport History (NASSH)
Sport In American History
group blog – primarily academic contributors
links page points to other orgs
The LA84 Foundation operates the largest sports research library in North America, the Paul Ziffren Sports Resource Center. It is a state-of-the-art research facility and learning center dedicated to the advancement of sports knowledge and scholarship. The Foundation also maintains a sizable collection of historic sport art and artifacts much of which was inherited from the former Helms Athletic Foundation Sports Halls of Fame. Its digital holdings, accessible to the public through its website, include not only a complete set of Olympic Official Reports, but also the full run of the Journal of Olympic History and its predecessor, Citius, Altius, Fortius through 2012.
[Description from ISOH]
NOTE: reference queries involving research charged $40/hour
Here’s an index to some older sports history journals available online. Seems like perhaps this should not be public, but there it is! And the full text of articles are available, but difficult to navigate (no search).
Sports and Recreation Participation
Summary
Forecast data for sports and recreation participation seems rare.
The USDA Forest Service has published a few 50-year forecasts of outdoor recreation participation. The forecasts are based on data from it’s semi-regular National Survey on Recreation and the Environment. However, the only national-level forecast I’ve seen was published in 1999. I’ve emailed the authors to inquire if more recent national forecasts have been made. (Forecasts for the southern region of the US have been made as recently as 2013).
The Bureau of Labor Statistics publishes 10-year job outlook and employment change forecasts for professional athletes. The latest figures were published December 2015.
Beyond these two forecasts, I’ve found a couple sources for historic sports participation data: the Sports & Fitness Industry Association’s “Sports Participation in America” and ”Trends in Team Sports Report” (tidbits available through press releases going back to 2007); The Physical Activity Council Report (data for 2010-2015 available, possibly going back to 2000 – emailed for more info); United Health Foundation’s annual “American’s Health Rankings” survey; the National Federation of State High School Associations’ “Athletics Participation Survey” (annual data available 1971-2014).
Data and Excerpts
Non-Professional Adult Participation
The most significant forecast data I’ve found comes from the USDA Forest Service, via a 1999 publication. Later forecasts have been made for specific regions of the US. This is the only set of national-level forecasts I’ve found.
The publication gives projections of future recreation participation (by millions of participants aged 16 and over) and consumption (by millions of days annually and by millions of primary purpose trips taken) at lo-year intervals beginning in 2000 and ending in 2050. Projections for 24 specific outdoor activities and sports are grouped as following: winter, water, wildlife, dispersed land, and developed land. The projections are given as indexes, based on the year 1995.
Two types of regional cross-sectional models were used:
– a logistic regression model (for participation)
– a negative binomial form of a count data model (for consumption)
I’ve aggregated the forecasts in this table.
The data in these projections comes from the National Survey on Recreation and the Environment (NSRE), which has been collected since 1960 (originally as the National Recreation Survey). The survey has been conducted in 1960, 1965, 1970, 1972, 1977, 1982-83, 1994-95, 1999-2001, 2005-2011 (although this report only reflects data through the 94-95 survey).
Src: J.M. Bowker, Donald B.K. English, H. Ken Cordell. 1999. “Projections Of Outdoor Recreation Participation To 2050.” In Outdoor Recreation in American Life.
Note: Emailed the authors, Bowker and Cordell March 14, 2016, to inquire about subsequent national-level projections. No reply received.
*
Sports & Fitness Industry Association (SFIA) reports
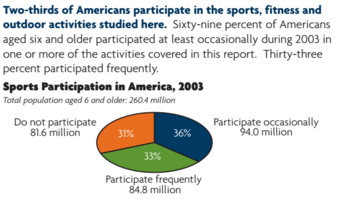
The SFIA (formerly the Sporting Goods Manufacturers Association, or SGMA) has published an annual report called “Sports Participation in America” since 2000 (data going back to 1999). The report describes participation levels in over 100 sports, recreation, and outdoor activities. Each report includes a general breakdown of the number of Americans aged 6 and older who participated in at least one of the covered sports frequently, occassionally (later: regularly or casually), or did not participate in any.
Here’s an example of the chart from the report published in 2004:
Src:
SGMA. 2004. “Sports Participation in America: 2004 Edition.” file name: Sports Part in Am 2004.pdf
I’ve seen data like the above from 1999-2003, and 2008, which is aggregated in this table, in columns C, and E-F. [Sources given in the comments for each cell.] The participation reports also gives a variety of other statistics describing the growth in participation in individual sports, including participation differences correlated with demographic characteristics.
In addition to the participation report, SFIA also publishes data describing core participants in team sports (”Trends in Team Sports Report” — tidbits available through press releases going back to 2007). The distinction of “core” indicates frequent and regular players (the threshold varies by sport/activity). This is the largest collection of core sports participation I’ve found:
Team Sports Core Participation (in thousands)

click for larger
Via: Hotel News Now, May 28, 2013
Note: Emailed Corey Bockhaus, cbockhaus@sfia.org, research@sfia.org, 3/14 to ask about older and more recent data like above. Hoping he can fill the gap in general participation data from 2004-2007, and 2009+.
*
2016 Physical Activity Council Report
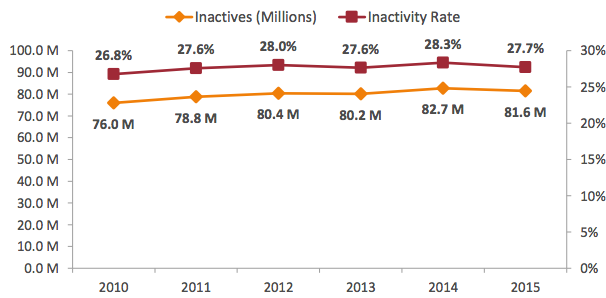
Annual study tracking participation in over 120 sports. The PAC report gives overall statistics (percentages and raw figures), as well as sport-specific statistics (raw figures, and annual change percentages).
“The overall levels of inactivity decreased marginally in the last 12 months from 28.3% of Americans age six and older in 2014 to 27.7% in 2015. However, there are still 81.6 million inactive Americans.”
“Inactivity decreased for most age groups, with 13 to 17 year olds having the biggest drop (1.4%) and 35 to 44 year olds having the lowest decrease (0.2%) in 2015. While those Americans between the ages of 45 to 54 remained flat in inactivity, there was a gradual increase in inactivity for 55 to 64 year olds.”
212.6 million “actives” taking part in a wide range of sports and fitness activities in 2015, a slight increase from 209.3 actives in 2014.
| Total Participation Rate by Activity Category, 2015 | |
| Fitness Sports | 61.5% |
| Outdoor Sports | 48.4% |
| Individual Sports | 34.8% |
| Team Sports | 23.1% |
| Racquet Sports | 13.5% |
| Water Sports | 14.2% |
| Winter Sports | 7.4% |
| Activity Category Segmented by Generations, 2015 | |||||||
| Individual Sports | Racquet Sports | Team Sports | Outdoor Sports | Winter Sports | Water Sports | Fitness Sports | |
| Gen Z (2000+) | 48.2% | 18.8% | 58.8% | 61.8% | 13.1% | 17.5% | 50.6% |
| Millennials (1980-1999) | 43.6% | 20.2% | 31.8% | 57.4% | 12.2% | 20.3% | 66.7% |
| Gen X (1965-1979) | 36.9% | 13.4% | 17.9% | 51.4% | 7.0% | 14.8% | 66.2% |
| Boomers (1945-1964) | 24.1% | 7.1% | 6.4% | 38.6% | 2.9% | 9.2% | 60.0% |
| Fitness and Activity-Related Spending over a 5-year Span, 2015 (% of people who spent on) |
|
| Sports/recreation footwear | 45.3% |
| Sports/recreation clothing | 44% |
| Outdoor recreation activities | 39.5% |
| Sports/recreation equipment | 34.9% |
| Gym/membership fees | 29.3% |
| Travel to take part in sports & recreation | 28.1% |
| Team sports outside of school | 25% |
| Team sports at school | 20.2% |
| Individual sports events | 19.7% |
| Lessons/instruction/sports camps | 19.3% |
| Winter sports | 17.9% |
Based on 32,658 online interviews with a 95% confidence level. A weighting technique was used to balance the data to reflect the total US population ages six and above. The total population figure used was 294,141,894 people ages six and older.
“Inactivity” is defined to include those participants who reported no physical activity in 2015 and an additional
18 sports/fitness activities that require minimal to no physical exertion.
Contributions from International Health, Racquet and Sportsclub Association, The National Golf Foundation, The Outdoor Foundation, The Snowsports Industries America, The Sports and Fitness Industry Association, The Tennis Industry Association, and United States Tennis Association
The report indicates that data have been collected since 2000, but the report only shows figures going back to 2010.
Note: I’ve emailed to inquire about pre-2010 data (March 9, 2016, info@sportsmarketingsurveysusa.com).
Src: Physical Activity Council. March 1, 2016. “2016 Participation Report.”
*
| Adults reporting no physical activity or exercise outside of work in last 30 days |
|
| 2015 | 22.6% |
| 2014 | 25.3% |
| 2013 | 22.9% |
| 2012 | 26.2% |
| 2011 | 23.9% |
| 2010 | 23.8% |
| 2009 | 24.6% |
| 2008 | 22.6% |
| 2007 | 22.6% |
| 2006 | 23.8% |
| 2005 | 22.5% |
| 2004 | 22.7% |
| 2003 | 24.1% |
| 2002 | 25.4% |
| 2001 | 26.7% |
| 2000 | 27.7% |
| 1999 | 27.7% |
| 1998 | 27.8% |
| 1997 | 27.8% |
Src: United Health Foundation. “United States Physical Inactivity (1997-2015).” Accessed March 16, 2016.
*
Professional Participation
BLS – Athletes and Sports Competitors
2014
Median Pay – $43,350/year
Number of Jobs – 13,700
Job Outlook 2014-2024 – 6% (as fast as average for all occupations)
Employment change 2014-2024 – 800 more jobs
Src:
Bureau of Labor Statistics. Occupational Outlook Handbook. “Athletes and Sports Competitors.” Summary. December 17, 2015.
| Year | Total Employment |
| 1999 | 10,620 |
| 2000 | 9,920 |
| 2001 | 10,520 |
| 2002 | 10,400 |
| 2003 | 11,840 |
| 2004 | 12,250 |
| 2005 | 12,230 |
| 2006 | 12,500 |
| 2007 | 12,670 |
| 2008 | 13,960 |
| 2009 | 13,620 |
| 2010 | 12,660 |
| 2011 | 12,630 |
| 2012 | 12,450 |
| 2013 | 13,880 |
| 2014 | 11,520 |
| 2015 | 11,710 |
Src:
Bureau of Labor Statistics. Occupational Employment Statistics. “OES Data.” 1999-May 2015.
and
Bureau of Labor Statistics. Occupational Employment Statistics. “27-2021: Athletes and Sports Competitors.”
*
Student/Youth Participation
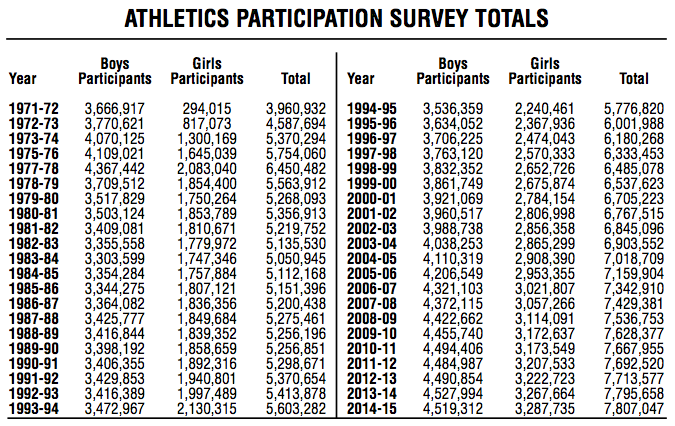
The National Federation Of State High School Associations has conducted its annual “Athletics Participation Survey” since 1971. The survey is completed by high schools with membership in the NFHS and its member associations.
Src: National Federation of State High School Associations. “2014-15 High School Athletics Participation Survey Results.” Page 55 (page 3 of this PDF).
Press release for 2014-15 school year available here.
Excerpt:
“Based on figures from the 51 NFHS member state high school associations, which includes the District of Columbia, the number of participants in high school sports reached an all-time high of 7,807,047 – an increase of 11,389 from the previous year.”
Participation data for recent individual years available are available on the NFHS website at the “Participation Statistics” page.
Note: 3/9 Emailed Bruce Howard to ask what percentage of high school students participate in sports, and what percentage of high schools participate in their survey.
*
Among 6- to 17-year-olds, the average number of team sports played per participant has fallen 5.9 percent in the last five years, dropping from 2.14 to 2.01, according to the SFIA.
| Tracking The Changes In Youth Sports Participation (Participants by ages 6-17, thousands) |
|||
| 2009 | 2014 | % Change | |
| Baseball | 7,012 | 6,711 | -4.3% |
| Basketball | 10,404 | 9,694 | -6.8% |
| Field hockey | 438 | 370 | -15.5% |
| Football (tackle) | 3,962 | 3,254 | -17.9% |
| Football (touch) | 3,005 | 2,032 | -32.4% |
| Gymnastics | 2,510 | 2,809 | 11.9% |
| Ice hockey | 517 | 743 | 43.7% |
| Lacrosse | 624 | 804 | 28.8% |
| Rugby | 150 | 301 | 100.7% |
| Soccer (indoor) | 2,456 | 2,172 | -11.6% |
| Soccer (outdoor) | 8,360 | 7,656 | -8.4% |
| Softball (fast-pitch) | 988 | 1,004 | 1.6% |
| Softball (slow-pitch) | 1,827 | 1,622 | -11.2% |
| Track and field | 2,697 | 2,417 | -10.4% |
| Volleyball (court) | 3,420 | 2,680 | -21.6% |
| Volleyball (sand/beach) | 532 | 652 | 22.6% |
| Wrestling | 1,385 | 805 | -41.9% |
Src: SFIA, via Sports Business Daily, “2014 Trends in Team Sports,” August 10, 2015
Press release for the 2013 Trends in Team Sports available here
[no press releases for more recent reports]
Excerpt:
“Compared to 2011, which saw an increase in only 5 of the 24 sports, the surge in core participation in the most current U.S. Trends in Team Sports Report is proof of the growing trend of specialization in team sports. While there are more quality participants (core), the report also reveals the decrease in overall (casual) team sports participants over the last five years. Since 2008, team sports have lost 16.1 million participants or 11.1% of all team participants, measured by those who played at least once a year.”
2007 Edition excerpts
“While 31.6 million U.S. children (age 6-17) participate in team sports on a ‘frequent’, ‘regular’, or ‘casual’ basis, nearly 19 million U.S. children do not participate in team sports at all.”
…
“900,000 17-year olds played basketball in 2006 which means 17.9% of all 17-year olds played basketball in 2006.”
Src: SFIA. 2007. “U.S. Trends in Team Sports 2007 Edition.”
