

Smart Clothing and Fitness Devices
Summary
Smart clothing seems to be just around the corner, with several companies already selling specialty items (athletic wear, baby clothes, etc) embedded with sensors. However, quantitative forecasts describing the prevalence of smart clothing in the next 10 years or so are hard to find. Gartner made a forecast to 2016 back in 2014. Tractica has a forecast to 2020. Both forecasts describe millions of units shipped worldwide. Although it’s difficult to extrapolate market penetration, both reports suggest that smart clothing will be more prevalent than wearable devices. Other research firms and analysts are skeptical of such a swift uptake by smart garments, instead forecasting dominance by other wearable devices.
Research Excerpts
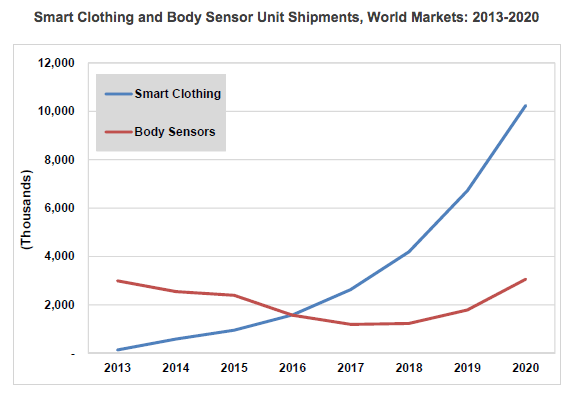
Tractica forecasts that smart clothing shipments will grow from 140,000 units in 2013 to 10.2 million units by 2020, while body sensor shipments will decrease from 3.0 million units in 2013 to 1.2 million by 2017, before rising again to 3.1 million units in 2020.
Src:
Tractica. May 4, 2015. “The Wearable Devices Market is Poised for Expansion into Smart Clothing and Body Sensors.”
Executive Summary
Chart from above report:
[via Global Information]
*
| Worldwide Wearable Electronic Fitness Devices Shipments (millions of units) | ||||
| Device Category | 2013 | 2014 | 2015 | 2016 |
| Smart Wristband | 30 | 20 | 17 | 19 |
| Sports Watch | 14 | 18 | 21 | 24 |
| Other Fitness Monitor | 18 | 20 | 12 | 15 |
| Chest Strap | 11 | 12.1 | 8 | 7.3 |
| Smart Garment | 0.01 | 0.1 | 10.1 | 26 |
| Total Market | 73.01 | 70.2 | 68.1 | 91.3 |
Src:
Gartner. November 18, 2014. “Gartner Says in 2015, 50 Percent of People Considering Buying a Smart Wristband Will Choose a Smartwatch Instead.”
Note: Angela McIntyre, Gartner research director – gave an interview to The Guardian. Might be available for comment.
*
Growth will be “largely driven by the sales of wrist-based trackers, while hundreds of thousands of connected garments used by professional sports teams showcase wearable technology’s most advanced capabilities.” Hundreds of thousands of thousands of connected garments is hardly a drop in the ocean compared to the millions of Fitbits, Xiaomis, Apple Watches, Jawbones and other devices which will be coining in the revenue by 2020. [emphasis mine]
Src:
James Stables. November 18, 2015. “Juniper Report Skeptical on Smart Clothing but Says Fitness Trackers are Set to Soar.” Wearable.com.
*
In our latest smart glasses report, we expect over 3 million smart glasses to be in use in enterprise by 2018, with nearly 6 million users. [worldwide, I think]
Src:
Juniper Research. 2015. “The World In 2020 – A Technology Vision.”
Note: The White paper seems to be referring to this paid research report.
*
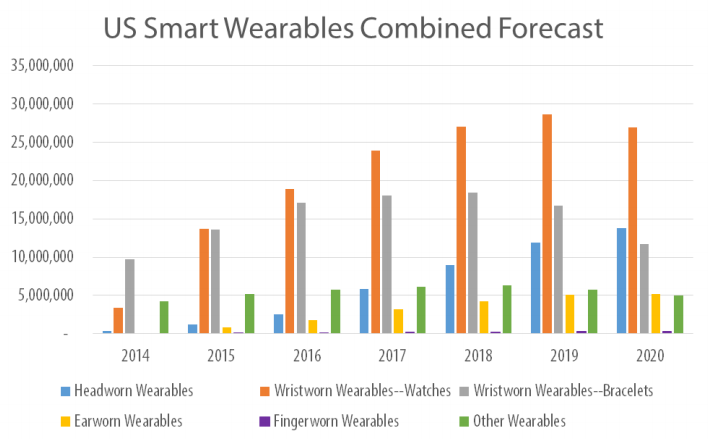
The US market for wearables is forecast to evolve more quickly than worldwide, leading to a peak of 68.3 million units in 2019, then dropping to 62.9 million in 2020.
Smart watches will be the top category as of this year in the US, followed by smart bands/bracelets.
In 2020, headworn wearables are expected to become the number two segment.
Src:
Bob O’Donnell. May 2015. “The Slow Build: Smart Wearables Forecast, 2014-2020.” Technalysis Research.
Note: This report does not include clothing with embedded sensors. Bob O’Donnell is skeptical of the ability of smart clothing to surpass other wearables in the foreseeable future.
Sick Days and Chronic Illness
I consulted a few different sources of information for illness statistics. The Bureau of Labor Statistics has a very small sample of sick-leave used data (for 2009). Gallup and Healthways also have a small sample of sick-leave data (for 2012). No forecasts are available. Several think tanks are tracking reported rates of chronic illness. A couple forecasts are available. Results are summarized below.
Sick Days
In 2012, researchers from the Bureau of Labor Statistics conducted a one-time tabulation of sick leave provision and usage. The data used were compiled from the 2009 National Compensation Survey, looking only at full-time workers in private industry.
The researchers averaged the amount of sick leave used in each of 6 industry areas (financial activities; information industry; trade, transportation, and utilities; professional and business services; leisure and hospitality; construction). In the first four of those industries, workers used an average of 4 days of sick leave per year. In the last two industries (leisure and hospitality, and construction), workers used an average of 2 days of sick leave per year.
This was a one-time tabulation. Jason Ford says by email that he’s not aware of any forecasts. To his knowledge, additional years of this data are not available.
Src:
Ross O. Barthold, Jason L. Ford. 2012 February 29. “Paid Sick Leave: Prevalence, Provision, and Usage among Full-Time Workers in Private Industry.” Bureau of Labor Statistics.
*
2012 survey data of workers in 14 job categories found that usage of sick days ranged from 6 days per year to 3 days per year. The survey was conducted by Gallup and Healthways as part of Healthways’ annual Well-Being Index report. The survey was administered to 94,000 Americans who work at least 30 hours per week.
Days missed per month
Physicians: .24
Farmers, Foresters, Fishers: .25
Construction or Mining: .28
Installation/Repair: .35
Sales: .35
Managers/Executives: .36
Professionals: .37
Manufacturing/Production: .38
School Teacher: .39
Transportation: .40
Business Owners: .41
Nurses: .43
Clerical or Office Workers: .44
Service Workers: .47
Note: 24/7 Wall St. performed the analysis of data collected by Gallup-Healthways. Emailed Healthways (9/25) to see if they’re still collecting this data.
Src:
Michael B. Sauter, Samuel Weigley and Alexander E.M. Hess. 2013 May 9. “Workers Taking the Most Sick Days.” 24/7 Wall St.
Well-Being Index
Gallup and Healthways have compiled their Well-Being Index annually since 2008. It’s a “barometer of Americans’ perceptions of their well-being.” The index is compiled based on survey responses to questions about six areas of life: life evaluation, emotional health, work environment, physical health, healthy behavior, basic access.
Physical Health Index
2008 76.9
2009 76.6
2010 76.9
2011 76.7
2012 77.0
2013 76.4
The Physical Health Index is comprised of questions related to: Body Mass Index, disease burden, sick days, physical pain, daily energy, history of disease, and daily health experiences.
Overall Well-Being Score
2008 66.5
2009 66.3
2010 66.8
2011 66.2
2012 66.7
2013 66.2
Over the six years of our well-being measurement, Americans’ life evaluations have improved, emotional health and healthy behaviors have remained stable, and basic access, physical health, and work environment have declined. While there are dozens of trends that have impacted the national score since 2008, the three most prominent ones are:
* Annual decreases in the rate of those with health insurance;
* Rising rates of obesity;
* Declining work environment scores.
Src:
Gallup-Healthways Well-Being Index. 2014. “State of American Well-Being.”
Chronic Disease Rates
In 2008, The Milken Institute found that one third of Americans reported having at least one of seven common chronic diseases, with a total of 162.2 million cases in 2003. They forecasted a 42% increase in cases of those diseases by 2023, for a total of 230.7 million cases.
Of the seven chronic diseases, pulmonary conditions were the most common, with 49.2 million cases recorded. Next in prevalence were hypertension, with 36.8 million recorded cases, and mental disorders, with 30.3 million; followed by heart disease at 19.2 million; diabetes at 13.7 million; cancer at 10.6 million; and stroke at 2.4 million.
Src:
Ross DeVol, Armen Bedroussian. 2007. “An Unhealthy America: The Economic Burden of Chronic Disease.” Milken Institute.
*
In 2009, almost half of Americans, 145 million people, had at least one chronic condition. This represented an increase of 10 million people over the estimate that was made in 2002 for the year 2009.
The number of people with chronic conditions reached 125 million in 2000, forecast to reach 147 million by 2010 and 157 million by 2020. By 2030 half the population will have one or more chronic conditions.
Src:
2010. “Chronic Care: Making the Case for Ongoing Care.” Robert Wood Johnson Foundation.
*
Prevalence of Chronic Disease in the U.S. Population
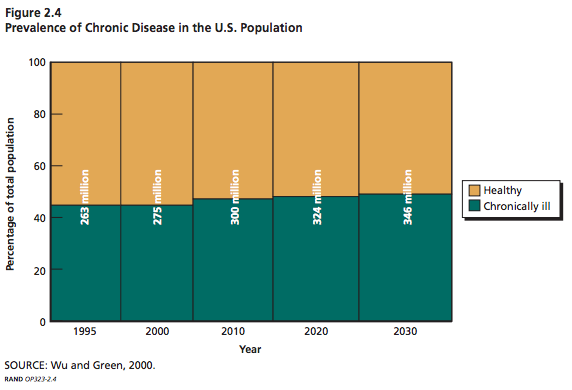
Millions of Americans
Src: Wu, Shin-Yi and Anthony Green. Projection of Chronic Illness Prevalence and Cost Inflation. RAND Corporation; October 2000. (unavailable online)
Cited in:
Soeren Mattke, Lisa Klautzer, Tewodaj Mengistu, et al. 2010. “Health and Well-Being in the Home.” RAND Corporation.
and
The Marshall Protocol Knowledge Base. 2012. “Incidence and Prevalence of Chronic Disease.” Autoimmunity Research Foundation.
