WeatherSpark
Weather data visualization
WeatherSpark is a website that has changed how I look at the weather. Like most other weather sites it provides a local forecast based on a variety of data sources including NOAA (there are international data sources for those outside the US). Unlike some other sites, like Weather Underground or Weather.com, WeatherSpark is built on the idea that the user should control what data is displayed using either real-time data or historical trends.
The user interface, while at times overwhelming in the number of options it provides, is straight forward and very useful. You can quickly expand or reduce your date range from hourly to daily to weekly to monthly and even to years. While this may not seem particularly useful on a daily basis, it is incredibly useful when planning trips and events in the future (and while it won’t predict the weather, the historic trends are useful for having a “best guess” of what the weather will be like).
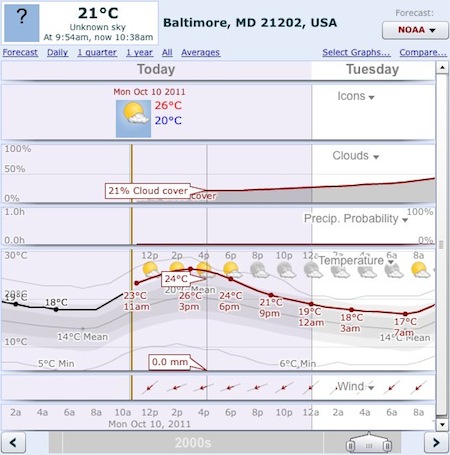
Not only can you control the timeline, but you can also toggle maps (with radar), text-based weather reports, and climate trends. They offer a plethora of graphed weather variables including dew point, wind direction, precipitation amount, precipitation rate, humidity, sun rise/set, and pressure among others. For those people who just want to know if it’s going to rain, the level of customizability in the data visualization will be overkill. Conversely, this site may not be hardcore enough for weather nerds more interested in data mining than visualization.
For me, WeatherSpark has proven to be a powerful tool, and one I use on a weekly basis to assist my environmental intelligence. I’ve used it to compare precipitation amounts and average night time temperature in multiple locations in order to predict mushroom fruiting patterns (and I imagine if I were a gardener it would be just as indispensable for starting beds). Not only that, but my fiancée and I are now using it to pick a date for our outdoor wedding in Wisconsin in order to minimize the chance of a washout (or heat wave). For those interested in digging a little bit deeper into weather systems, I can’t recommend WeatherSpark strongly enough.
10/10/11Excerpt
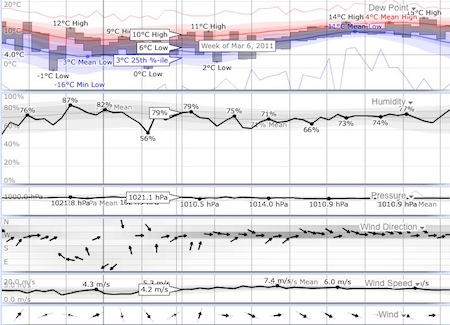
The diversity of weather variables that one can graph is impressive, and made even more useful by little things like the clever icons used to indicate wind direction.
WeatherSpark http://weatherspark.com