Day: February 20, 2022
 02/20/22
Science fiction watchables/Electjet Apollo Ultra/The Mental Health Update
Recomendo: issue no. 292
02/20/22
Recomendo: issue no. 292


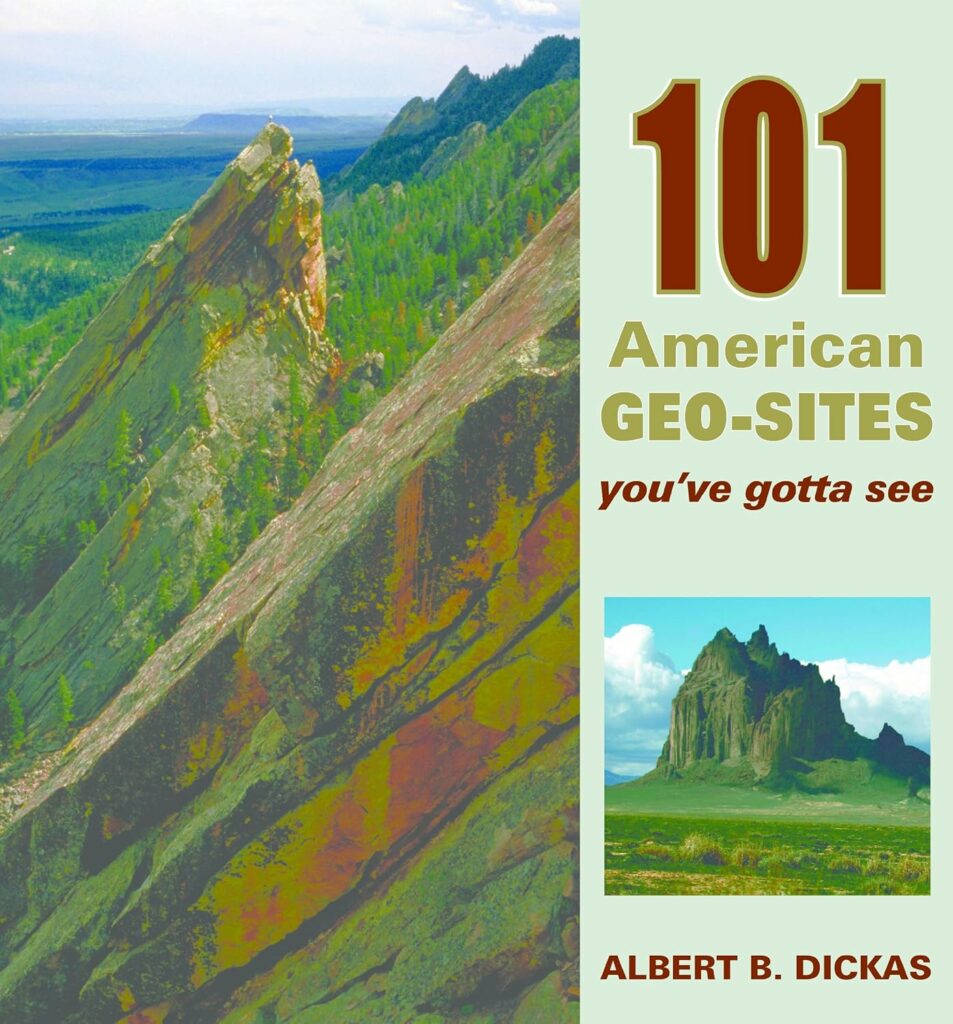
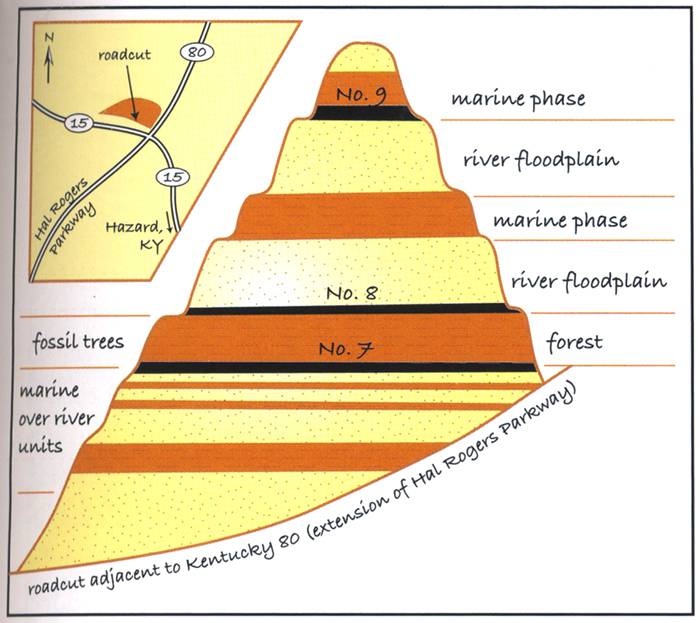
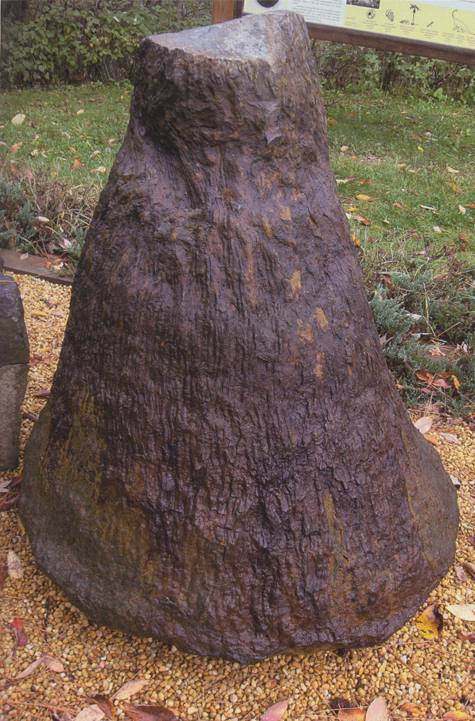
101 American Geo-Sites You’ve Gotta See
This will change your vacation plans. Visit your home planet! Geology is a force so huge we don’t see it. Yet evenly spread across the US (at least one in each state) are spots where our planetary behavior is made visible, erupting in either grand spectacle or in tiny gems on the ground. I was briefly a geology major in school, so call me geeky: but what bigger vacation can one imagine that inspecting 101 sites where you can see inside the Earth? A surprising number of US national, state, and county parks are dedicated to geologic power points. Other spots may be roadcuts or river beds. Use this guide to find them and interpret their incredible hidden significance. — KK
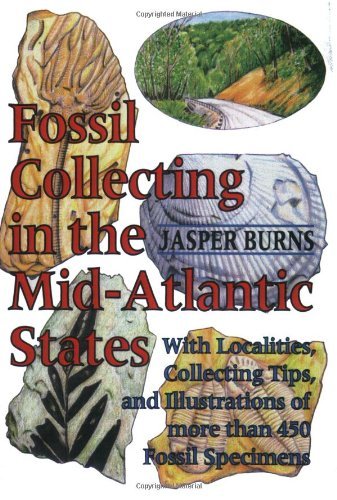
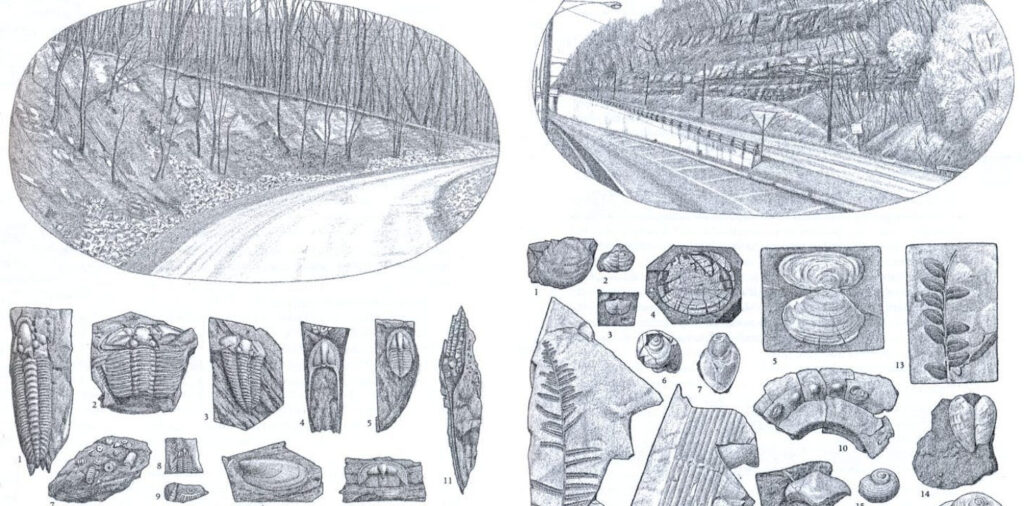
Fossil Collecting in the Mid-Atlantic States
The only thing wrong with this field guide is that it is restricted to the Mid-Atlantic States. It gives very specific driving directions (alas, no GPS coordinates) to easily accessible sites where one can collect small fossils. And each site and its ancient bounty is depicted in lovely sketches. I wish all guides books were like this. — KK
Once a week we’ll send out a page from Cool Tools: A Catalog of Possibilities. The tools might be outdated or obsolete, and the links to them may or may not work. We present these vintage recommendations as is because the possibilities they inspire are new. Sign up here to get Tools for Possibilities a week early in your inbox.

© 2022
