

education
Education
Summary
This collection of data includes the following indicators, dates, and sources:
teachers: preschool-postsecondary, special ed, career, 2014/2024, BLS
teachers: elementary & secondary, public and private schools, 1955-2023, BLS & NCES
teachers: public charter schools, 1999-2012, NCES
pupil/teacher ratios: elementary & secondary, 1955-2023, NCES
enrollment: elementary & secondary, public & private, 1955-2023, NCES
enrollment: public charter schools, 1999-2012 (NCES)
enrollment: homeschooled K-12 students, 1999/2003/2007/2012, NCES
enrollment: postsecondary and postbac, public and private, 1947-2025, NCES
ed attainment: high school graduates, public and private, 1869-2024, NCES
ed attainment: GED test-passers (and takers), 1971-2013, NCES
ed attainment: degrees conferred, 1869-2024, NCES
ed attainment: % high school dropouts, 1960-2014, NCES
school numbers: elementary public & private, 1980-2013 & 1869-2013, NCES
school numbers: secondary public & private, 1980-2013 & 1869-2013, NCES
school numbers: public charter, 1980-2013, NCES
school numbers: colleges public, private & community, 1980-2013, NCES
online courses/MOOCs, 2002-2014, Babsen & NCES
presence of arts in education, 1999/2009, NCES
Findings
Teachers and Ratios
BLS Occupational Outlook 10-year forecasts for teachers
| Number and Change in Teaching Jobs | |||
| Type | 2014 total | increase by 2024 | % change |
| Preschool | 441,000 | +29,600 | 7%, as fast as average |
| K & Elementary | 1,517,4000 | +87,800 | 6%, as fast as average |
| Middle School | 627,500 | +36,800 | 6%, as fast as average |
| High School | 961,600 | +55,900 | 6%, as fast as average |
| Special Ed. | 450,700 | +28,100 | 6%, as fast as average |
| HS Equiv. | 77,500 | +5,500 | 7%, as fast as average |
| Postsecondary | 1,313,000 | +177,000 | 13%, faster than average |
| Career & Tech | 231,800 | +10,200 | 4%, slower than average |
Src:
Bureau of Labor Statistics. Accessed July 18, 2016.
Occupational Outlook Handbook. US Department of Labor.
“Preschool Teachers”
“Kindergarten and Elementary School Teachers”
“Middle School Teachers”
“High School Teachers”
“Special Education Teachers”
“Adult Literacy and High School Equivalency Diploma Teachers”
“Postsecondary Teachers”
“Career and Technical Education Teachers”
*
Since 1991, The National Center for Education Statistics has annually issued a report of ~10-year forecasts called “Projections of Education Statistics.” Here are excerpts from the most recent set of forecasts.
Figure 6: Actual and projected numbers for elementary and secondary teachers, by control of school: Fall 1998 through fall 2023 (p.10)
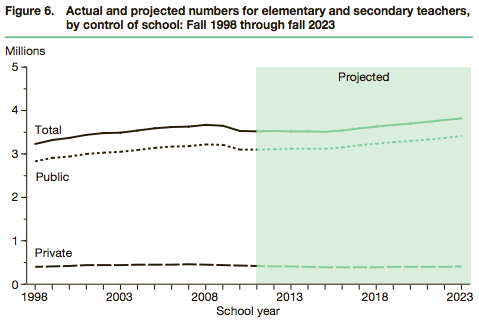
The total number of elementary and secondary teachers:
* increased 9 percent between 1998 and 2011, a period of 13 years; and
* is projected to increase 8 percent between 2011 and 2023, a period of 12 years.
The number of teachers in public elementary and secondary schools:
* increased 10 percent between 1998 and 2011; and
* is projected to increase 10 percent between 2011 and 2023.
The number of teachers in private elementary and secondary schools:
* was 5 percent higher in 2011 than in 1998; and
* is projected to be 3 percent lower in 2023 than in 2011.
Figure 7: Actual and projected numbers for the pupil/teacher ratios in elementary and secondary schools, by control of school: Fall 1998 through fall 2023 (p.11)
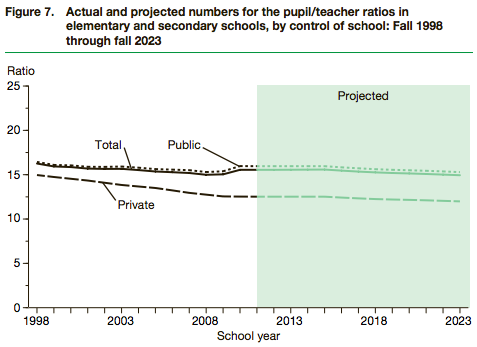
Table 8: Public and private elementary and secondary teachers, enrollment, pupil/teacher ratios, and new teacher hires: Selected years, fall 1955 through fall 2023 (p.48).
TO DO: EXTRACT DATA FROM THIS TABLE.
src:
National Center for Education Statistics. April 2016.
“Projections of Education Statistics to 2023.”
contact: William J. Hussar, William.Hussar@ed.gov
Previous projections are available here.
Enrollment
Figure 1: Actual and projected numbers for enrollment in elementary and secondary schools, by control of school: Fall 1998 through fall 2023. (p.5)
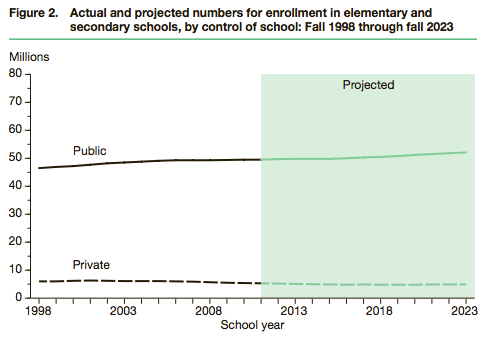
Enrollment in public elementary and secondary schools:
* increased 6 percent between 1998 and 2011; and
* is projected to increase 5 percent between 2011 and 2023.
Enrollment in private elementary and secondary schools:
* decreased 12 percent between 1998 and 2011; and
* is projected to be 7 percent lower in 2023 than in 2011.
Table 1: Enrollment in educational institutions, by level and control of institution: Selected years, 1869–70 through fall 2023 (p.35)
TO DO: EXTRACT DATA FROM THIS TABLE.
NOTE: THIS DATA (THROUGH 2025) ALSO APPEARS TO BE IN AN [HTML TABLE WITH AN EXCEL DOWNLOAD OPTION]
Figure 16: Actual and projected numbers for total enrollment in all postsecondary
degree-granting institutions: Fall 1998 through fall 2023 (p.24)
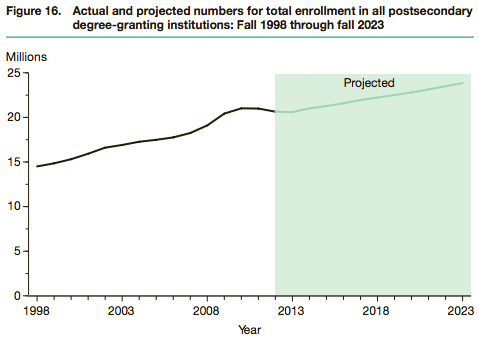
Total enrollment in postsecondary degree-granting institutions:
* increased 42 percent from 1998 to 2012, a period of 14 years; and
* is projected to increase 15 percent, to 24 million, from 2012 to 2023, a period of 11 years.
TO DO: EXTRACT DATA FROM TABLE 13 (data avail 1947-2023) (P. 54-55).
Figure 20: Actual and projected numbers for enrollment in all postsecondary degree-granting institutions, by level of degree: Fall 1998 through fall 2023 (p.26)
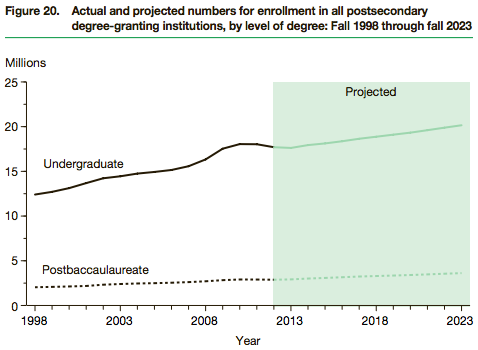
Enrollment of undergraduate students in postsecondary degree-granting institutions:
* increased 43 percent between 1998 and 2012; and
* is projected to increase 14 percent between 2012 and 2023.
Enrollment of postbaccalaureate students in postsecondary degree-granting institutions:
* increased 41 percent between 1998 and 2012; and
* is projected to increase 25 percent between 2012 and 2023.
TO DO: EXTRACT DATA FROM TABLES 16 AND 17 (data avail 1967-2023) (P.60-62).
Figure 22: Actual and projected numbers for enrollment in all postsecondary degree-granting institutions, by control of institution: Fall 1998 through fall 2023 (p.27).
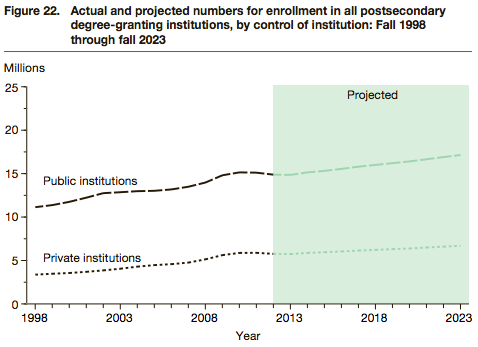
Enrollment in public postsecondary degree-granting institutions:
* increased 34 percent between 1998 and 2012; and
* is projected to increase 15 percent between 2012 and 2023.
Enrollment in private postsecondary degree-granting institutions:
* increased 71 percent between 1998 and 2012; and
* is projected to increase 16 percent between 2012 and 2023.
[Data back to 1947 avail in Table 13.]
src:
National Center for Education Statistics. April 2016.
“Projections of Education Statistics to 2023.”
contact: William J. Hussar, William.Hussar@ed.gov
*
Table 216.30: Number and percentage distribution of public elementary and secondary students and schools, by traditional or charter school status and selected characteristics: Selected years, 1999-2000 through 2013-14
TO DO: EXTRACT DATA FROM THIS TABLE
src:
National Center for Education Statistics. Accessed July 18, 2016.
Digest of Education Statistics: 2014.
“Table 216.30”
AND
Digest of Education Statistics: 2015
“Table 216.30”
*
Table 206.10: Number and percentage of homeschooled students ages 5 through 17 with a grade equivalent of kindergarten through 12th grade, by selected child, parent, and household characteristics: 2003, 2007, and 2012
TO DO: EXTRACT DATA FROM THIS TABLE
src:
National Center for Education Statistics. Accessed July 18, 2016.
Digest of Education Statistics: 2014.
“Table 206.10”
This NCES article gives a figure for homeschooled students in 1999 having been 0.9 million (1.7%).
Educational attainment
Table 9: High school graduates, by sex and control of school: Selected years, 1869–70 through 2023–24 (p.49).
TO DO: EXTRACT DATA FROM THIS TABLE.
Table 21: Degrees conferred by degree-granting postsecondary institutions, by level of degree and sex of student: Selected years, 1869–70 through 2023–24
TO DO: EXTRACT DATA FROM THIS TABLE (P.66).
src:
National Center for Education Statistics. April 2016.
“Projections of Education Statistics to 2023.”
contact: William J. Hussar, William.Hussar@ed.gov
*
Table 219.60: Number of people taking the general educational development (GED) test and percentage distribution of those who passed, by age group: 1971 through 2013
TO DO: EXTRACT DATA FROM THIS TABLE.
src:
National Center for Education Statistics. Accessed July 18, 2016.
Digest of Education Statistics: 2014.
“Table 219.60.”
*
Table 219.70: Percentage of high school dropouts among persons 16 to 24 years old (status dropout rate), by sex and race/ethnicity: Selected years, 1960 through 2014
TO DO: EXTRACT DATA FROM THIS TABLE.
src:
National Center for Education Statistics. Accessed July 18, 2016.
Digest of Education Statistics: 2015.
“Table 219.70.”
Number of Schools
Table 105.50: Number of educational institutions, by level and control of institution: Selected years, 1980-81 through 2013-14
Includes: elementary, secondary (and combined), and postsecondary schools
TO DO: EXTRACT DATA FROM THIS TABLE.
Note: Data for 1980-2000 is decadal, data for 2003-2013 is annual.
src:
National Center for Education Statistics. Accessed July 18, 2016.
Digest of Education Statistics: 2015.
“Table 105.50: Number of educational institutions, by level and control of institution: Selected years, 1980-81 through 2013-14.”
Data for 2001 and 2002 are available from NCES here.
*
Table 214.10: Number of public school districts and public and private elementary and secondary schools: Selected years, 1869-70 through 2013-14
TO DO: EXTRACT DATA FROM THIS TABLE.
src:
National Center for Education Statistics. Accessed July 18, 2016.
Digest of Education Statistics: 2015.
“Table 214.10”
*
EMAILED WILLIAM HUSSAR 7/19/16 TO INQUIRE ABOUT PROJECTIONS FOR NUMBER OF SCHOOLS.
UPDATE 7/20: HUSSAR CONFIRMS THAT NCES DOES NOT PRODUCE A PROJECTION FOR THIS, AND IS UNAWARE OF ANY OTHER SOURCE THAT DOES.
Online Courses
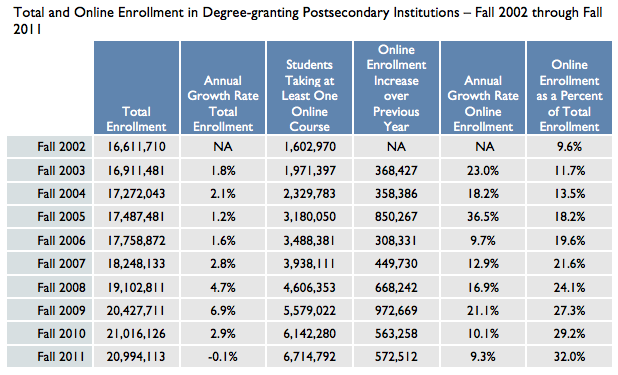
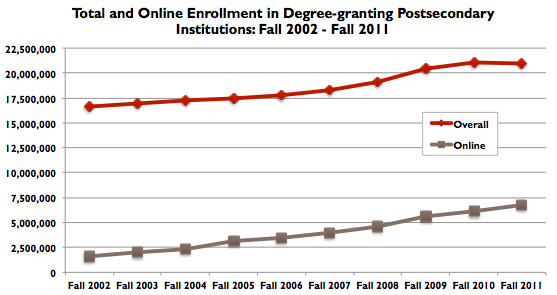
Total and Online Enrollment in Degree-granting Postsecondary Institutions – Fall 2002 through Fall 2011
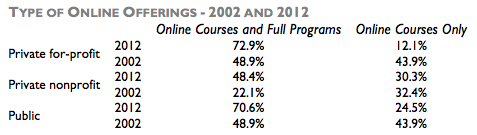
Percent of Postsecondary Institutions With Some Form Of Online Offering – 2002 and 2012
src:
Babson Survey Research Group. January 2013.
“Changing Course: Ten Years of Tracking Online Education in the United States”
contact:
I. Elaine Allen, Jeff Seaman
bsrg@babson.edu
*
Starting in 2014, Babsen started using enrollment data from NCES’s Integrated Postsecondary Education Data System (IPEDS) in its reports. IPEDS has collected data on distance education enrollments since fall 2012.
The previous Babsen measure of “online offerings” had a broader definition than the IPEDS definition. Babsen included any offering of any length to any audience at any time. IPEDS only included classes taken by students enrolled in a degree program, excluding non-credit courses, continuing education courses, courses for alumni, and courses for students not registered for a degree program.
Changes in Distance Enrollments
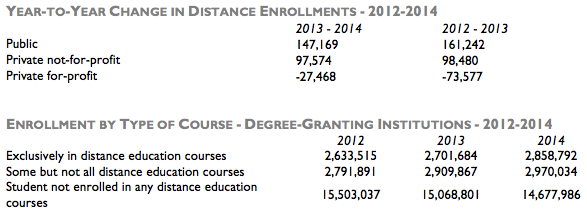
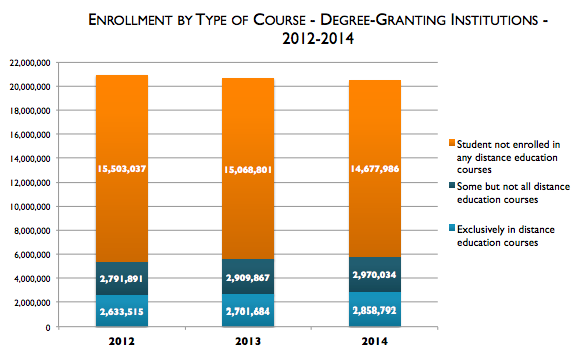
Enrollment By Type Of Course – Degree-Granting Institutions – 2012-2014
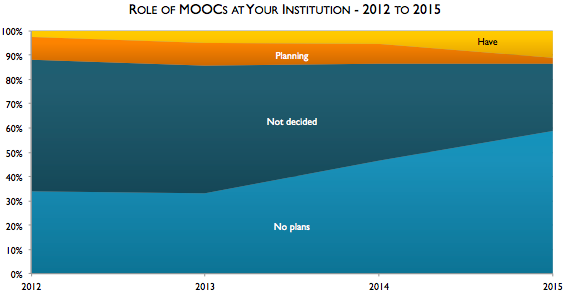
MOOCs seem to be plateauing.
Note: although MOOCs share a number of characteristics with distance courses, they have several key differences. Those participating are no registered students at the school; they are designed for unlimited participation and open access via the web — no tuition is charged; there is typically no credit given for completion of the MOOC.
Excerpt:
The number of institutions that report that they either have or are planning a Massive
Open Online Course (MOOC) has remained relatively steady. In 2012 12.0% of
institutions fell in this category (2.6% offering a MOOC, and 9.4% with plans to offer
them). In 2013, the number increased to 14.3% (5.0% offering a MOOC and 9.3%
planning). Results for 2014 saw this drop a bit to 13.6% (8.0% offering a MOOC
and 5.6% planning). This year’s results follow this same pattern; 11.3% reporting
that they have a MOOC, and an additional 2.3% are planning one, for the same
13.6% total as last year.
Only a small portion of higher education institutions are engaged with MOOCs, and
adoption levels seem to be plateauing. The total number of institutions reporting a
current or planned MOOC remained stable in 2015. While the fraction of institutions
engaged in MOOCs may be relatively small, these does not mean that the number of
students impacted is also small. With many MOOCs having enrollments in the
thousands, or even higher, the number of students touched by a MOOC can easily
match that of those taking distance education courses.
Role Of Moocs At Your Institution – 2012 To 2015
src:
Babson Survey Research Group and Quahog Research Group. February 2016.
“Online Report Card: Tracking Online Education In The United States.”
contact:
I. Elaine Allen, Jeff Seaman
bsrg@babson.edu
TO DO: ASK BABSEN WHO IS TRACKING MOOC TAKERS AND OTHER ONLINE LEARNERS NOW THAT THEY’RE USING THE NARROWER IPEDS DATASET.
Arts Education
1999 vs. 2009
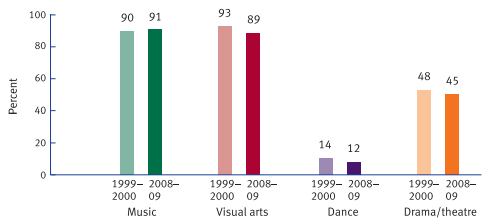
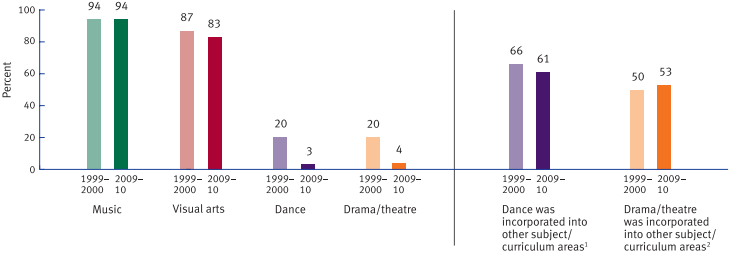
Figure 1
Percent of public elementary schools reporting instruction designated specifically for various arts subjects and percent incorporating dance and drama/theatre into other subject or curriculum areas: School years 1999–2000 and 2009–10
More detailed data are provided in supplemental tables 1, 12, 128, and 139.
Figure 4
Percent of public secondary schools reporting whether various arts subjects were taught at the school: School years 1999–2000 and 2008–09
More detailed data are provided in supplemental tables 70 and 154.
src:
National Center for Education Statistics. April 2012.
“Arts Education in Public Elementary and Secondary Schools: 1999-2000 and 2009-10.”
US Department of Education. Pp. 5, 9.
Predictions
The Hoover Institution published a series of essays predicting what the American primary and secondary education system might look like in 2030. Mostly qualitative.
src:
Hoover Institution, 2010
“American Education in 2030”
*
By 2030 over 50% of Colleges will Collapse
src: Thomas Frey, July 2015.
“By 2030 over 50% of Colleges will Collapse“
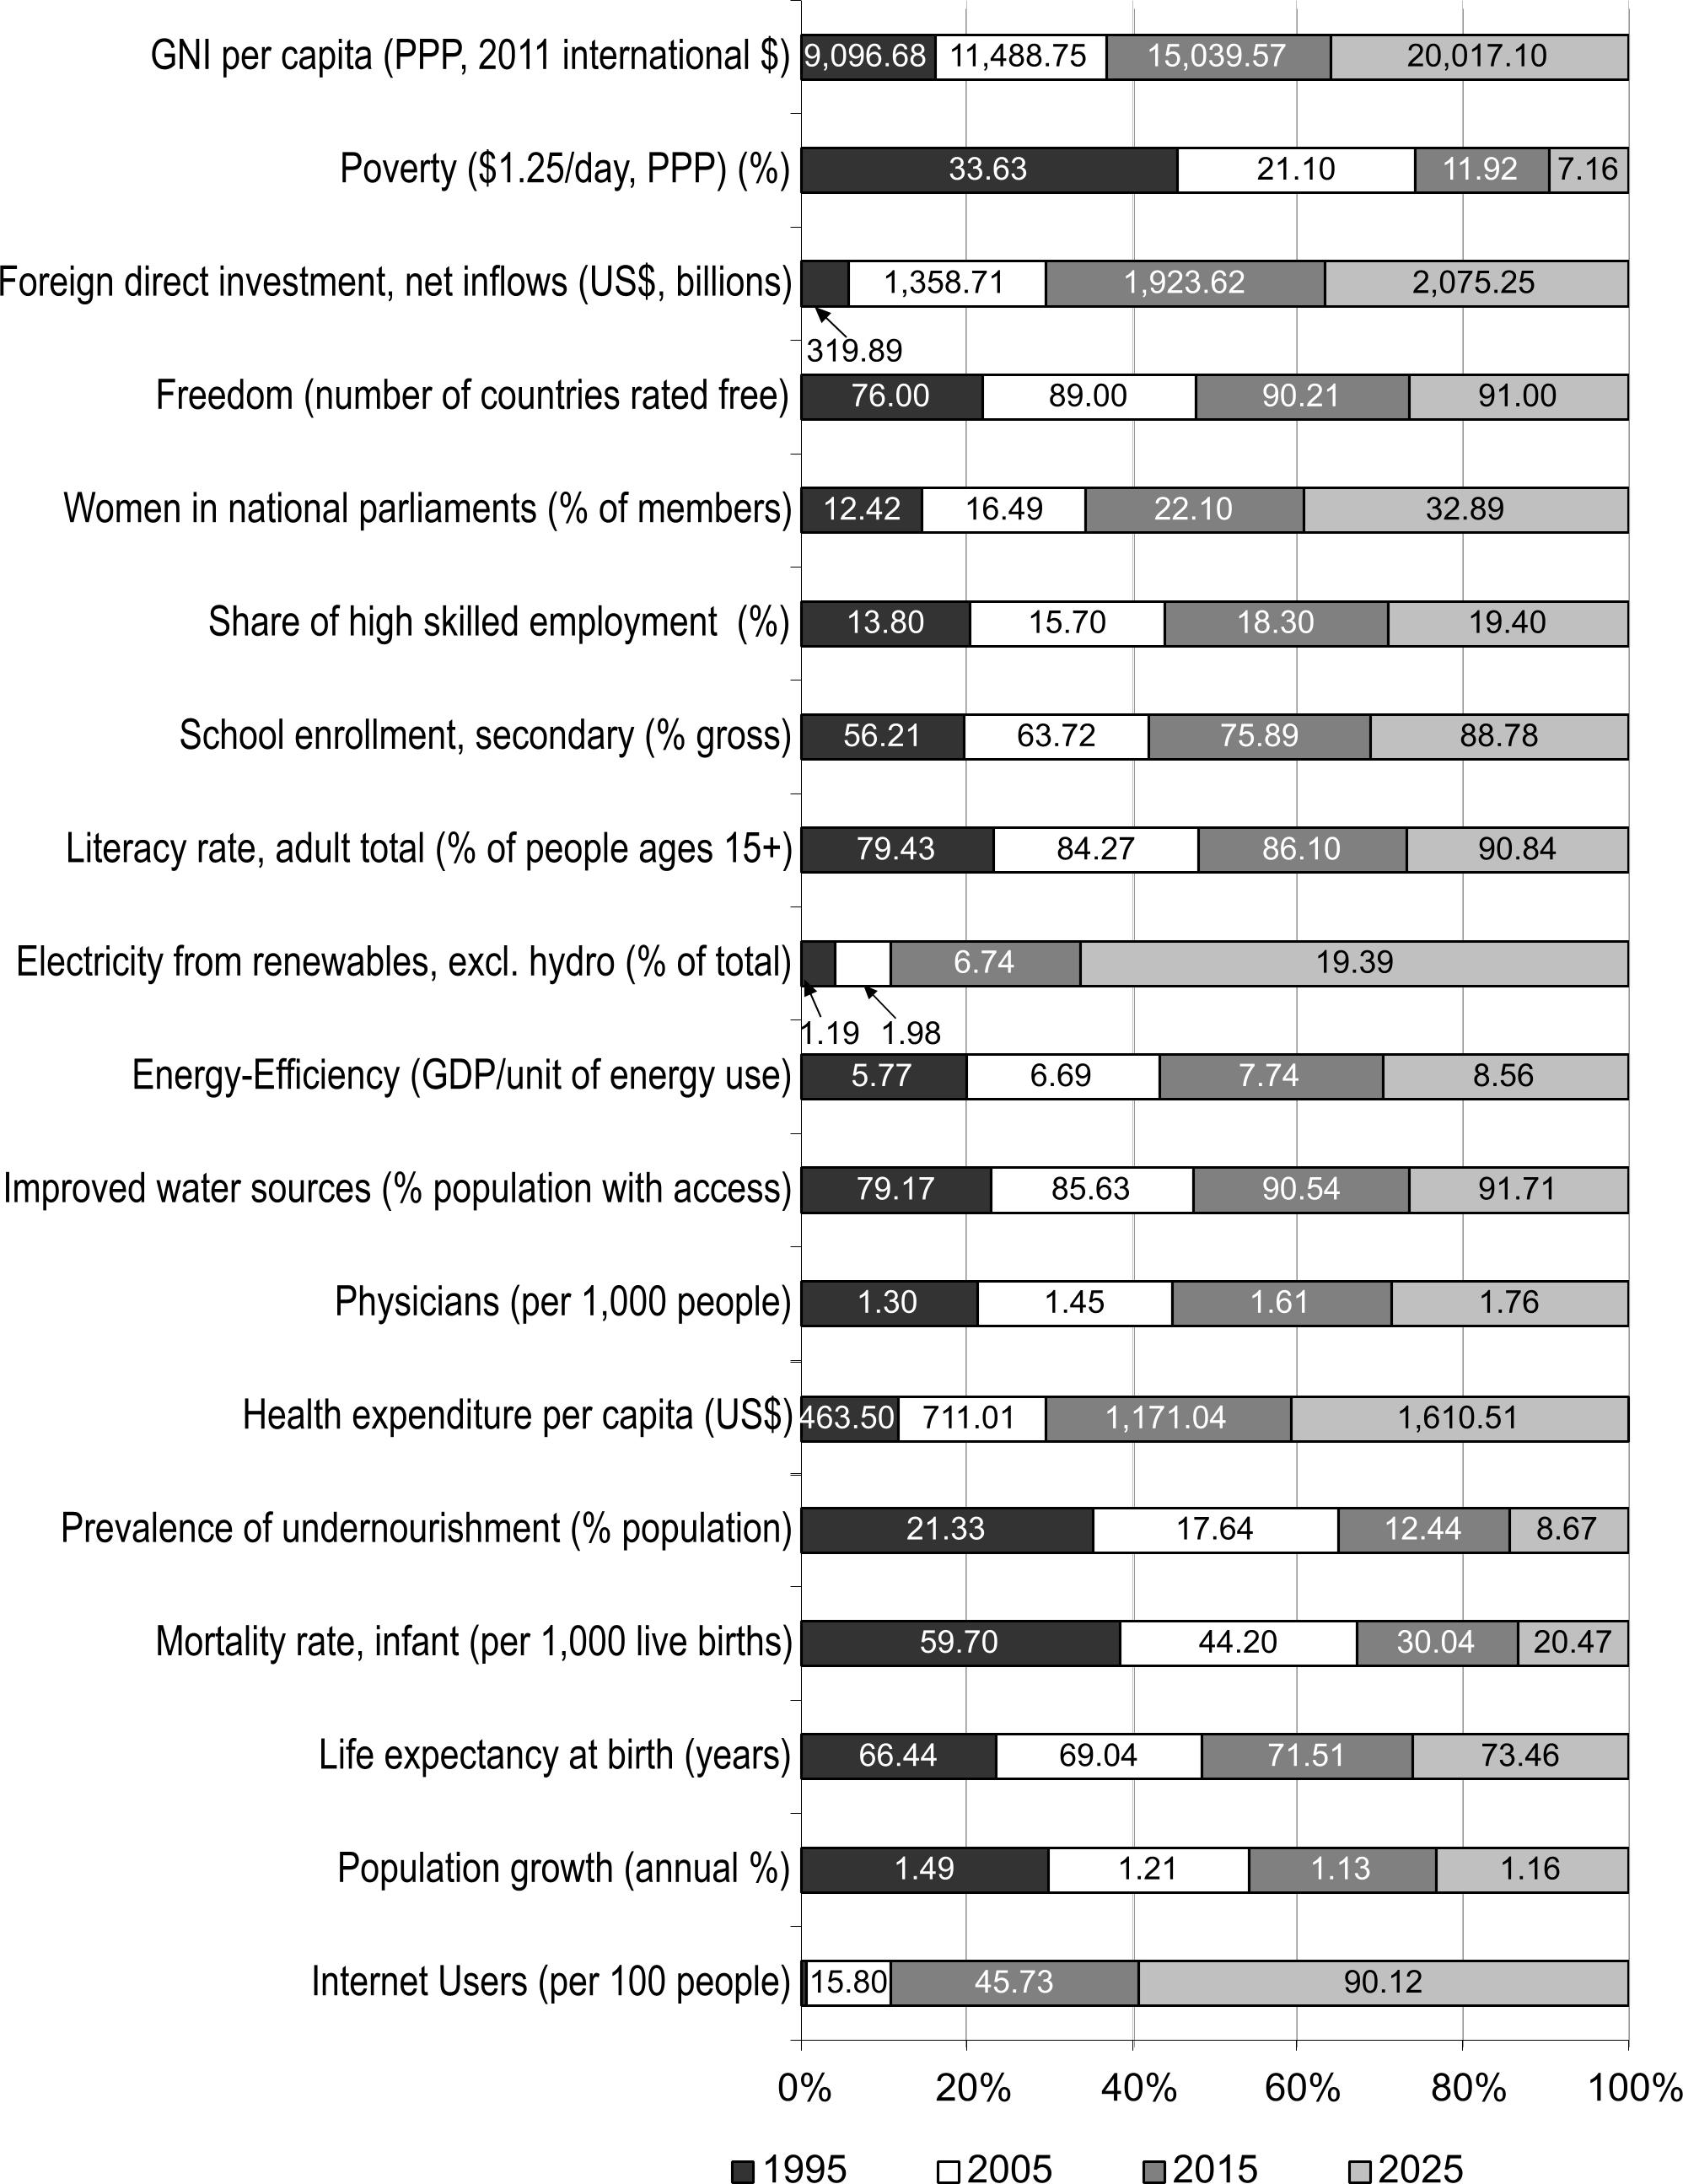
State of the Future Index (28 variables)
Every year, The Millennium Project (MP) computes a “State of the Future Index” looking 10 years into the future, based on data from the previous 20 or more years. The index calculation is based on values for multiple, individually-forecast key variables (28 in 2015). The index is calculated globally, as well as for individual countries. The overall index is intended to show the direction of things to come.
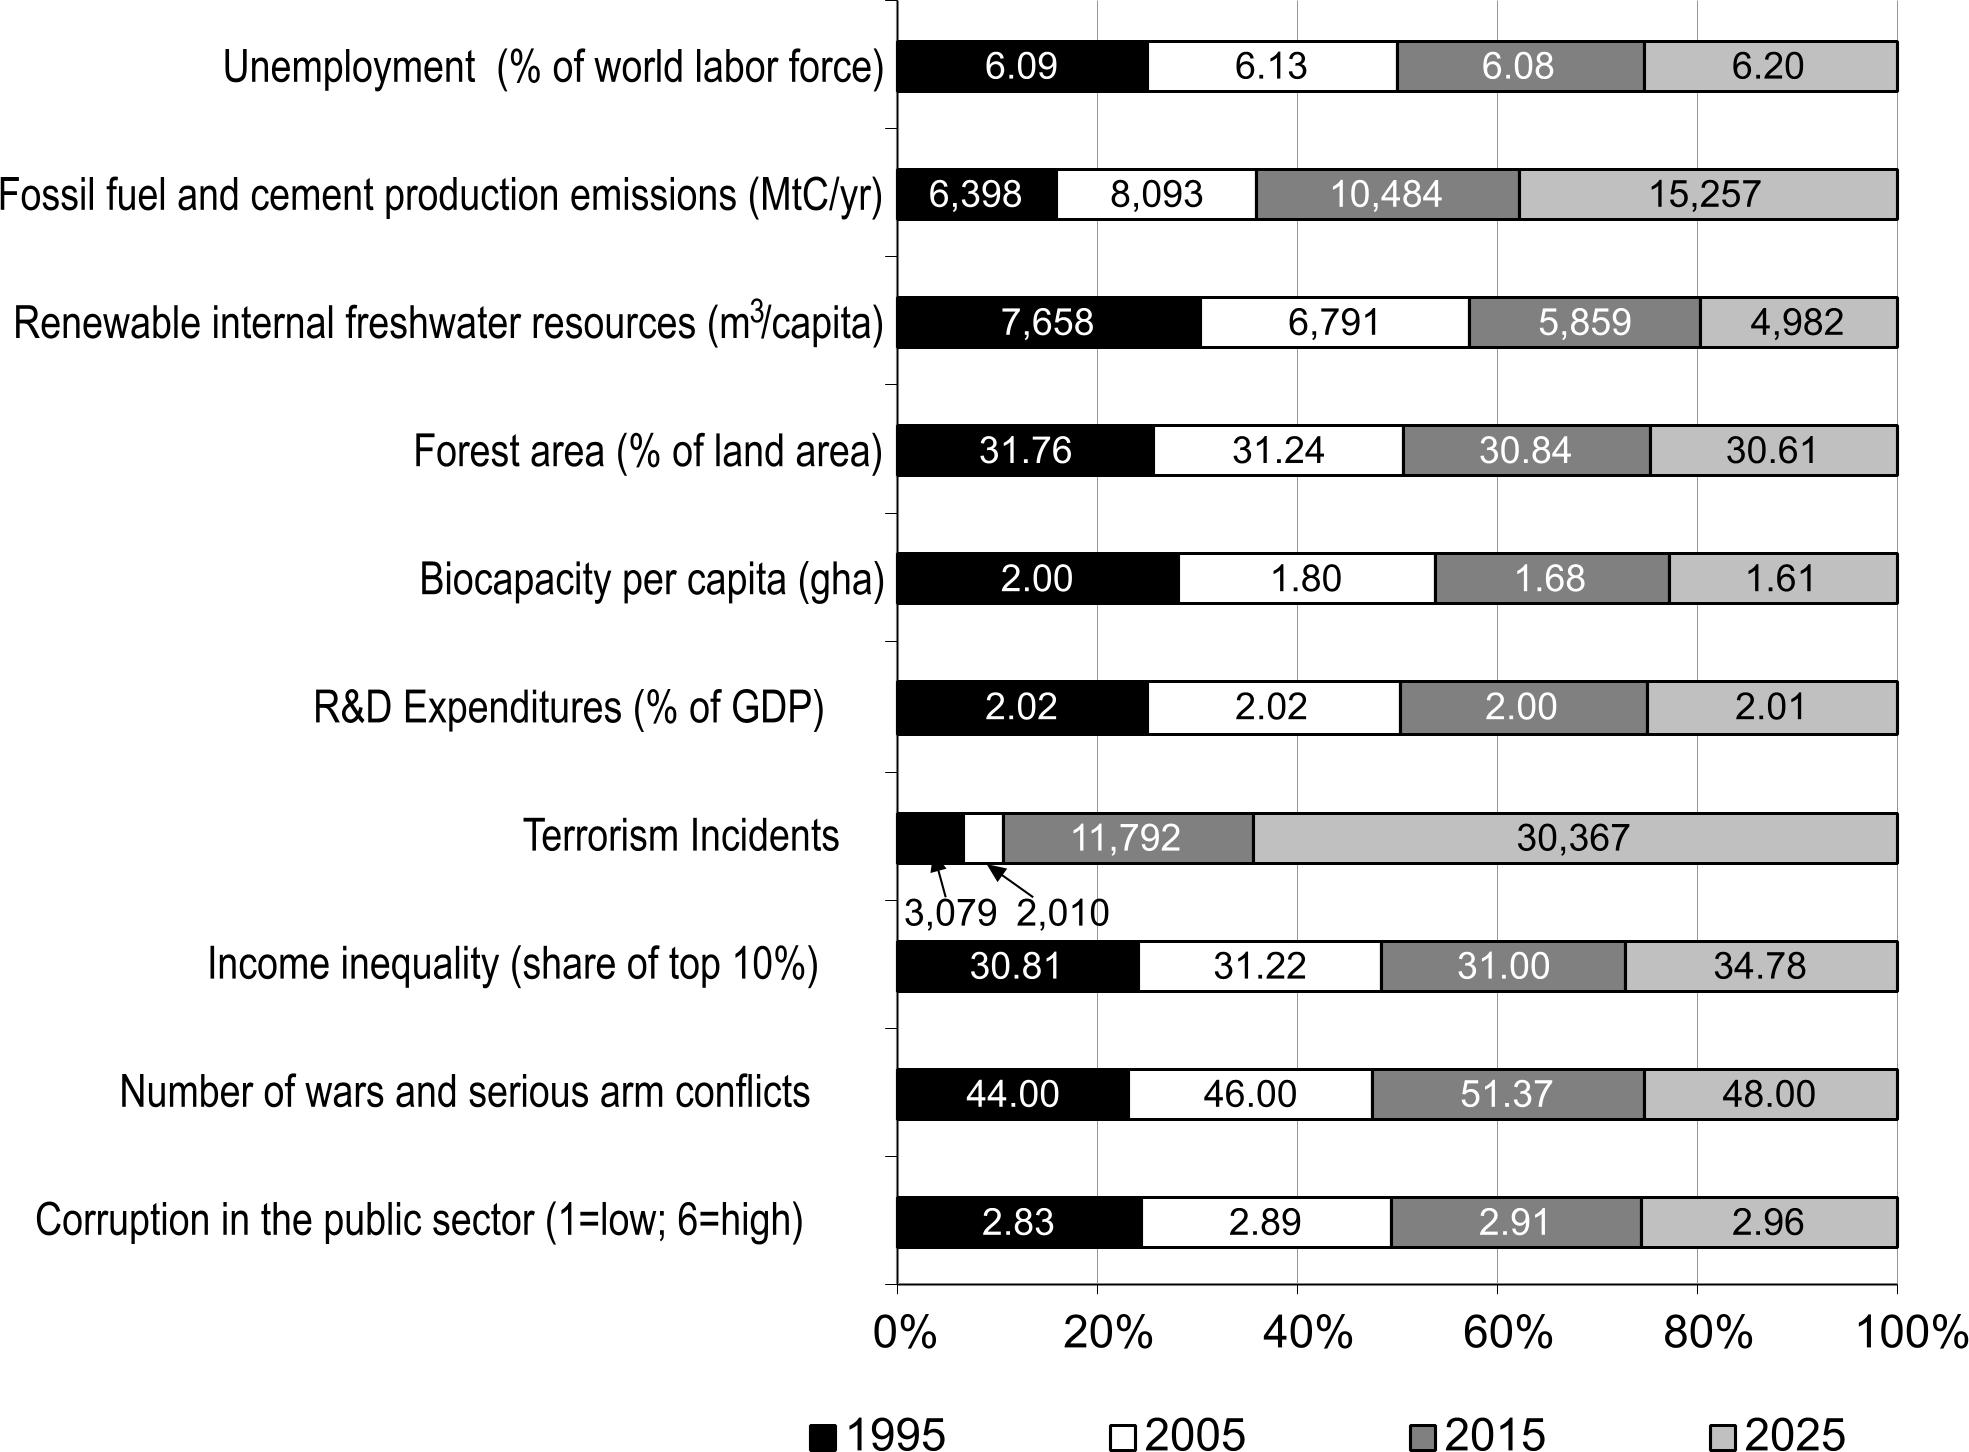
For our purposes the forecasts for the 28 individual variables are of most interest. MP breaks the variables into two groups: those showing improvement, and those showing decline. The values for the individual variables (previous actual, and forecast) are displayed within the shaded area of the charts.
Areas showing improvement in 2015:
Areas showing decline in 2015:
In 2015, the calculated Index looks like this:
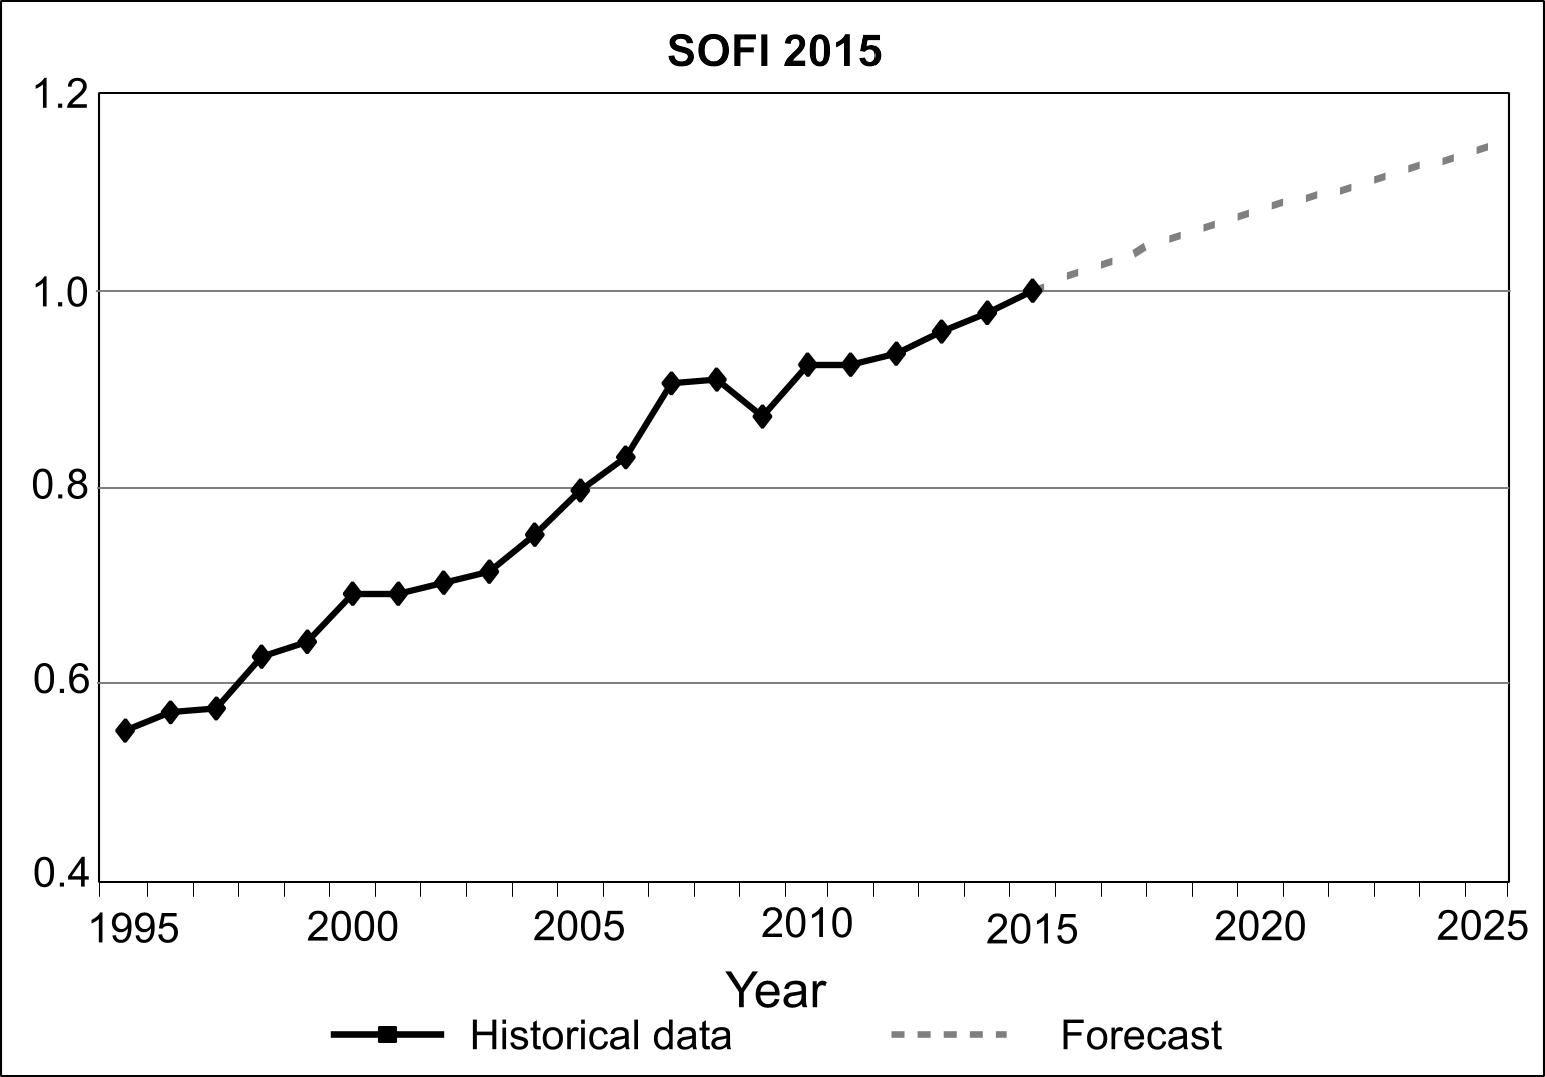
Src: Gordon, Theodore J. 2015. “2015 State of the Future Index.” The Millennium Project.
Charts for each indicator, and a brief indication of the source for the data are in this PDF.
The Millennium Project is an independent non-profit global participatory futures research think tank of futurists, scholars, business planners, and policy makers who work for international organizations, governments, corporations, NGOs, and universities. Their annual report collects and assesses judgments from over 3,000 people selected by its 56 nodes around the world.
