

State of the Future Index (28 variables)
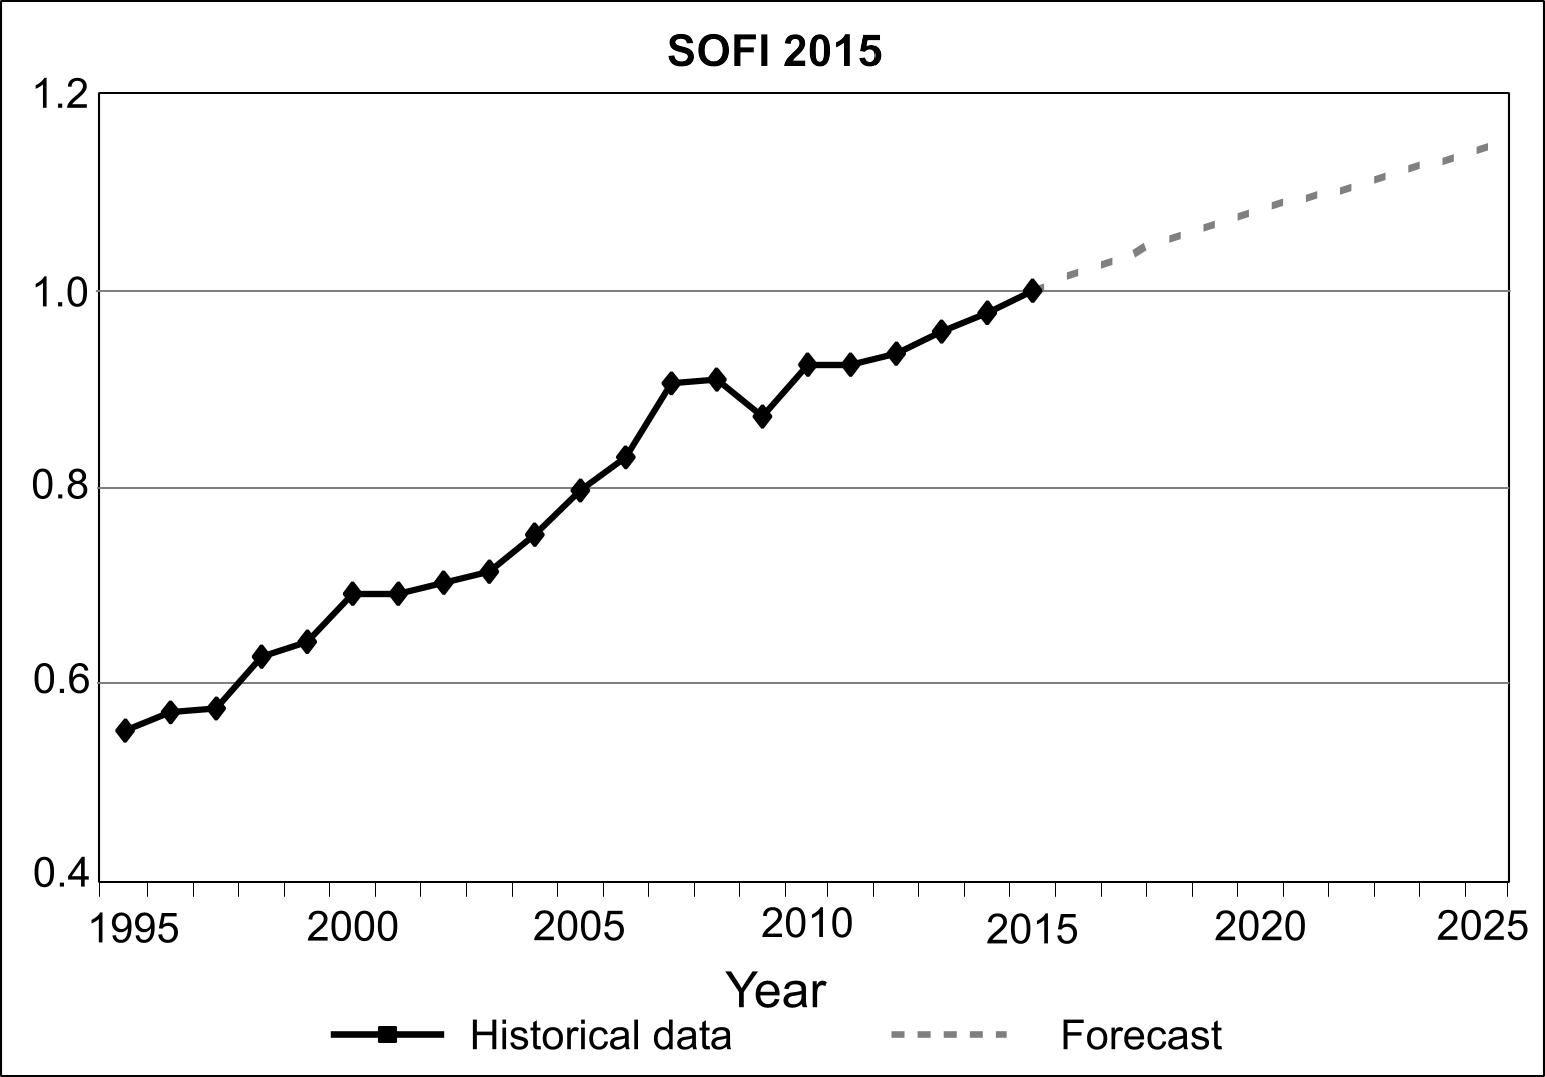
Every year, The Millennium Project (MP) computes a “State of the Future Index” looking 10 years into the future, based on data from the previous 20 or more years. The index calculation is based on values for multiple, individually-forecast key variables (28 in 2015). The index is calculated globally, as well as for individual countries. The overall index is intended to show the direction of things to come.
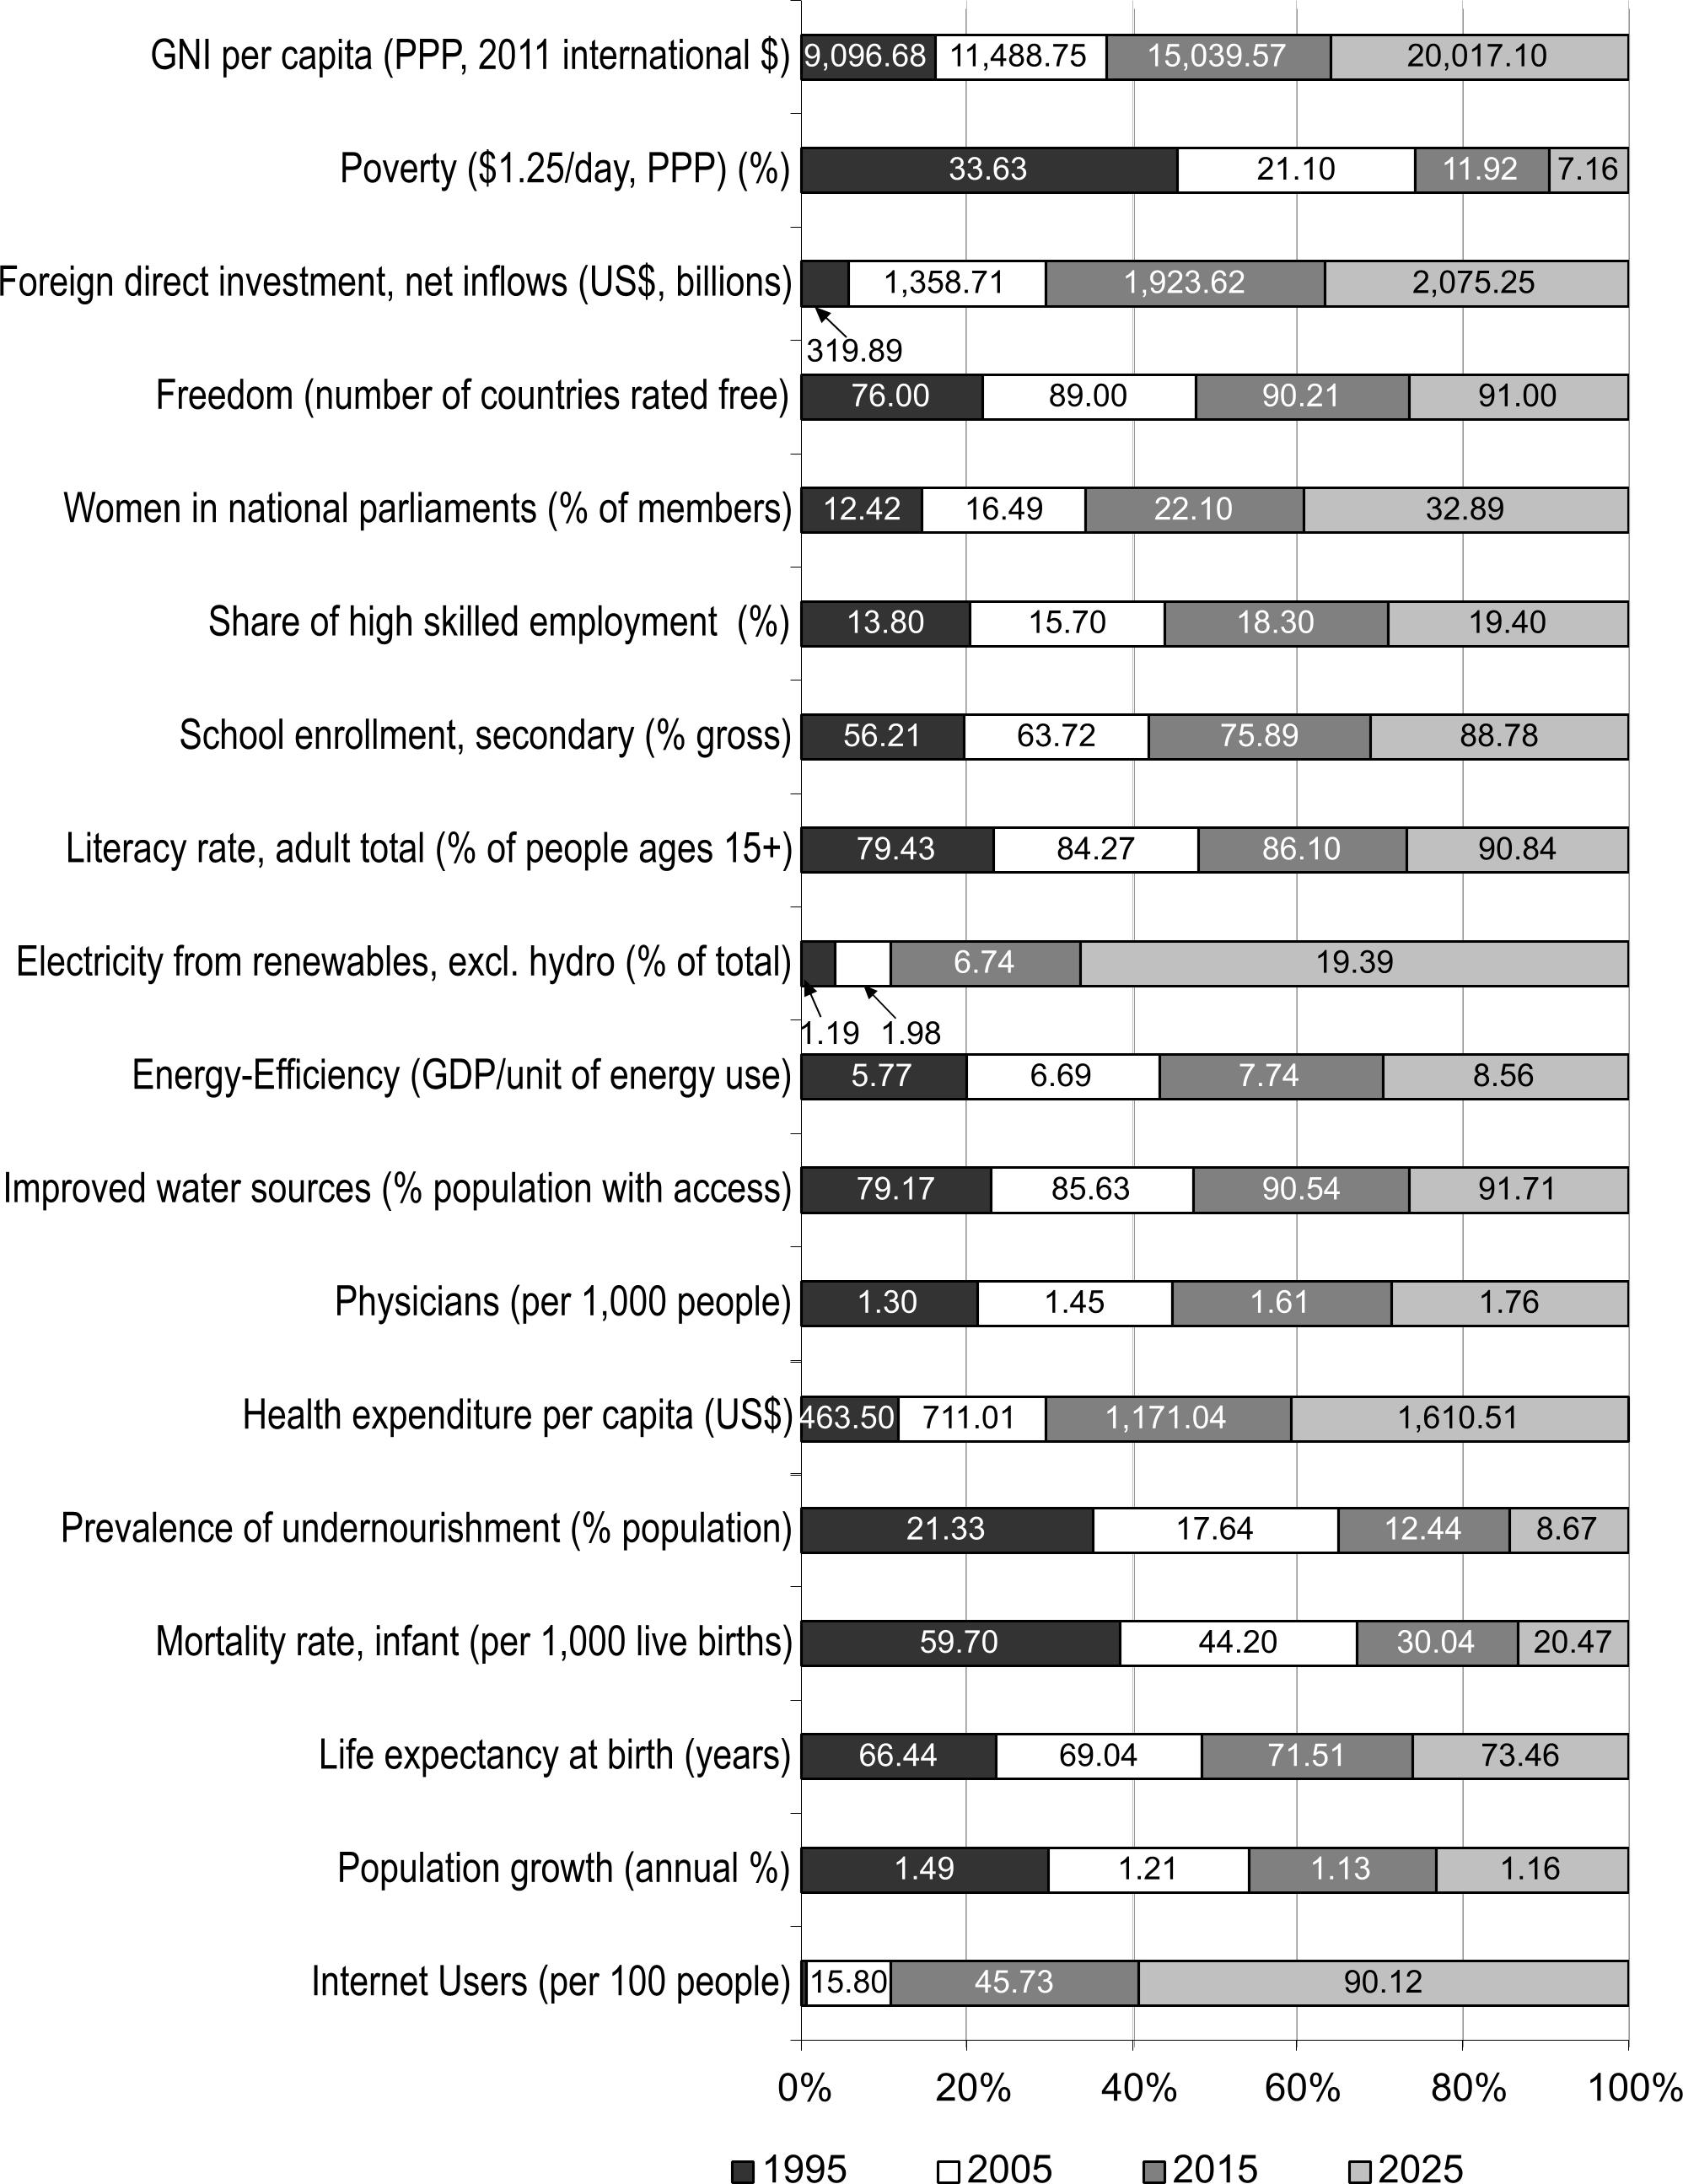
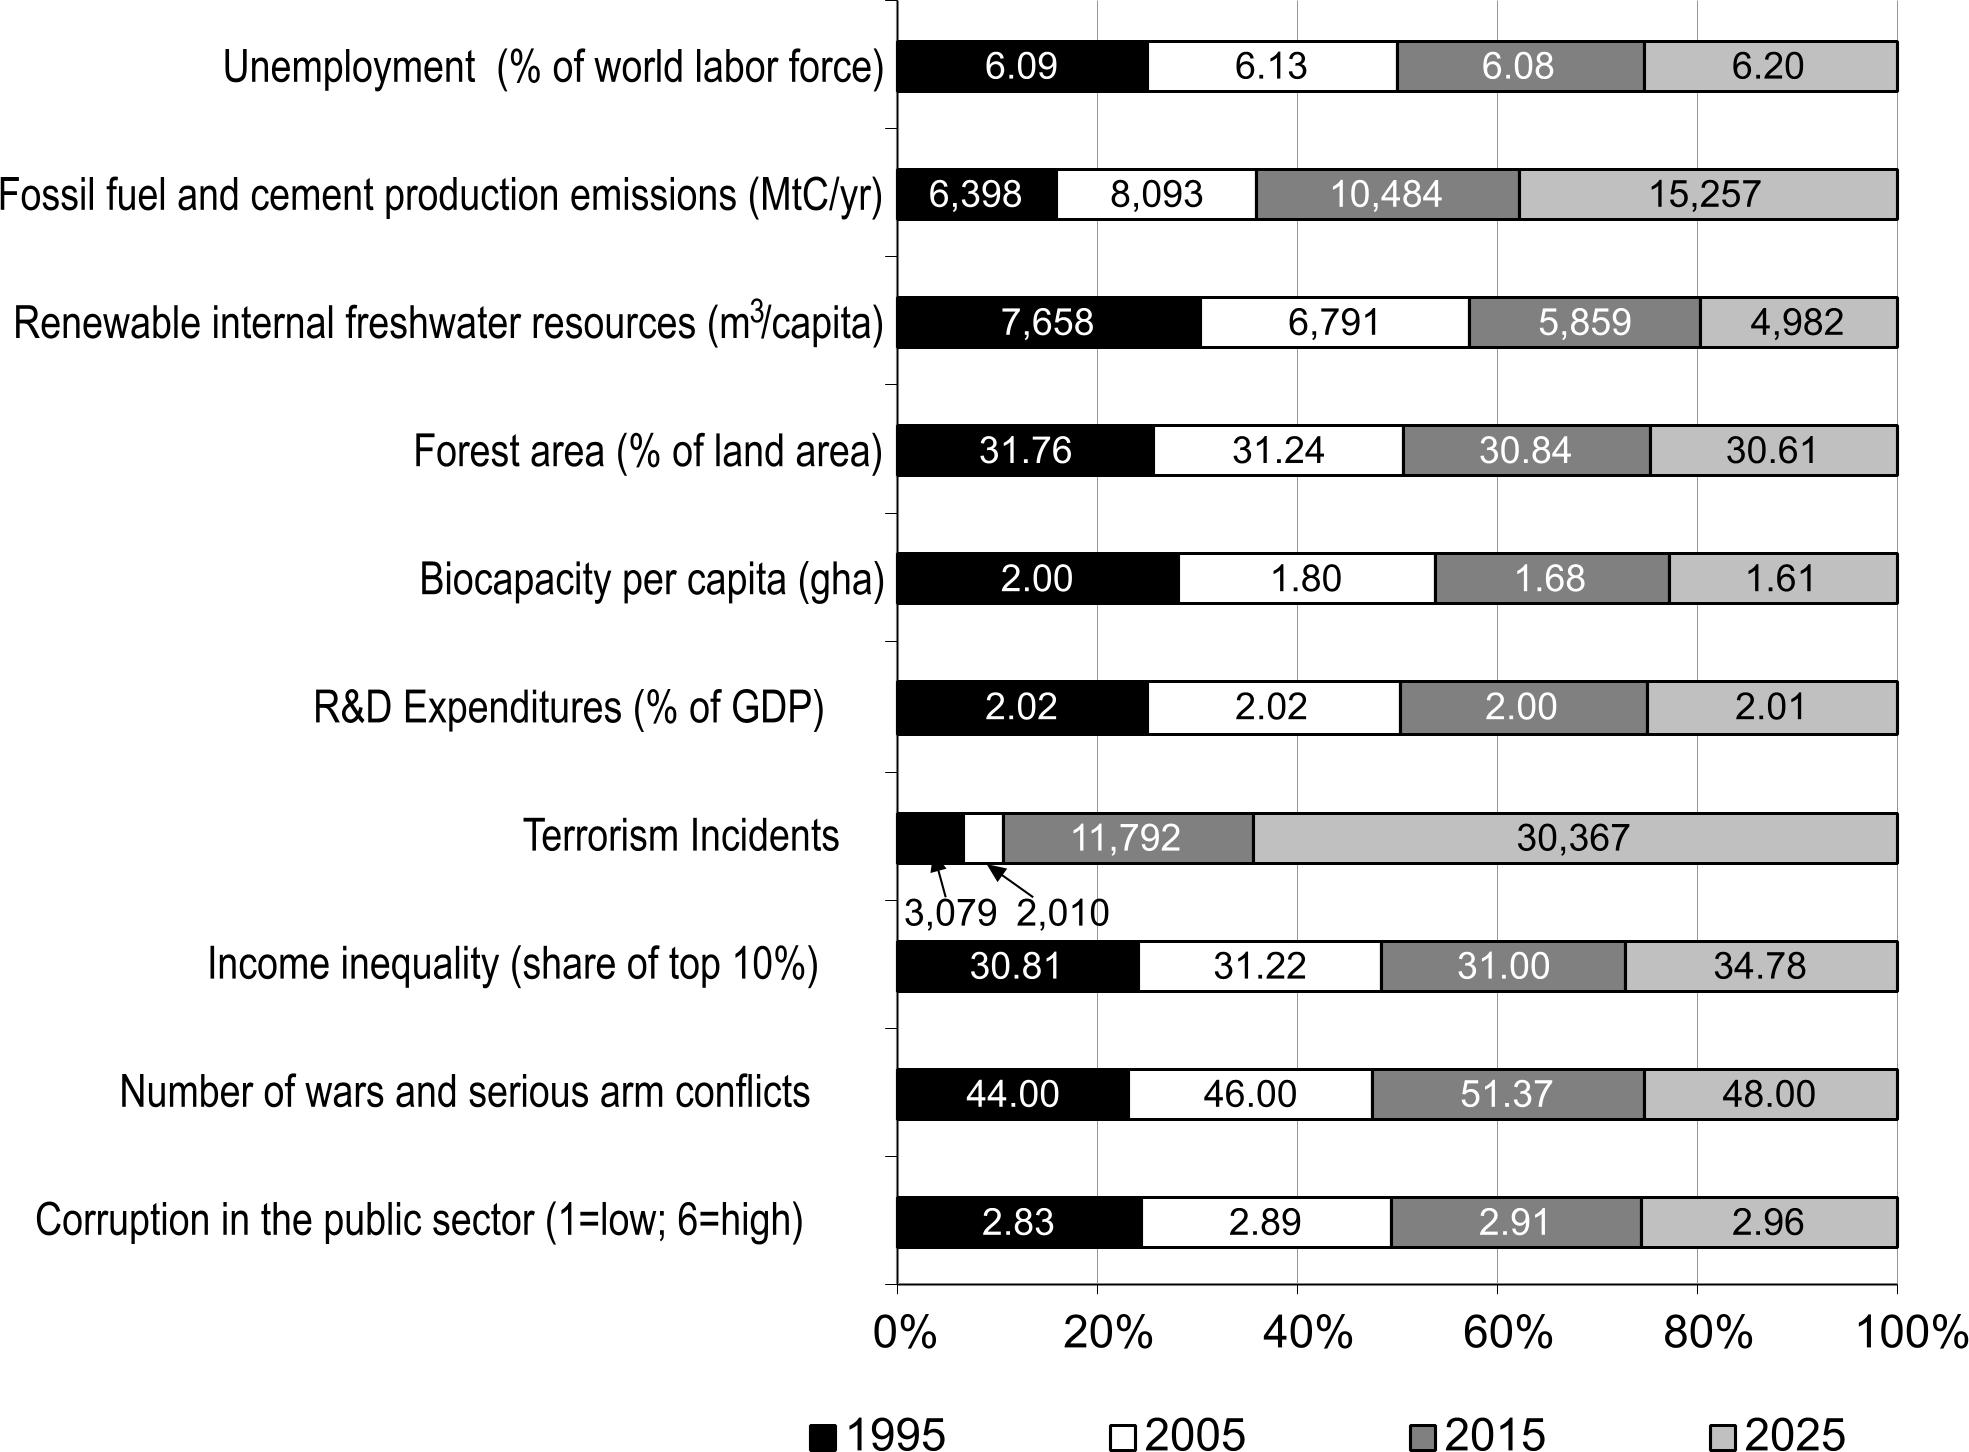
For our purposes the forecasts for the 28 individual variables are of most interest. MP breaks the variables into two groups: those showing improvement, and those showing decline. The values for the individual variables (previous actual, and forecast) are displayed within the shaded area of the charts.
Areas showing improvement in 2015:
Areas showing decline in 2015:
In 2015, the calculated Index looks like this:
Src: Gordon, Theodore J. 2015. “2015 State of the Future Index.” The Millennium Project.
Charts for each indicator, and a brief indication of the source for the data are in this PDF.
The Millennium Project is an independent non-profit global participatory futures research think tank of futurists, scholars, business planners, and policy makers who work for international organizations, governments, corporations, NGOs, and universities. Their annual report collects and assesses judgments from over 3,000 people selected by its 56 nodes around the world.
Unemployment Rates to 2050
As part of their 2015-16 State of the Future report (the 18th edition), The Millennium Project conducted a Future Work/Technology 2050 study. Using a Real-Time Delphi survey, the Project asked a panel of 300 experts the following question:
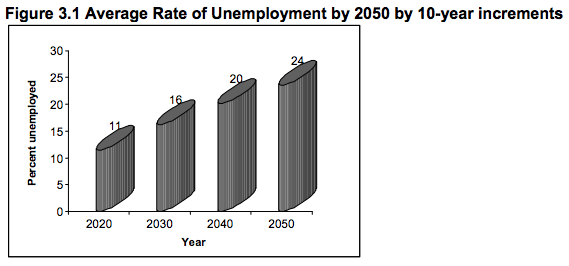
If socio-political-economic systems stay the same around the world, and if technological acceleration, integration, and globalization continue, what percent of the world do you estimate could be unemployed—as we understand being employed today—during each of the following years: 2020; 2030; 2040; 2050?
Their response:
The full chapter (including the responses to 9 other questions also asked of the expert panel) are available here:
Jerome C. Glenn, Elizabeth Florescu, et al. 2015. “Future Work/Technology 2050” in 2015-16 State of the Future.
The Executive Summary for the 2015-16 “State of the Future” report is here:
Jerome C. Glenn, Elizabeth Florescu, et al. 2015. “Executive Summary” in 2015-16 State of the Future.
