

Social Media Consumption: Extrapolations
ASK
Extrapolate to 2050:
Individual daily consumption of all media (web-based and traditional)
Individual daily consumption of social media
All Media
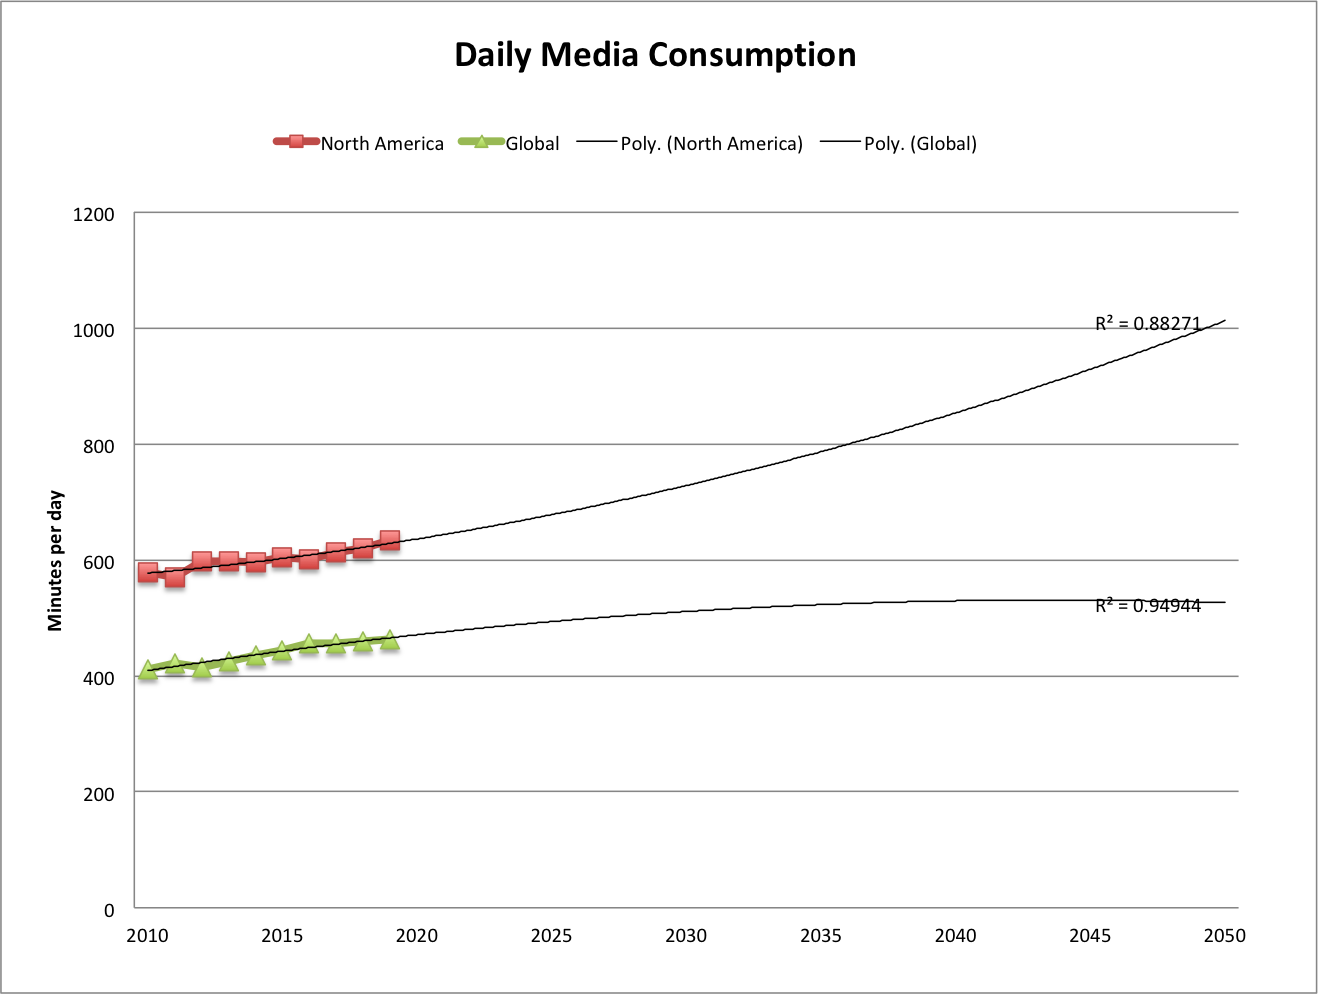
Zenith (a media agency) tracks this info on a global scale (I’ve not found other sources). They’ve only been publishing reports for the last four years, but I found a Recode article that interviews the head of forecasting at Zenith (Jonathan Barnard). This article provides historic data back to 2010, and forecasts to 2019, contrasting North America with the global average. The article was published in May 2017, and Zenith published a new report in 2018 with slightly different data for the last few years and looking forward, but the most recent report does not provide the context of the previous 10 years. For consistency of methodology, I’ve just used the data quoted by Recode for the following extrapolation.
[Excerpts from all four published Zenith reports are below, showing the yearly revision to their data. In summary, the estimates become more conservative with each subsequent report up until the latest report, which shows a jump again.]
[This and all extrapolations in this post in my file media-consump-forecast.xlsx]
src:
Recode, May 2017
“People consumed more media than ever last year — but growth is slowing”
figure: Average individual daily media consumption in minutes
citing Zenith (appears to be from their 2017 report, including historic data available not freely accessible).
*
Here are excerpts from the press releases for the annual “Media Consumption Forecasts” by Zenith.
From the 2018 Report:
2018: 479 minutes per day consuming media
12% more than in 2011
2020: 492 min/day
From the 2017 report:
2019: less than 1% growth
2017: same as 2016
2016: 456 min/day
2010: 411 min/day
From the 2016 report:
2018F:448 min/day
2015: 435 min/day
2010: 403 min/day
From the 2015 report:
2017F:506 min/day
2015: 492 min/day
2014: 485.3 min/day
2010: 461.8 min/day
***
Social Media
eMarketer and Statista both provide estimates of daily social media consumption. The eMarketer figures cover the US, and the Statista figures are global.
Upon first inspection of the data, the Statista figures seem to be roughly 3X higher than eMarketer’s figures, a disparity that does not agree with my understanding of the variation by country (see We Are Social chart below). I’m quite confident that Statista’s data actually comes from marketing firm Global Web Index, and their recent report (which does not include all the historic info available at Statista) makes frequent passing reference to the increasing amount of time users are watching video on social platforms. In reading various qualitative discussions of social media use, I find many sources group YouTube and Facebook minutes of use together under the social category.
When eMarketer’s social and video minutes are combined, they come in closer range to Statista’s figures, so I believe this is a good rough approximation.
Here’s the extrapolation for both eMarketer (combined social and video) and Statista:
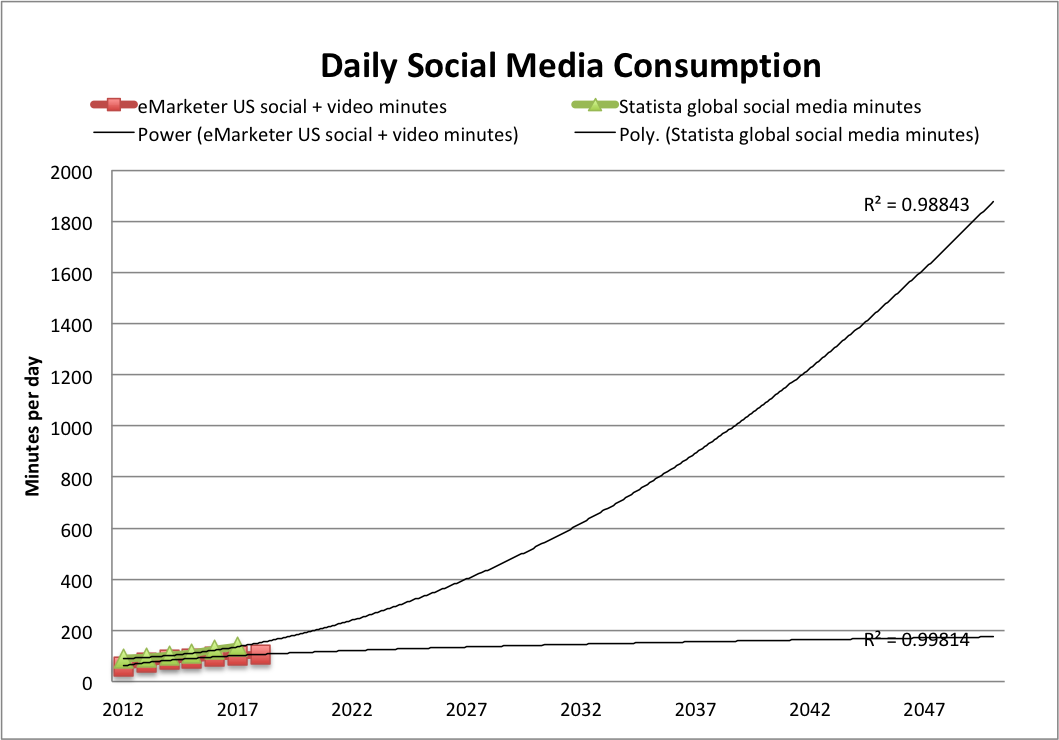
Note: The trendline of best fit for most of our extrapolations doesn’t fit the eMarketer data very well, so instead I’ve used a power trendline. The polynomial(2) trendline we often use does fit the Statista data pretty well, however. (You see both in the figure above)
I also noticed in reading qualitative discussions that Facebook and YouTube’s average daily minutes are very similar, with video getting a bit more time, and this is also the shown in eMarketer’s data, with the gap slowly widening in video’s favor. I’ve extrapolated eMarketer’s social and video figures separately to show how that divergence might take shape (again, the power trendline seemed to fit best).
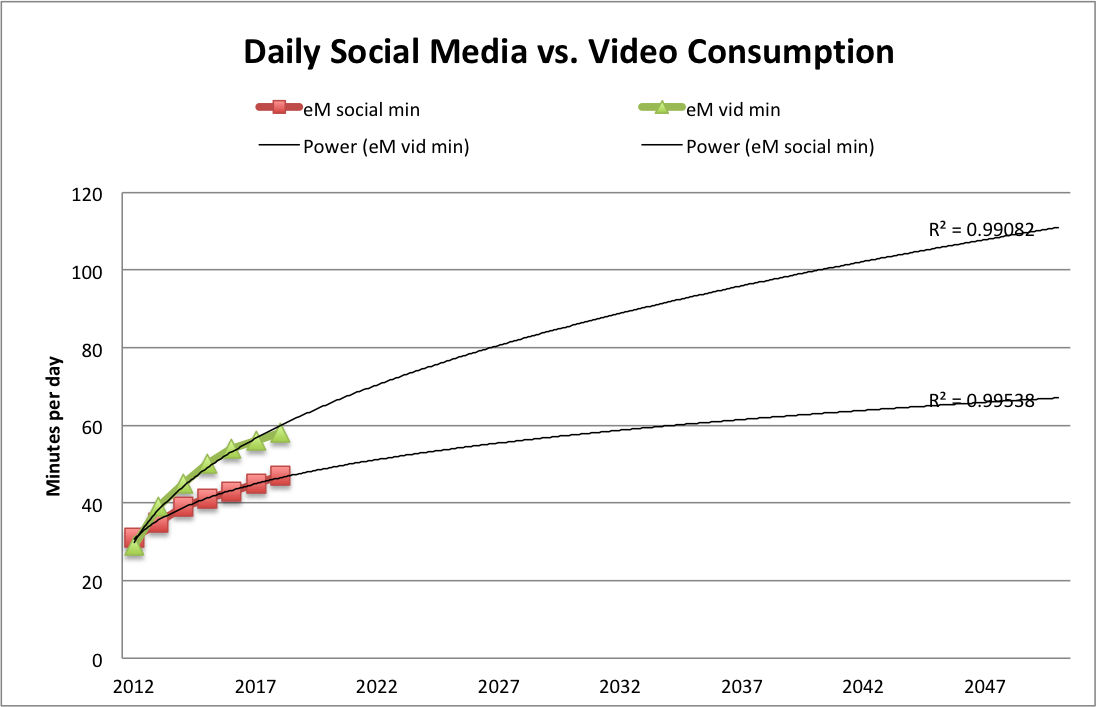
No surprise to see video pulling ahead of social, and I’m certain that marketing research focused on the growth of online video would suggest a much steeper curve.
Meanwhile, and also no surprise, here’s a chart (from Recode, citing Zenith) showing that Internet consumption is overtaking traditional TV consumption (from the same source as the Global/N.American overall media consumption figures above).
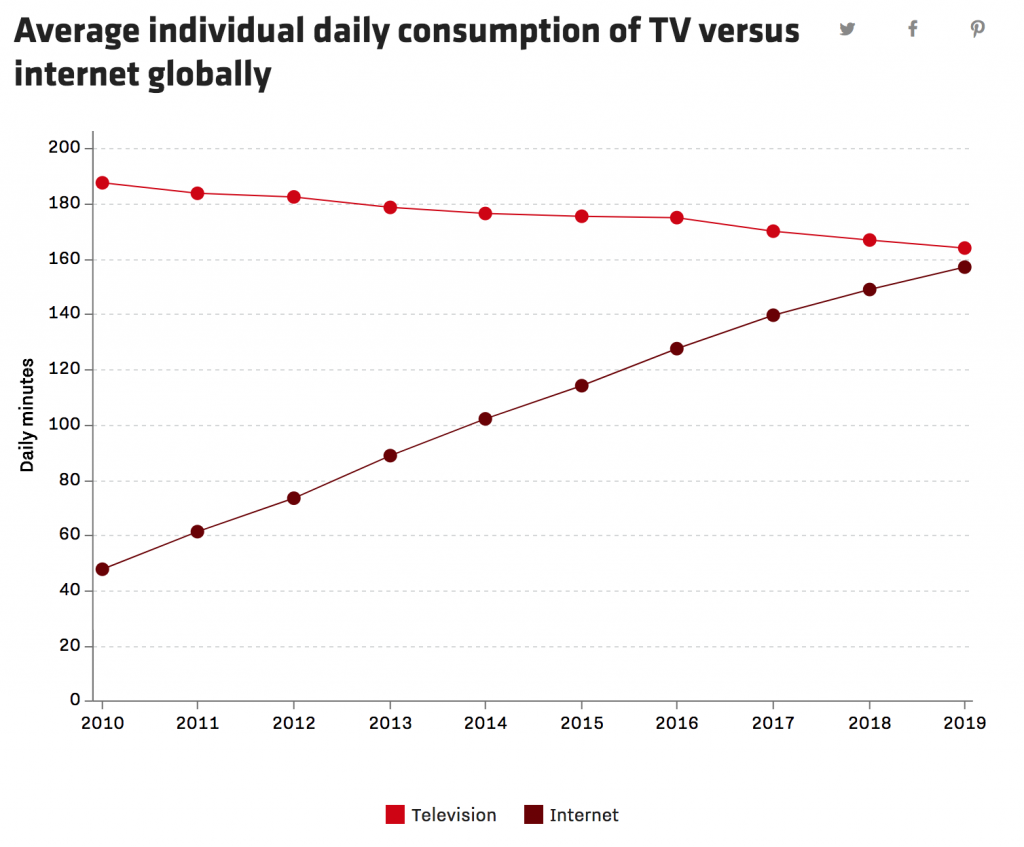
[Click through to the great interactive version at Recode.]
Another ad media firm, GroupM, also predicts online time overtaking traditional TV this year.
In line with that, this year (2018), globally, advertisers are expected to spend more online than on television for the first time. Interestingly, social media ad spending is expected to rise 21% to $58 billion while video ad spending is rising 19% to $32. (Recode citing Zenith)
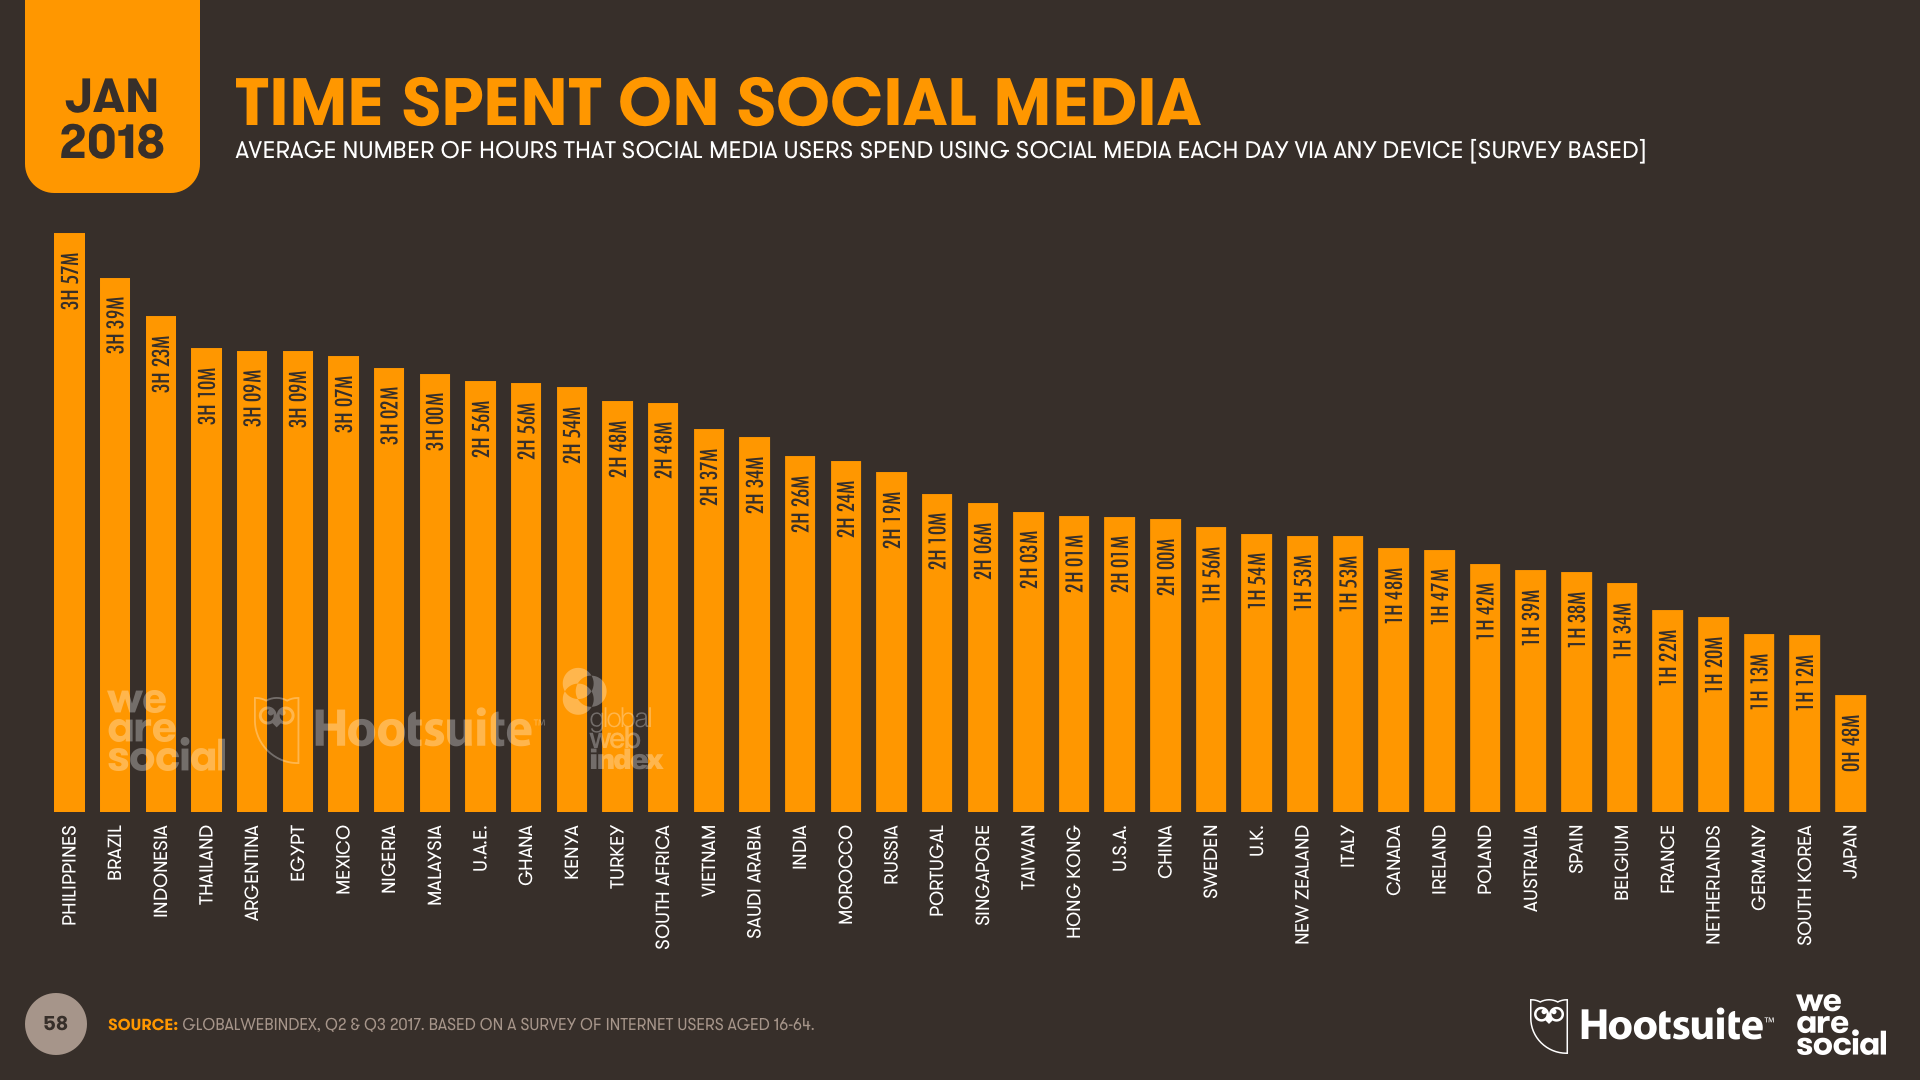
Here’s a snapshot from We Are Social showing how social media consumption varies from one country to another in 2017.
srcs:
eMarketer, June 2016
“Growth in Time Spent with Media Is Slowing”
Note:
eMarketer aggregates data from various research firms and they don’t offer much detail (at least, not to unpaid customers). I don’t know if these figures are based on consumer surveys or if they are based on data provided by service providers.
Statista (citing ??, 2017), 2018
“Daily time spent on social networking by internet users worldwide from 2012 to 2017”
Note:
Statista does not give the name of the original source (to unpaid customers), but they do specify that this data is based on worldwide, online consumer surveys of adults aged 16-64. Statista also reports that the survey question asks, “Roughly how many hours do you spend engaging with/connected to social networks or services during a typical day?” The source must be GlobalWebIndex, which conducts web-based surveys. Their latest report (2018) estimates current social media time exactly as reported by Statista. Their press release here describes the same survey question, and the same survey audience (16-64 year olds).
Entrepreneur, in Jan 2018 (date established via InternetArchive), published the following comparative daily consumption figures:
youtube: 40min/day
facebook: 35min/day
Snapchat: 25min/day
Instagram: 15min/day
Twitter: 1min/day
