

energy
Energy Mix, Consumption, Prices, Emissions
Overview
Energy mix forecasts looking out 15 to 35 years are available from a handful of governmental, industry, and independent sources. The excerpts below are preceded by my brief notes, in italic, introducing the source.
General consensus: oil, gas, and coal continue to dominate the energy mix. Gas grows substantially; oil and coal are either level or decreasing. Renewables show the highest growth rates. Amongst renewables, solar shows the greatest growth. Energy intensity (or consumption per capita) decreases.
In addition to energy mix, the figures below also include forecasts for overall usage, intensity (per capita usage), prices, residential sources, and emissions.
Findings
U.S. Energy Information Administration
The U.S. Energy Information Administration (EIA) presents energy forecasts for a range of cases in its Annual Energy Outlook. The excerpts below refer to the Reference Case, wherein GDP grows at an average annual rate of 2.4%, and current laws and regulations remain basically the same. This is the “business as usual” scenario. Forecasts for five other scenarios are presented in the report, but are not excerpted here.
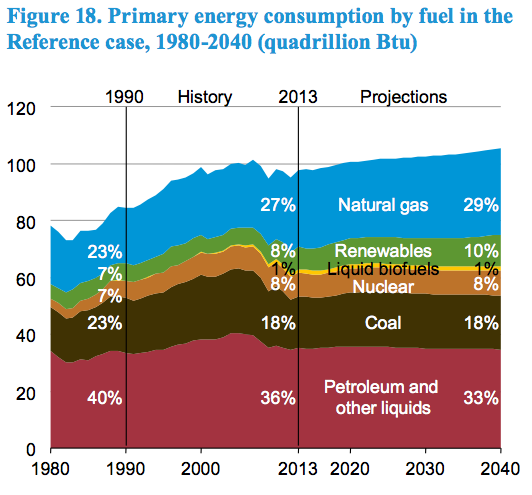
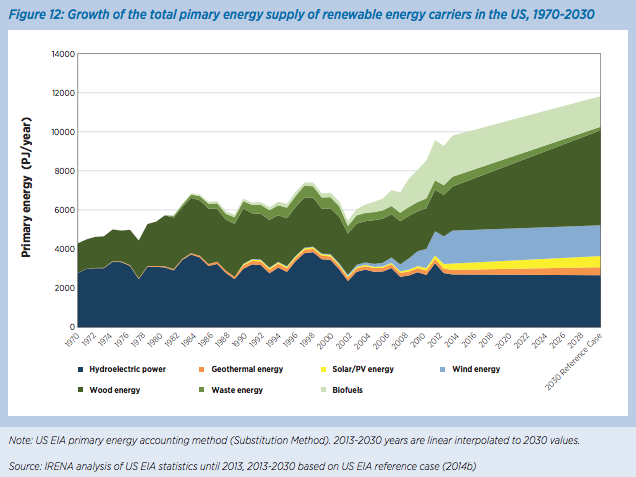
Total primary energy consumption grows in the AEO2015 Reference case by 8.6 quadrillion Btu (8.9%), from 97.1 quadrillion Btu in 2013 to 105.7 quadrillion Btu in 2040 (Figure 18).
data available here
web chapter here
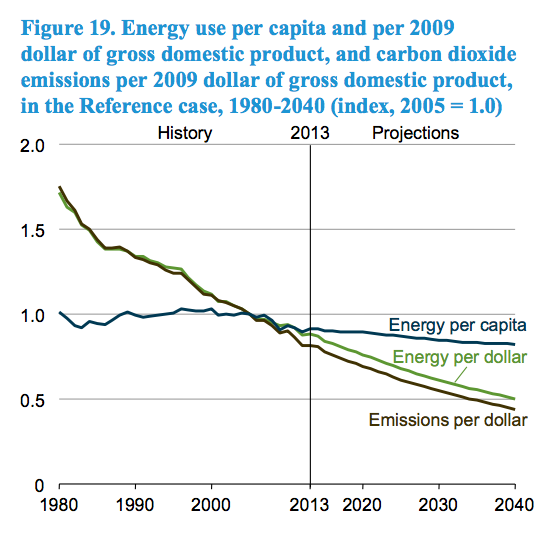
Energy intensity (measured both by energy use per capita and by energy use per dollar of GDP) declines in the AEO2015 Reference case over the projection period (Figure 19).
data available here
web chapter here
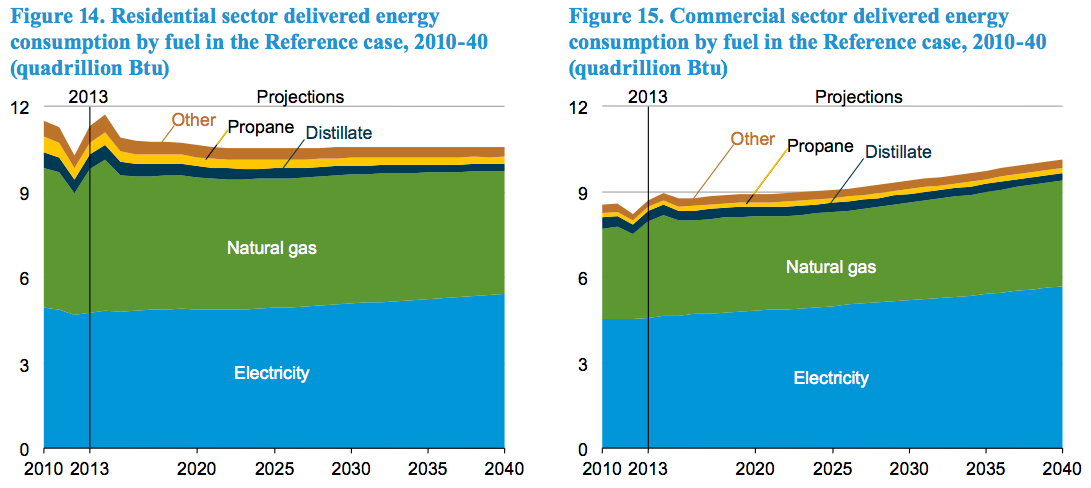
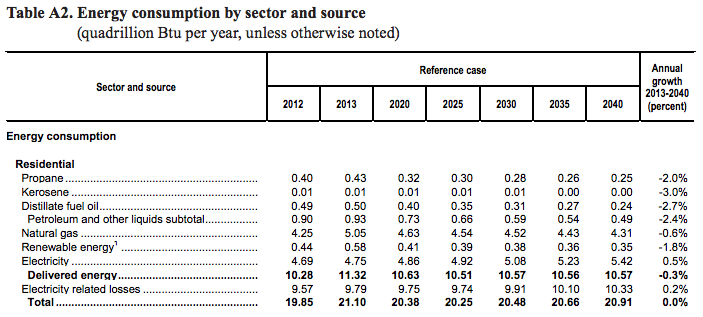
Delivered energy consumption decreases at an average rate of 0.3%/year in the residential sector and grows by 0.6%/year in the commercial sector from 2013 through 2040 in the AEO2015 Reference case (Figure 14 and Figure 15). Over the same period, the total number of households grows by 0.8%/year, and commercial floorspace increases by 1.0%/year (Table 4).
data available here and here
web chapter here
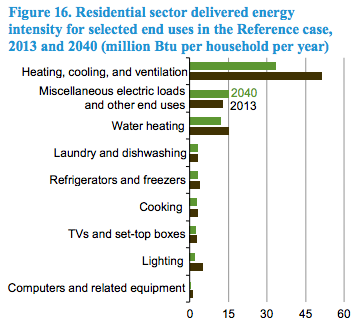
End-use energy intensity, as measured by consumption per residential household or square foot of commercial floorspace, decreases in the Reference case as a result of increases in the efficiency of equipment for many end uses (Figure 16 and Figure 17). Federal standards and voluntary market transformation programs (e.g., Energy Star) target uses such as space heating and cooling, water heating, lighting, and refrigeration, as well as devices that are rapidly proliferating, such as set-top boxes and external power supplies.
data available here
web chapter here
Src:
U.S. Energy Information Administration. April 2015. “The Annual Energy Outlook 2015.” DOE/EIA-0383(2015)
Contacts
Director: John J. Conti john.conti@eia.gov
General questions: Paul Holtberg paul.holtberg@eia.gov
[more contacts listed in the report TOC]
*
World Energy Council
The World Energy Council (WEC) is the UN-accredited global energy body comprised by more than 3000 member organizations drawn from governments, private and state corporations, academia, NGOs and energy-related stakeholders. WEC publishes many recurring reports, but in 2013 it released a set of projections to 2050.
The report focuses on two scenarios: a more consumer-driven scenario (called “Jazz”), and a more voter-driven scenario (called “Symphony”). Jazz has a focus on energy equity with priority given to achieving individual access and affordability of energy through economic growth. Symphony has a focus on achieving environmental sustainability through internationally coordinated policies and practices.
| Primary Energy Mix, 2010 and 2050 (Jazz and Symphony) | |||
| 2010 | 2050 Jazz | 2050 Symphony | |
| Fossil fuels (coal, oil, gas) | 79% | 77% | 59% |
| Renewables | 15% | 20% | 30% |
| Nuclear | 6% | 4% | 11% |
| World Energy Council Jazz and Symphony Projections for North America, 2010-2040 | |||||||||
| 2010 | 2020 | 2030 | 2040 | 2050 | 2020 | 2030 | 2040 | 2050 | |
| Total Primary Energy Supply (EJ/y) | 116 | 128 | 135 | 136 | 130 | 118 | 114 | 108 | 105 |
| Total Electricity Generation (TWh/y) | 5,214 | 6,152 | 6,903 | 7,728 | 8,024 | 6,100 | 6,733 | 7,695 | 8,057 |
| Carbon Price (US$2010/tCO2) | 8 | 15 | 21 | 28 | 21 | 28 | 55 | 70 | |
| CO2 – Emissions (GtCO2/y) | 6.5 | 7.2 | 7.3 | 7.2 | 6.7 | 6.2 | 5.4 | 4.4 | 3.1 |
| Carbon Capture, Use And Storage (GtCO2/y) | 0.0 | 0.0 | 0.0 | 0.1 | 0.2 | 0.0 | 0.1 | 0.3 | 1.1 |
10 Key Messages
- Energy system complexity will increase by 2050.
- Energy efficiency is crucial in dealing with demand outstripping supply.
- The energy mix in 2050 will mainly be fossil based.
- Regional priorities differ: there is no ‘one-size-fits-all’ solution to the energy trilemma.
- The global economy will be challenged to meet the 450ppm target without unacceptable carbon prices.
- A low-carbon future is not only linked to renewables: carbon capture, utilisation and storage (CC(U)S) is important and consumer behaviour needs changing.
- CC(U)S technology, solar energy and energy storage are the key uncertainties up to 2050.
- Balancing the energy trilemma means making difficult choices.
- Functioning energy markets require investments and regional integration to deliver benefits to all consumers.
- Energy policy should ensure that energy and carbon markets deliver.
Scenarios are alternative views of the future which can be used to explore the implications of different sets of assumptions and to determine the degree of robustness of possible future developments. While most widely known scenarios are normative, the WEC has adopted a different, exploratory approach. ‘Normative’ in this context means that the scenarios are being used to drive the world towards a specific objective such as a particular atmospheric CO2 level. In contrast, the WEC with its exploratory scenarios Jazz and Symphony, attempts to provide decision makers with a neutral fact-based tool that they will be able to use to measure the potential impact of their choices in the future.
This approach can only be done successfully by a network like the WEC’s with its impartial and inclusive membership structure. Over 60 experts from more than 28 countries have contributed to the WEC’s scenario building process over a period of three years.
Src:
World Energy Council. 2013. “World Energy Scenarios: Composing Energy Futures to 2050”
*
BP
BP produces a 20-year forecast based on a single, most-likely growth trajectory.
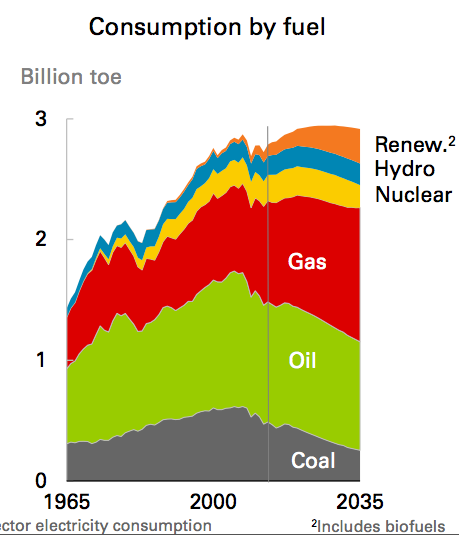
Oil consumption declines 0.5% p.a. over the Outlook as a result of falling demand in the transport sector. Coal declines by 2.9% p.a., driven by more aggressive environmental policies and competitively priced natural gas. Nuclear (-0.6% p.a.) demand also declines over the Outlook. Natural gas is the only fossil fuel to grow over the Outlook (1.3% p.a.). Renewables are the fastest growing group of fuels, increasing by 5.1% p.a.. Hydro-electric power increases 0.6% p.a., faster than total energy demand.
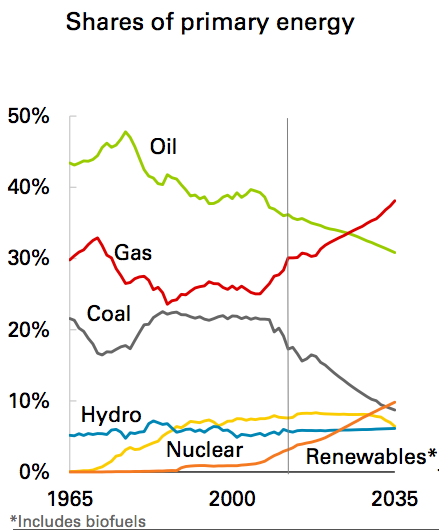
Shares of fossil fuels in the energy mix decline from 83% today to 78% by 2035. Shares of renewables (including biofuels) increase from 3% in 2013 to 10% in 2035, while hydro remains stable throughout the Outlook at 6% and nuclear remains near 8% until losing market share in the last few years of the Outlook. Shares of natural gas grow from 30% in 2013 to 37% in 2035, overtaking oil as the leading fuel around 2025. More than half of the increase in energy demand from 2013-2035 is met by natural gas. Oil’s market share declines throughout the Outlook, reaching just 31% by 2035, the lowest share on record and down from a high of 48% in 1977. Coal’s share drops to just 9%, also the lowest on record. Renewables overtake coal as the third largest fuel by market share by the end of the Outlook.
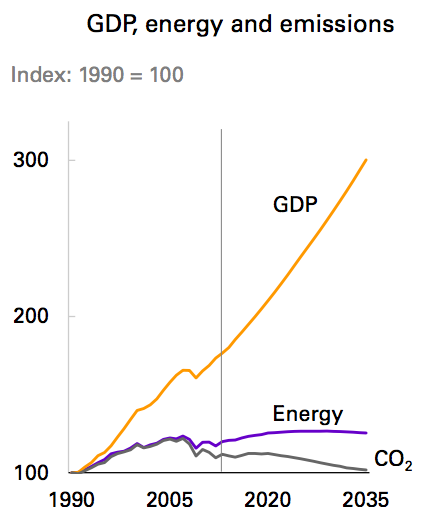
Continuing declines in energy intensity – the broadest indicator of improving energy efficiency across the economy – leads to a marked widening in the gap between GDP and energy consumption. Energy intensity declines by 39% by 2035 (-2.2% p.a.). Total carbon emissions from energy consumption decrease by 9% between 2013 and 2035 (-0.4% p.a.), with the rate of decline speeding up in the last half of the outlook, (-0.7% p.a. from 2025 to 2035).
Src:
BP. February 2015. “Energy Outlook 2035: Focus on North America.”
Excel tables (49.8KB)
Country Insights: US
*
The International Renewable Energy Agency
The International Renewable Energy Agency (IRENA) is an intergovernmental organisation that supports countries in their transition to a sustainable energy future, and serves as the principal platform for international co-operation, a centre of excellence, and a repository of policy, technology, resource and financial knowledge on renewable energy. As of December 2015, there are 144 member states, including the US.
The following excerpts come from a report on renewable energy sources and consumption in the US. Although the report focuses on the potential to dramatically increase renewable energy, the excerpts here highlight it’s projections for conservative, or business as usual, usage of renewables. The data in their report is from the US Energy Information Agency.
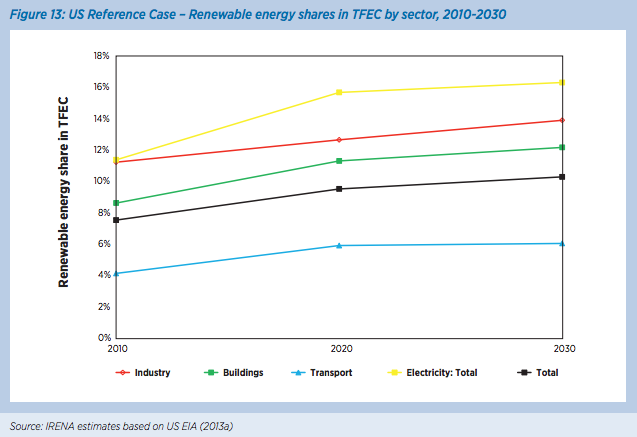
In 2010, the US was the second largest energy consumer in the world with a total final energy consumption (TFEC) of 64 exajoules (EJ), equivalent to 19% of the global TFEC (IEA, 2013a). The US TFEC is projected to remain stable in the period between 2010 and 2030 growing by only 4% according to US Energy Information Agency‘s Annual Energy Outlook (AEO) (US EIA, 2013a). In the same time period, based on current policies or the Reference Case according to this study, the US share of renewable energy in the TFEC will only grow from 7.5% in 2010 to 10% in 2030, driven mostly by an increase in renewable power generation.
The Reference Case for the US was based on the U.S. Energy Information Agency’s “Annual Energy Outlook 2013”
Renewable energy share in TFEC of the US stood at 7.5% in 2010 (the base year of REmap 2030 analysis). This included 2.4% renewable power, 1.6% liquid biofuels and the remainder (3.4%) largely solid biomass in industry and building heating.
Src:
IRENA. 2015. “Renewable Energy Prospects: United States of America, REmap 2030 analysis.”
State of the Future Index (28 variables)
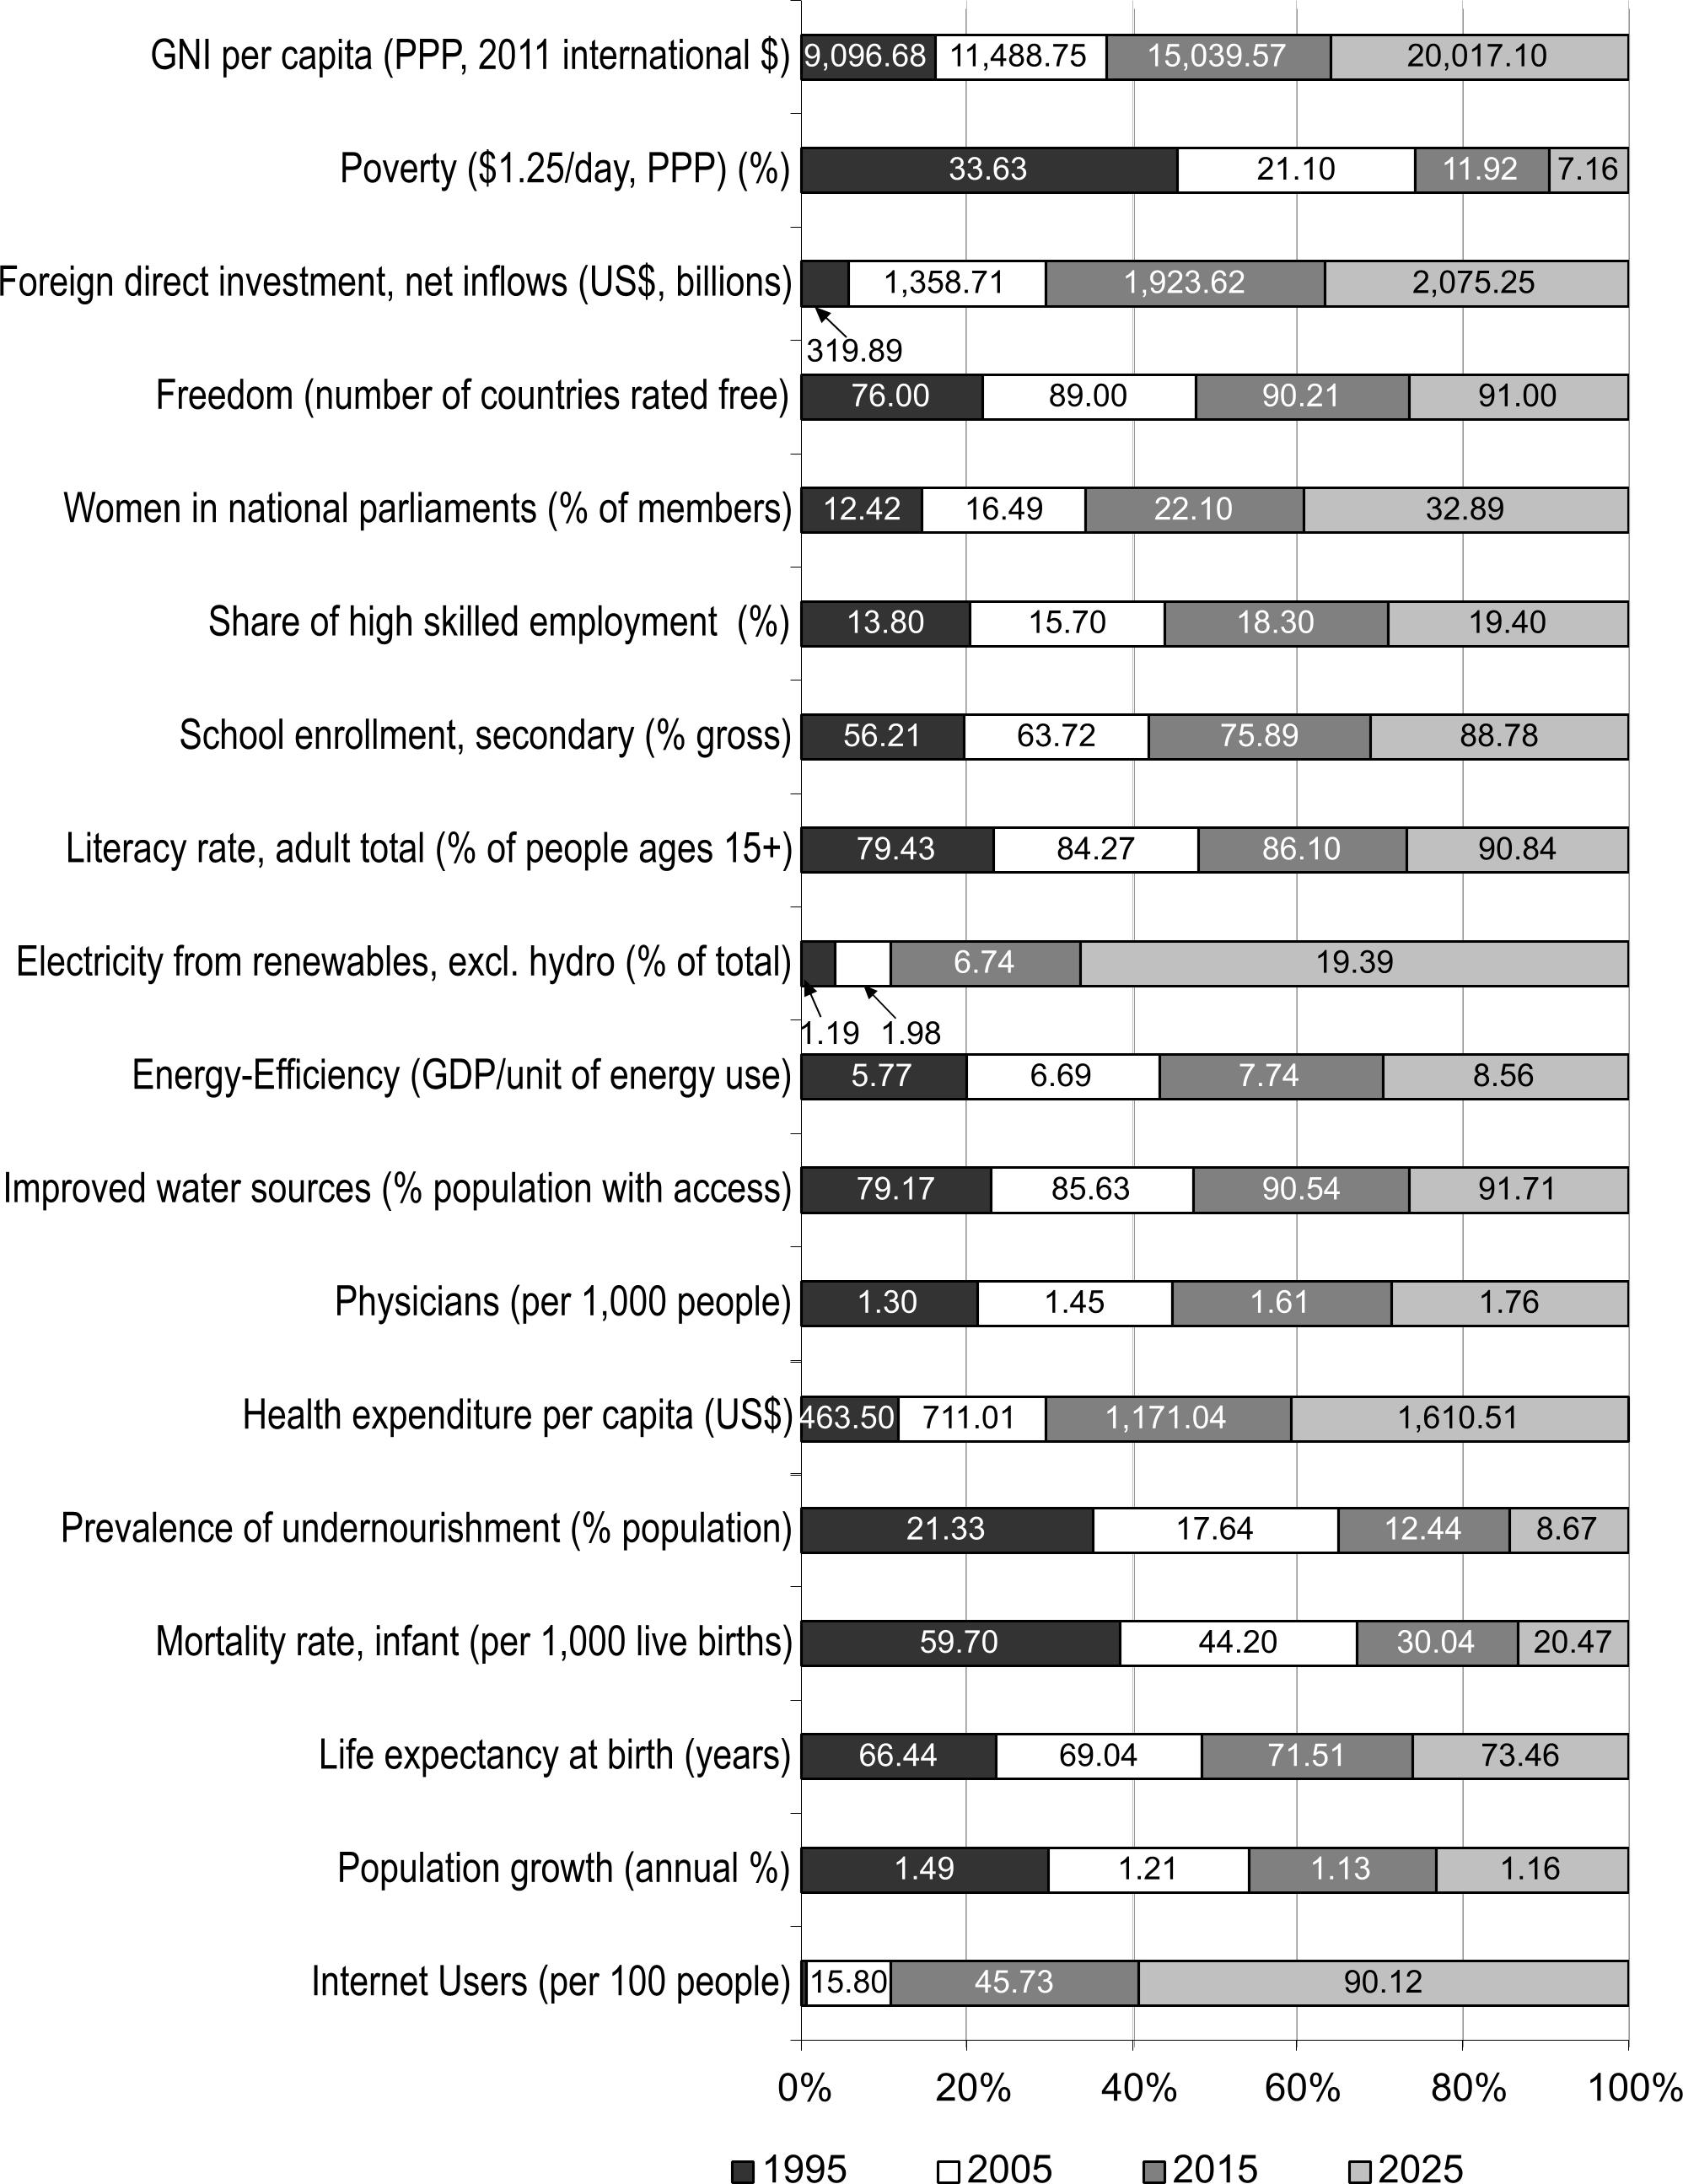
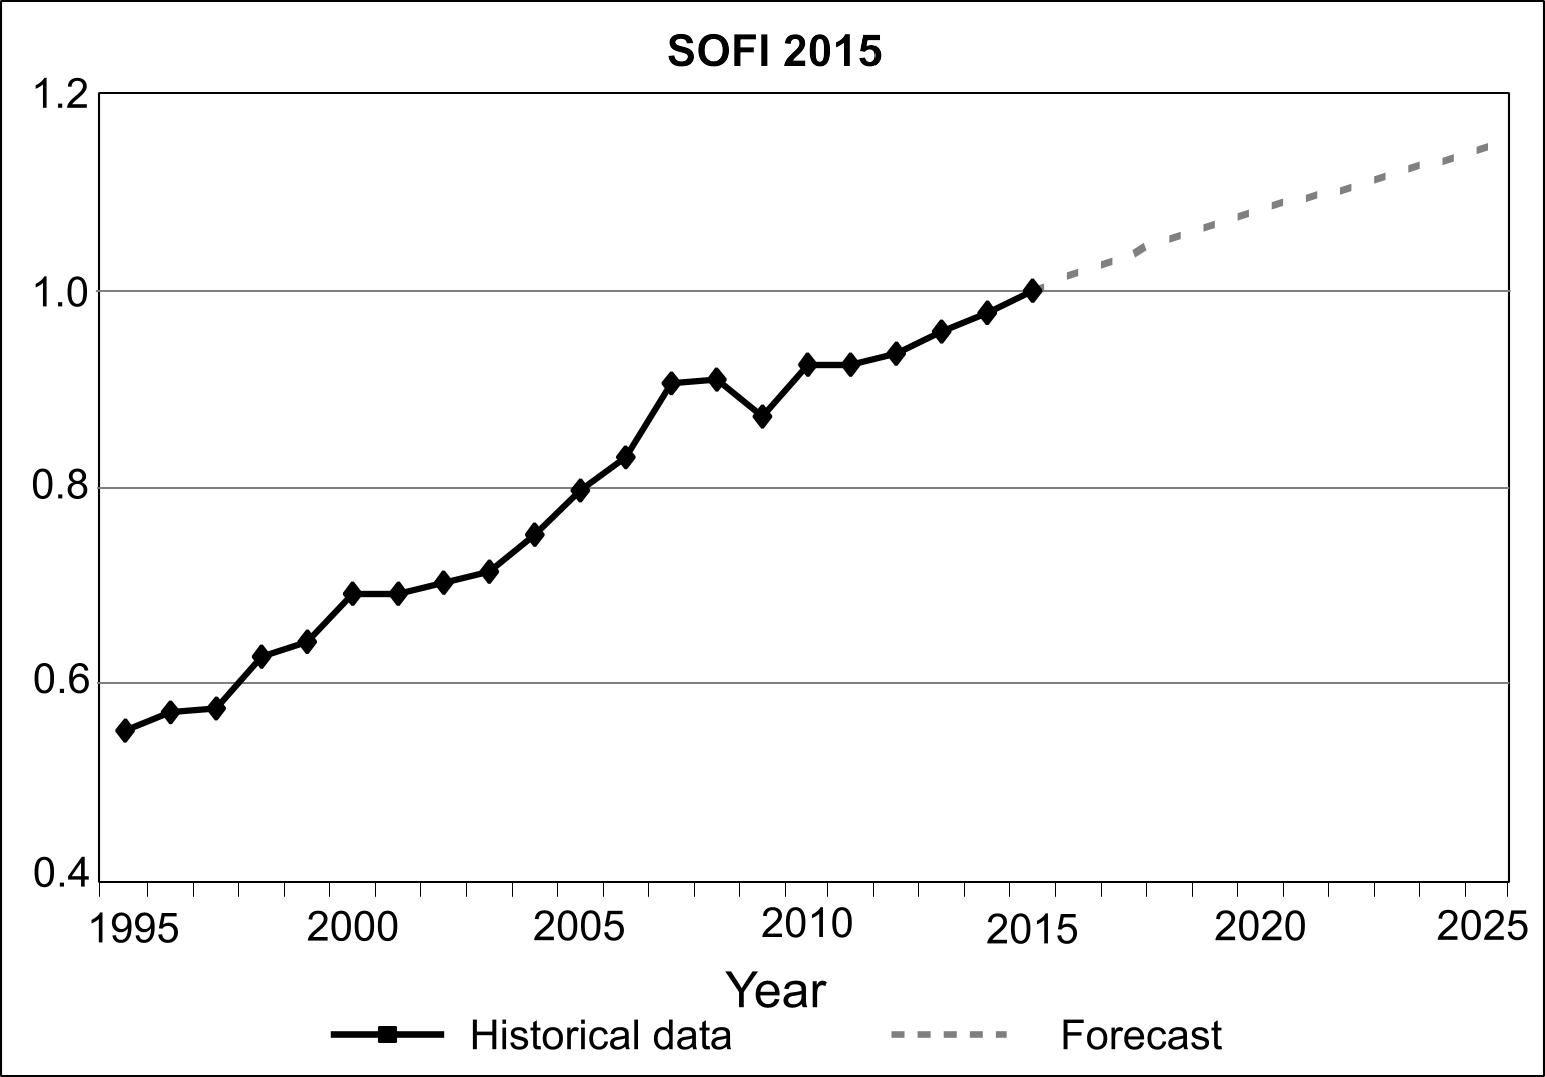
Every year, The Millennium Project (MP) computes a “State of the Future Index” looking 10 years into the future, based on data from the previous 20 or more years. The index calculation is based on values for multiple, individually-forecast key variables (28 in 2015). The index is calculated globally, as well as for individual countries. The overall index is intended to show the direction of things to come.
For our purposes the forecasts for the 28 individual variables are of most interest. MP breaks the variables into two groups: those showing improvement, and those showing decline. The values for the individual variables (previous actual, and forecast) are displayed within the shaded area of the charts.
Areas showing improvement in 2015:
Areas showing decline in 2015:
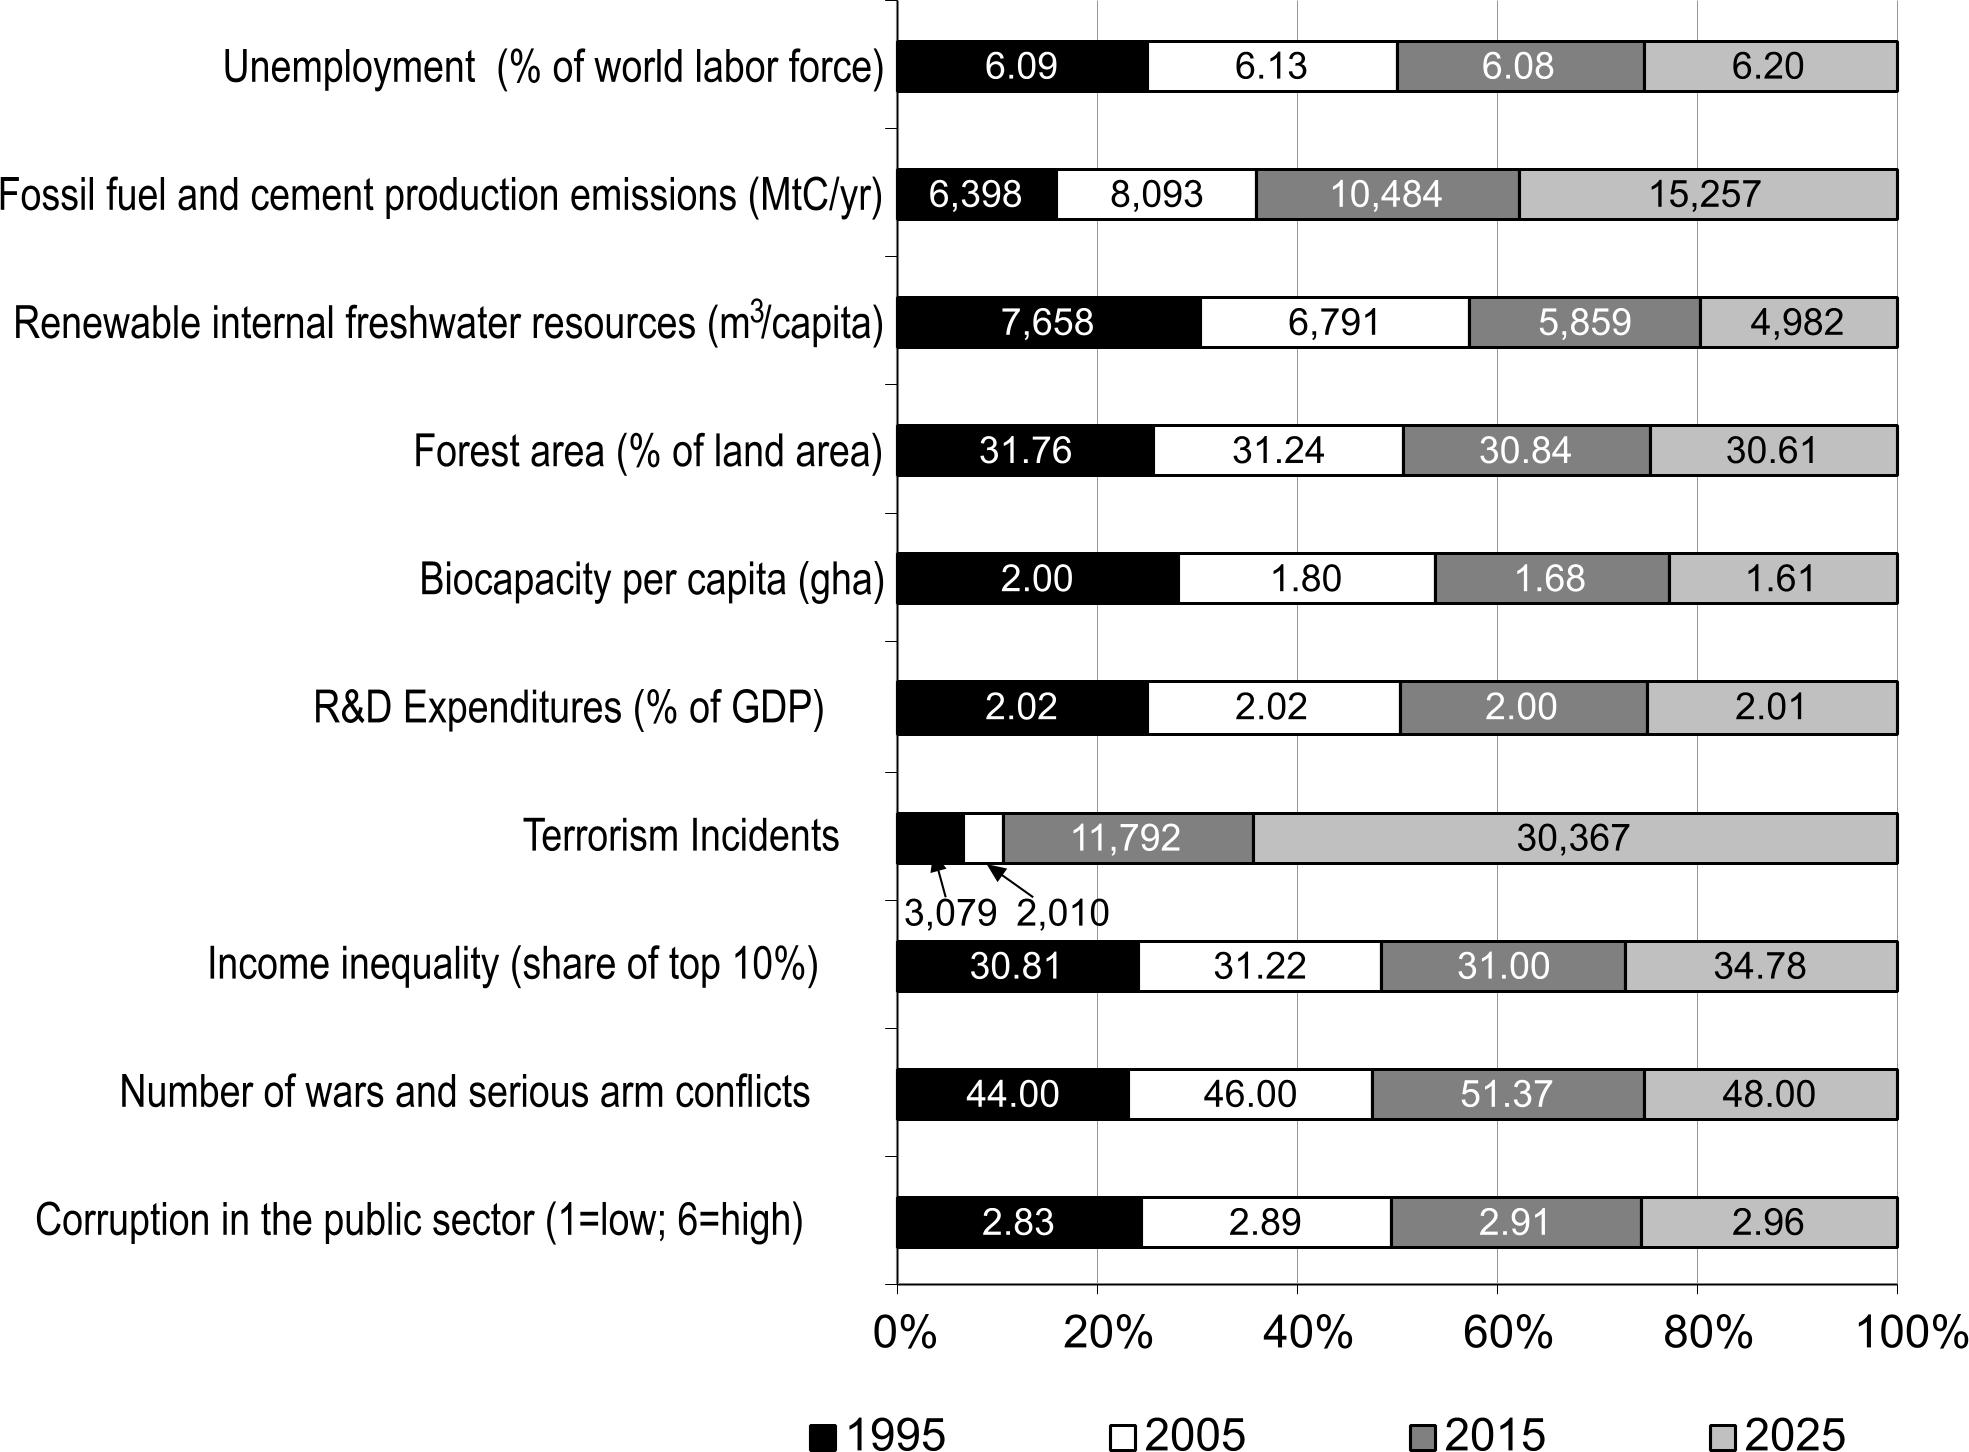
In 2015, the calculated Index looks like this:
Src: Gordon, Theodore J. 2015. “2015 State of the Future Index.” The Millennium Project.
Charts for each indicator, and a brief indication of the source for the data are in this PDF.
The Millennium Project is an independent non-profit global participatory futures research think tank of futurists, scholars, business planners, and policy makers who work for international organizations, governments, corporations, NGOs, and universities. Their annual report collects and assesses judgments from over 3,000 people selected by its 56 nodes around the world.
