

Internet Connectivity and Infrastructure
Pew Internet/Broadband Fact Sheet


src:
Pew Research Center, Feb 2018
“Pew Internet/Broadband Fact Sheet”
*
FCC Fixed Broadband Deployment Map


See the source link for an interactive version of the map.
src:
FCC Fixed Broadband Deployment
Accessed April 2018
Note: Discussion of the FCC map and it’s latest version is available here. The latest map is based on 2016 data. FCC does not have an equivalent map for mobile broadband, although it does publish an annual report on mobile wireless competition.
*
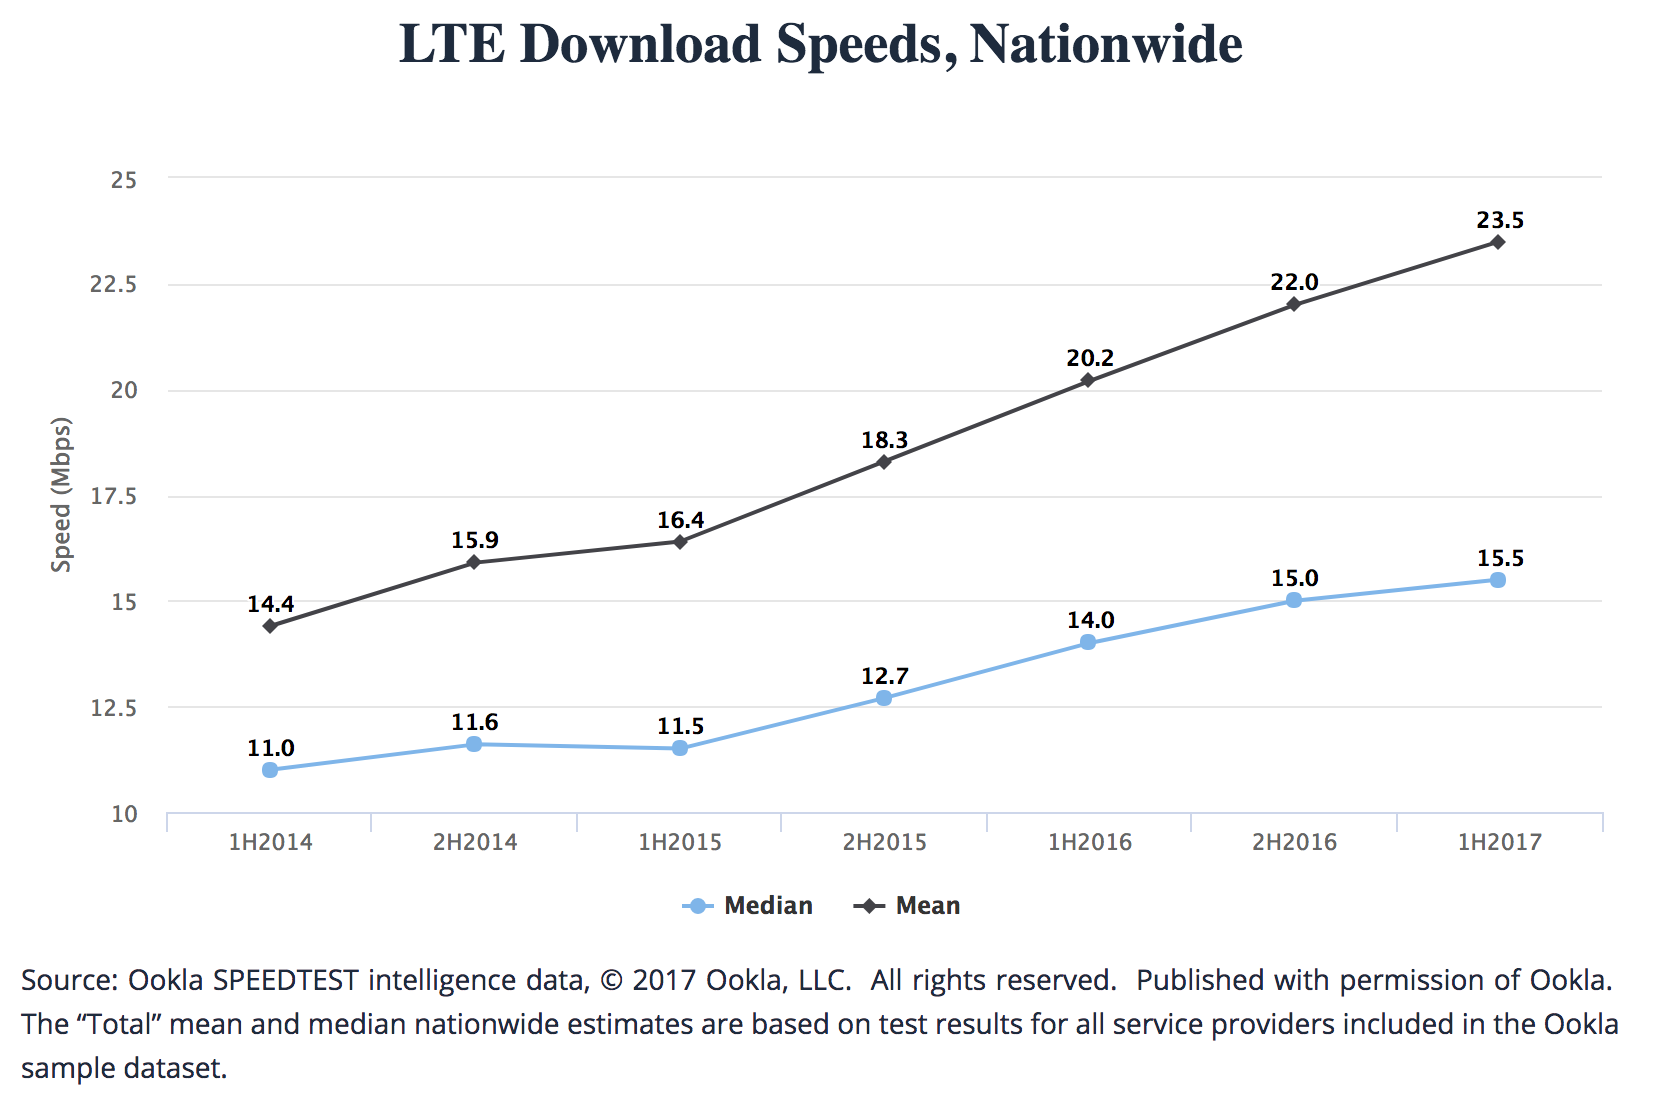
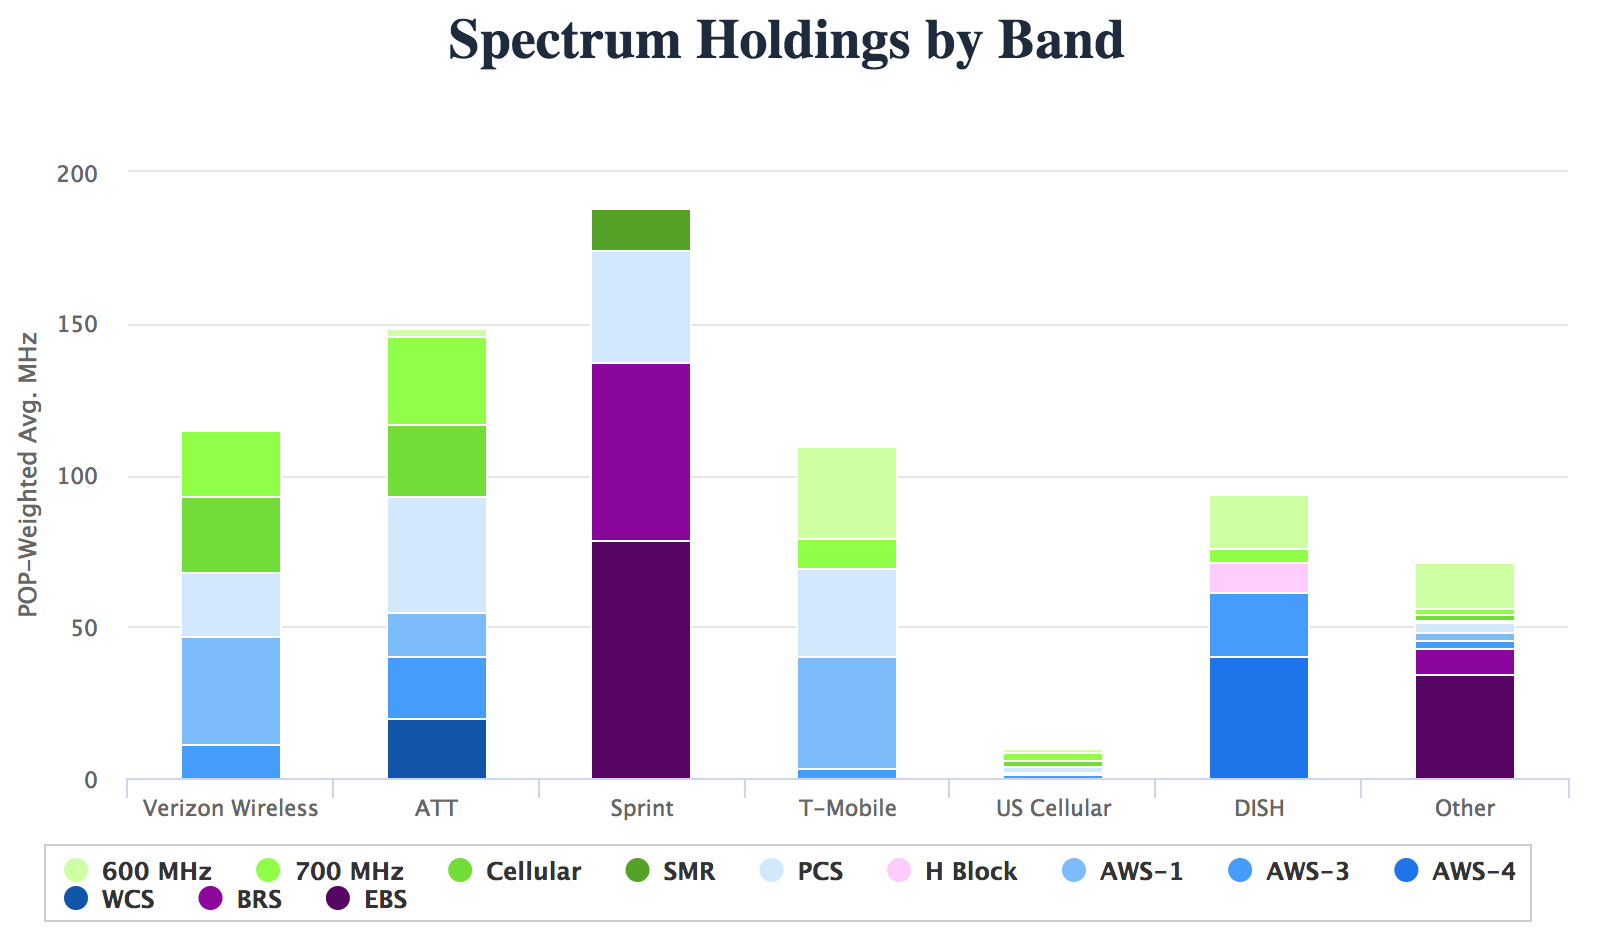
20th Mobile Wireless Competition Report Quick Facts


src:
FCC, September 2017
20th Mobile Wireless Competition Report Quick Facts
A couple more interesting bits from the full report…
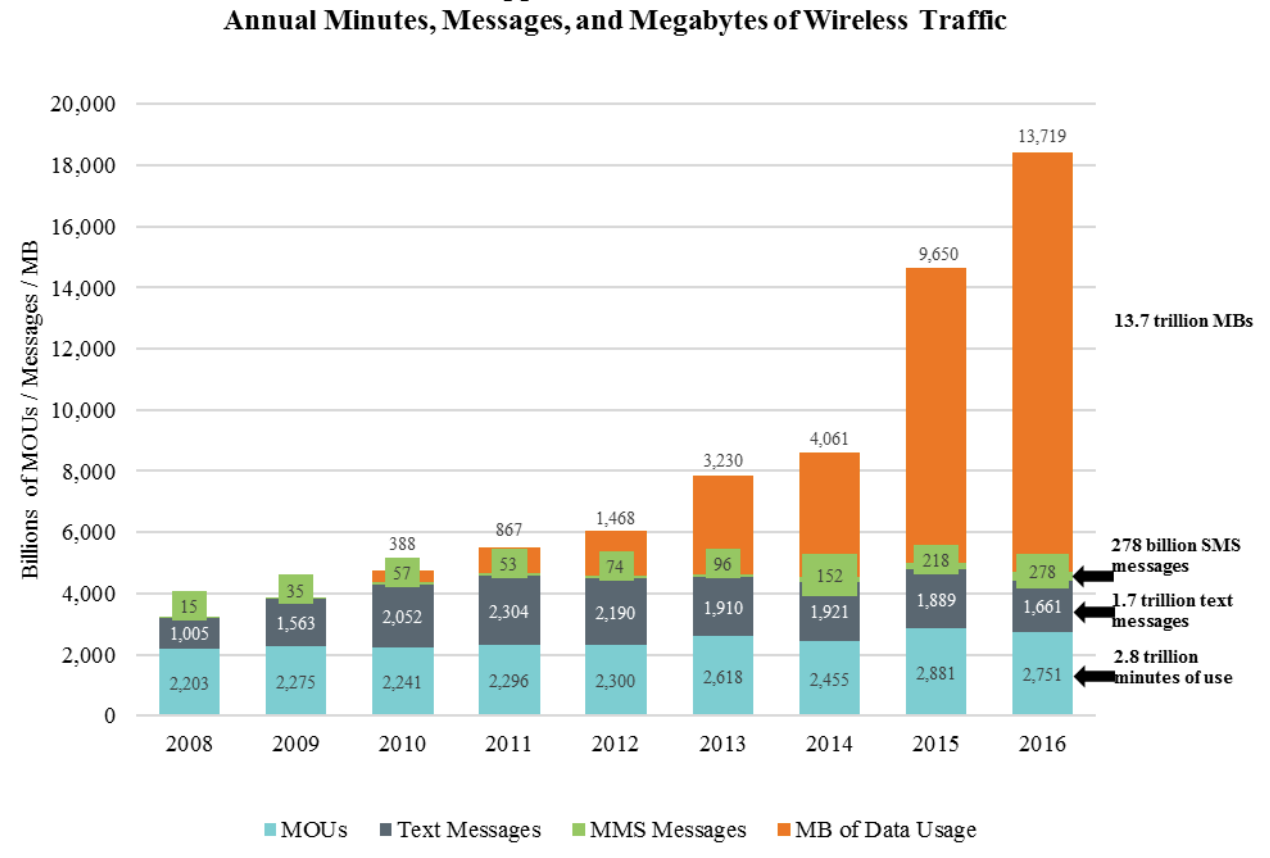
NOTE: MOU = minutes of voice use
[p.72]

Note: A “connection” is a paid subscription, equivalent to the number of ‘lines’ when discussing landline phone service.
[p.73]
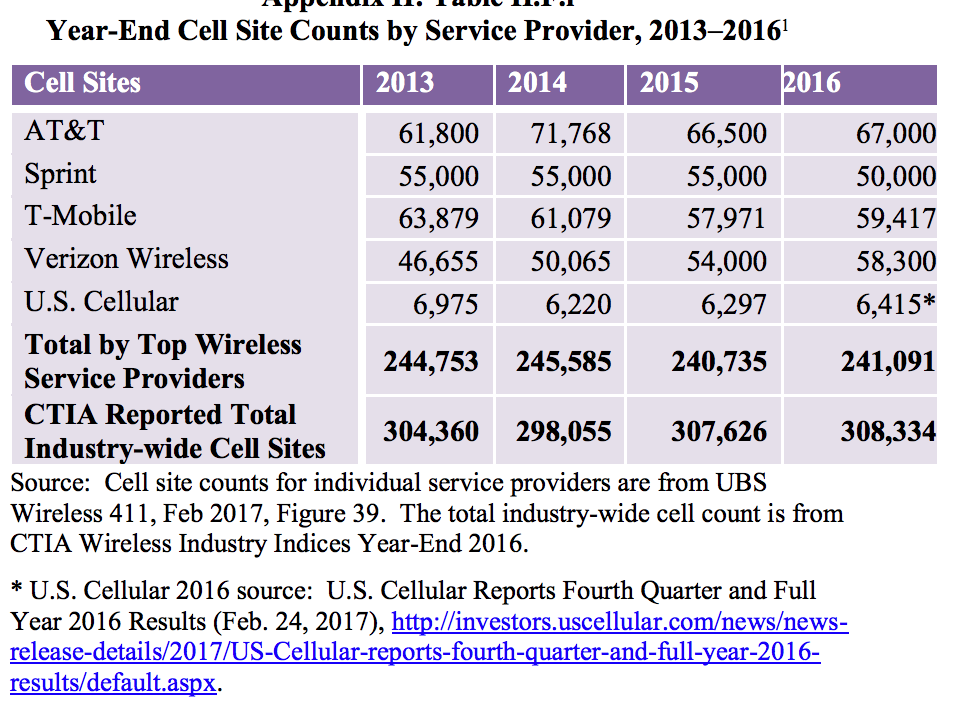
[p.74]
Note: According to CTIA, there has been an approximate 57 percent growth in the number of cell sites over the last ten years (in 1986, there were 1,531 cell sites in service).
The report notes that, according to CTIA, the number of cell sites will significantly increase as the mobile wireless industry densifies and prepares for 5G. Also, because multiple cell sites can be co-located in the same “tower” site, the reported cell sites should not be equated with “towers.” The reported cell sites include repeaters
and other cell-extending devices (e.g., femtocells or distributed antenna systems).
A specialized communications tower industry has developed to provide and manage the
support structures for the cell sites. Today, there are more than 120 tower and DAS operators in the United States, and a majority of towers are now owned or operated by independent companies rather than by mobile wireless service providers.142 Independent tower operators own, operate and lease shared wireless communications and broadcasting towers, manage other tall structure sites (such as rooftops and water towers), and to a lesser extent, own and operate neutral facilities to host small cells and DAS networks for mobile service providers. [p.32]
src:
FCC, Sep 2017
“Implementation of Section 6002(b) of the Omnibus Budget Reconciliation Act of 1993, Annual Report and Analysis of Competitive Market Conditions with Respect to Mobile Wireless, Including Commercial Mobile Services”
*
[In the U.S.] Expected arrival time-frame for 5G roll out with decent coverage and availability in handsets:
early 2020s
(Although 2019 phones will be advertising capacity, even if there’s no network to connect to right away.)
“I believe that eventually consumers will pay for just one broadband connection, fixed and mobile. When I say 50M or more homes, I mean wireless substitution. I think you can draw a parallel with local telephone service and long distance. The long distance business evaporated. Similarly, today’s fixed and mobile broadband services will collapse into one. The cellular operators today are better positioned to take that market.” Peter Rysavy (wireless technologies consultant)
src:
Forbes, Sep 2017
“The Dawn Of 5G: Will Wireless Kill the Broadband Star?”
Ericsson (Nov 2017) has the same prediction for 5G, anticipating coverage for more than 20% of the global population (1 billion) by the end of 2023. First deployments are expected in 2019.
*
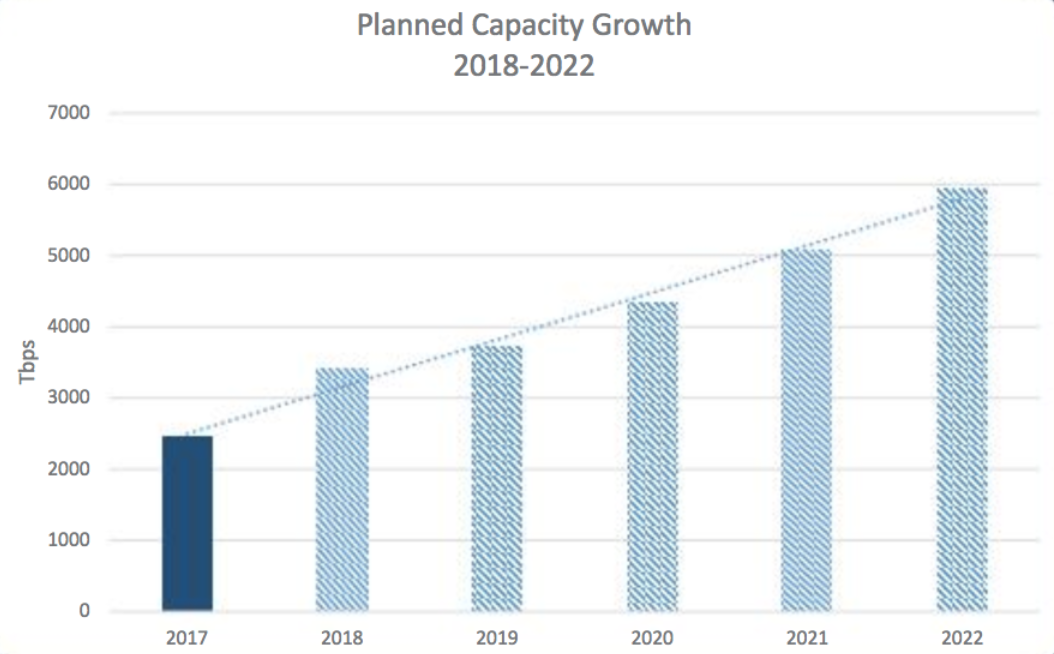
Submarine Cable Capacity

src:
Submarine Telecoms Industry Report 2017
[p.17]
*
Network World, Mar 2018
“Submarine cable boom fueled by new tech, soaring demand”
Excerpts:
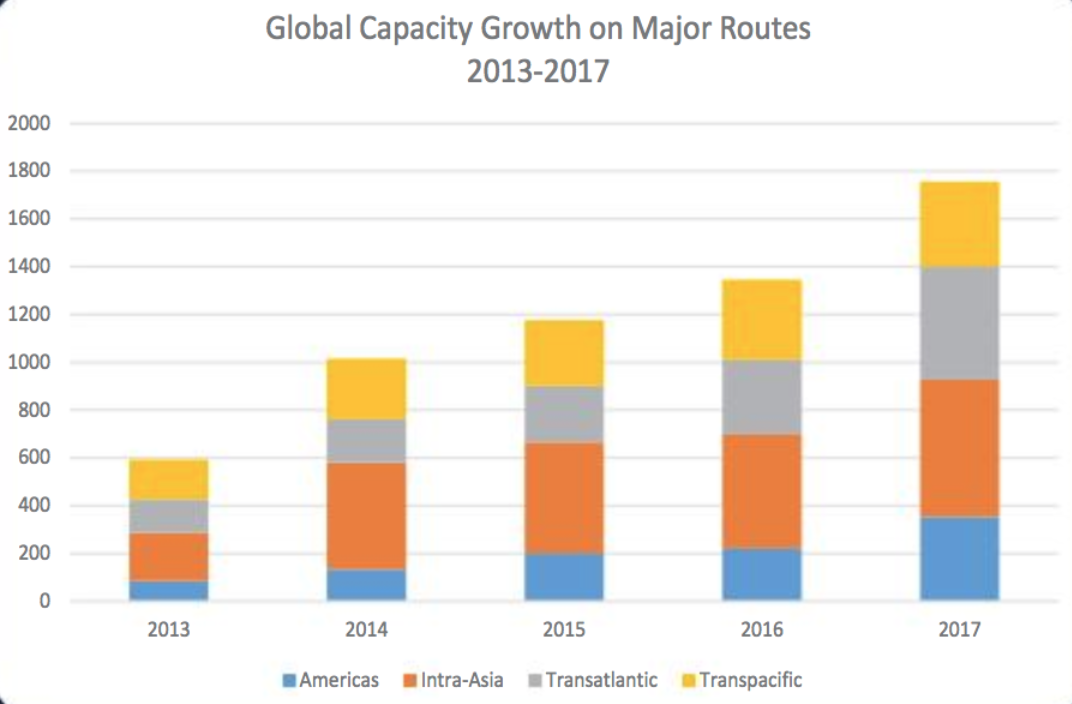
Between 2013 and 2017, the subsea cable industry has added an average of 32 percent of capacity annually on major submarine cable routes.
SubTel Forum projects global submarine cable capacity will increase up to 143 percent between 2017 to 2022, and it also notes that a construction boom is already underway. Last year, 62,000 miles of submarine cable was added globally. This, after global averages didn’t crack 19,000 miles of added cable between 2013 to 2016.
According to TeleGeography, the international capacity deployed by companies such as Google, Facebook, Microsoft, and Amazon rose 14-fold between 2012 to 2016. … By investing in them, these mega-companies get them built faster. They also get a level of control over construction, maintenance and operation that’s ultimately more economical than becoming a paying customer on a telecom’s cable.
[It’s now cheaper to build systems with greater bandwidth. In 2013, new systems averaged 9 terabits per second (Tbps) — multiple systems planned for 2018 and 2019 will have capacities of 60 Tbsp. Tech advances are also eliminating costly and complex infrastructure layers, such as regen equipment. In addition, new cables can land directly inside multi-tenant data centers, rather than a traditional cable landing station (CLS) on the beach.]
*
Telegeography, Nov 2017
“A Complete List of Content Providers’ Submarine Cable Holdings”
This article lists cables owned or strongly supported by Amazon, Facebook, Google, and Microsoft.
Excerpt:
The amount of capacity deployed by content providers has outpaced all other customers of international bandwidth in recent years. Between 2012 and 2016 the amount of international capacity deployed by companies like Google, Facebook, Microsoft, and Amazon has risen 13-fold to 179 Tbps. (In contrast, international capacity deployed by all other operators only rose threefold, to 272 Tbps).
Content providers prioritize some submarine cable routes more than others in their network deployments. Between 2012 and 2016, content provider demand was the strongest across the Atlantic where capacity rose at a compound annual rate of 66 percent to 42 Tbps.
And as such, the largest content providers have built U.S.-centric network architectures. Their investments on systems directly connecting Europe to Asia are almost non-existent, in comparison. In the Atlantic and Pacific, content providers accounted for over half of total demand in 2016. In contrast, content providers represented only a small share of capacity usage on routes connected to the Middle East and Africa.
Used International Bandwidth by Source, 2002-2016

*
Submarine Telecoms Industry Report 2017
Excerpts:
Submarine fiber systems ownership
2013-2017: 61% private, 39% consortium
2018 and beyond: 83% private, 17% consortium
A recent trend towards private ownership has been observed compared to historical trends of primarily consortia ownership. Business cases for smaller systems have been prevalent, and the demand driving these systems has differed from years past. Globe-spanning infrastructure cables that require consortium ownership have fallen out of favor, contributing to this trend shift.
The boom of private ownership will continue to extend well into the future, as more niche and point-to-point systems are implemented. Much of this is driven by intra-regional needs — typically for smaller nations looking to get connected. However, a growing number of systems are being driven by factors not previously seen in the submarine fiber industry.
[p.22]
*
Norway Telecom Trends
The Norwegian Communications Authority prepares a twice annual report of statistics showing developments in electronic communications services, including fixed telephony, mobile telephony and services, broadband and TV transmissions.
See especially Chapter 2, Development Trends, stating on page 11
src:
Norwegian Communications Authority, May 2016
“The Norwegian Electronic Communications Service Market 2015”
