

Homes
Summary
This is a roundup of basic statistics describing American homes including homeownership rates, housing starts, second home ownership, urban vs. rural home distribution, housing features distribution, total households, and home sales/spending. Most of the data are historic, with a couple forecasts (for housing starts and total households).
Historic home ownership rates are available from the US Census Bureau from the present going back to 1965. Statistics broken down by age-group are available back to 1982.
Forecasts for housing starts are available to 2025 from Forisk. Much shorter one-year forecasts are available from the National Association of Home Builders. Historic housing starts data are available from the UC Census Bureau at least to 2000, possibly as far back as 1959 (TO DO: CHECK FOR OLDER DATA)
Decadal historic data for the number of vacation homes are available from 1940 to 2000 from the US Census Bureau. Biennial data for the number of seasonal homes from 1973 through 2005 have been aggregated by the US Department of Housing and Urban Development (HUD). These figures just describe the number of second homes, but I’ve found a couple sources describing the number of households that own second homes (second home ownership rates). Statista has data for the number of people living in households that own second homes from 2008 to 2015. The US Federal Reserve (Fed) has “other residential real estate” ownership rates broken down by a variety of demographic characteristics going back to 1989 (their survey is conducted every three years). The Joint Center for Housing Studies Harvard University (JCHS) has a comparison of second homeownership by age for 1995 and 2004 (using data from the Fed).
HUD has aggregated figures on the distribution of urban vs. rural housing from 1973 to 2005.
The US Census Bureau has a collection of housing features data for new single family homes, multifamily units, and multifamily buildings. Many of the data points go back to 1973, some only to 2005. Features tracked include square footage, number of stories, number of bedrooms, number of bathrooms, number of fireplaces, type of heating system, type of heating fuel, type of foundation, type of parking, outdoor features, lot size, number of units sold by price. Figures include the total number of houses/units, and the percentage distribution.
Statista has figures on the total number of US households from 1960 to 2015. The JCHS has a forecast (based on Census data) to 2035 for total households, as well as households by age, race, and occupancy relationships (single, married, families, etc).
NAHB has a line chart showing the number of new single-family homes sold from 1978-2012. Annual numeric values for 2011-2015 are available in a separate NAHB document. Data points for previous individual years may be available from NAHB upon request. In any case, the Census has data on new residential sales going back to 1963. Census also has median and average sales prices for new homes sold back to 1963, and type of financing for houses sold back to 1988. NAHB has an indexed comparison between residential construction spending for single-family homes, multifamily units, and improvements from 2000 through 2016.
Findings
Ownership vs Renting
Homeownership Rates for the US and Regions: 1965 to Present
src:
US Census Bureau. Accessed May 16, 2016.
Housing Vacancies and Homeownership (CPS/HVS)
Historical Tables
“Table 14. Quarterly Homeownership Rates for the U.S. and Regions: 1965 to Present”
and imported to this Google Sheet.
*
Annual Homeownership Rates for the United States and Regions, 1968-2015
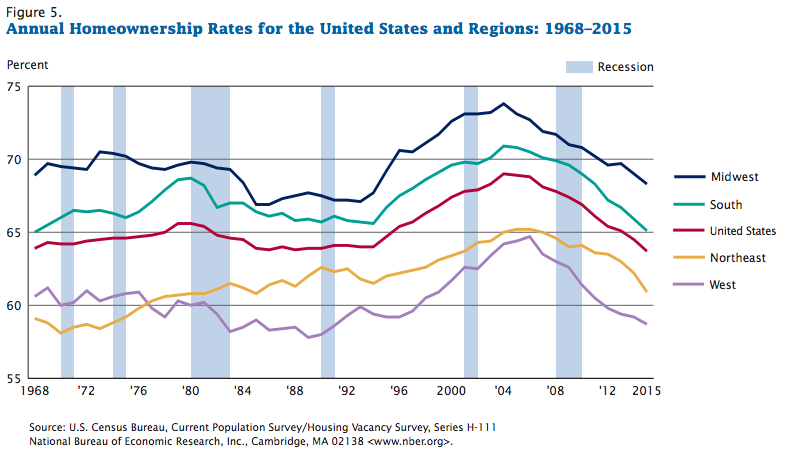
src:
US Census Bureau. Accessed May 16, 2016.
Current Population Survey/Housing Vacancy Survey, Series H-111.
*
Annual Homeownership Rates for the United States by Age Group, 1982-2015

src:
US Census Bureau. Accessed May 16, 2016.
Current Population Survey/Housing Vacancy Survey, Series H-111.
Housing Starts
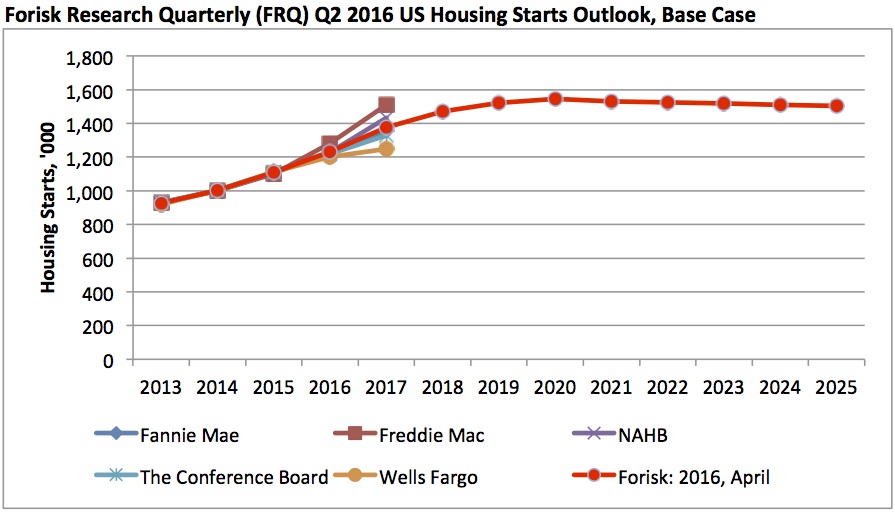
Forisk provides consulting services to the forest industry, wood bioenergy and timberland investing sectors.
src:
Brooks Mendell. April 22, 2016. “Forisk Forecast: US Housing Starts Outlook, Q2 2016 Update.” Forisk.
*
2011-2017 Housing Starts, New Single Family Sales, Existing Single-Family Home Sales, Interest Rates
src:
NAHB. “Housing and Interest Rate Forecasts”
Accessed May 16, 2016 via the NAHB Forecasts page.
Exported to this Google Sheet.
*
New Housing Units Started in the United States
Note: Possible to infer multifamily starts from this chart by subtracting the single-family starts from total starts.
src:
“New Residential Construction”
US Census Bureau. Accessed May 18, 2016.
Data likely comes from one of these time series, for example, which go back to 1959.
Second Homes
Vacation Homes – United States, 1940-2000 (decadal data only)
Aggregated in the following Google Sheet.
src:
US Census Bureau. Accessed May 20, 2016.
“Historical Census of Housing Tables: Vacation Homes”
Note: the Census Bureau has annual data in individual annual reports, but this is the best aggregation I’ve found so far.
*
Excerpt:
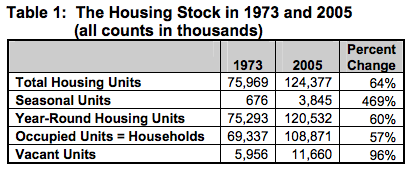
Year-round units are either occupied or vacant. Note that “occupied” and “vacant” have precise definitions that do not coincide exactly with the common understanding of these words. A house may have one or more persons living in it, but if those persons typically reside somewhere else, the house is considered vacant from the perspective of the AHS. The decennial censuses use the same logic because this approach ensures that every household has one and only one place where it “resides,” and the approach also results in the number of households being equal to the number of occupied housing units.
Using this logic, a unit is vacant if it is not the “usual residence” of some household. Defined this way, a vacant unit is in some sense an excess unit—like having more chairs than children in a game of musical chairs. Table 1 shows that vacant units grew almost twice as fast as households between 1973 and 2005. This fact, combined with the growth in seasonal units, accounts for the increase in the ratio of housing units to households.
Data points aggregated in the following Google Sheet.
src:
Frederick J. Eggers, et al. October 2007.
“32 Years of Housing Data.” P.4-5, A2-A8
U.S. Department of Housing and Urban Development
*
Second home ownership: Number of people living in households that own a second home in the United States (USA) from spring 2008 to spring 2015 (in millions)
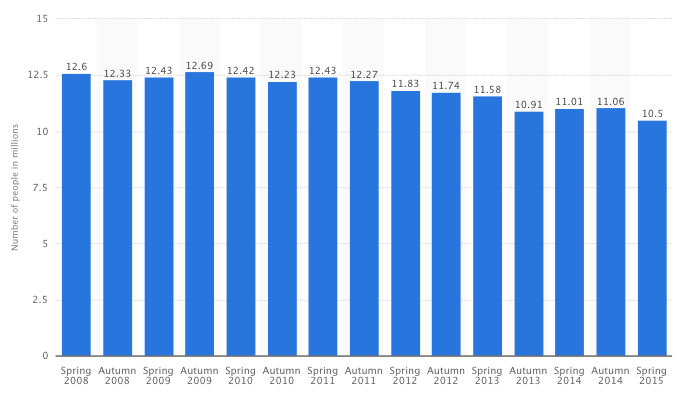
This statistic illustrates the number of people living in households that own a second home in the United States (USA) from spring 2008 to spring 2015. In spring 2008, the number of people who said they live in a household that own a second home in the United States (USA) amounted to around 12.60 million.
src:
Statista (source hidden). Accessed May 23, 2016.
“Second home ownership: Number of people living in households that own a second home in the United States (USA) from spring 2008 to spring 2015 (in millions)”
Note: I suspect the data either comes from the Census Bureau or the Survey of Consumer Finances, but I haven’t found the exact report/indicator.
*
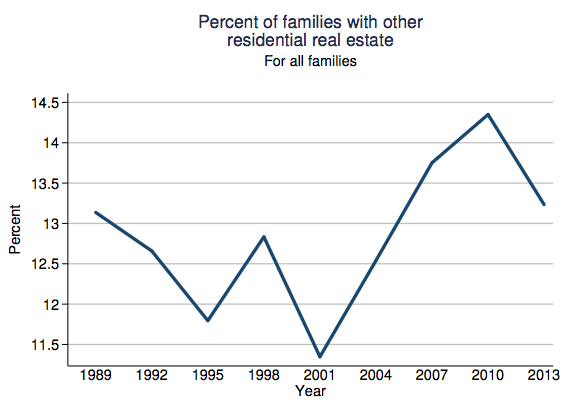


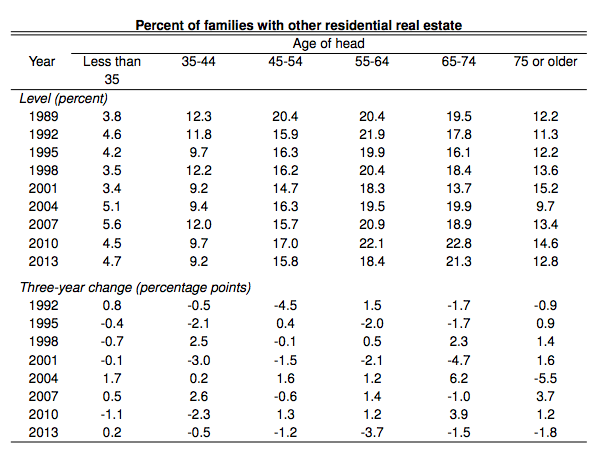

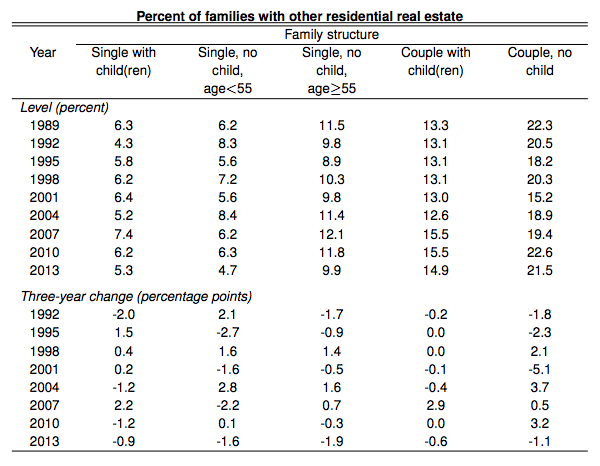

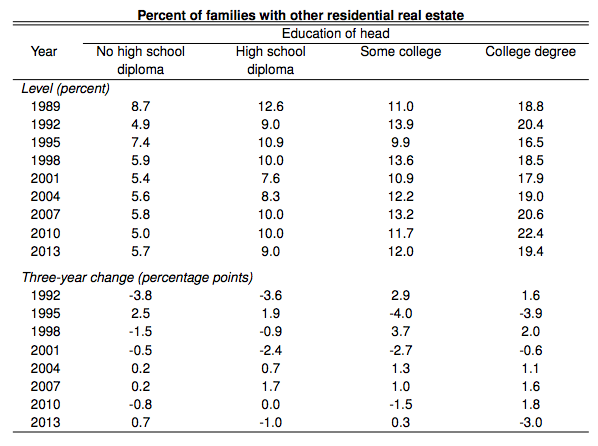
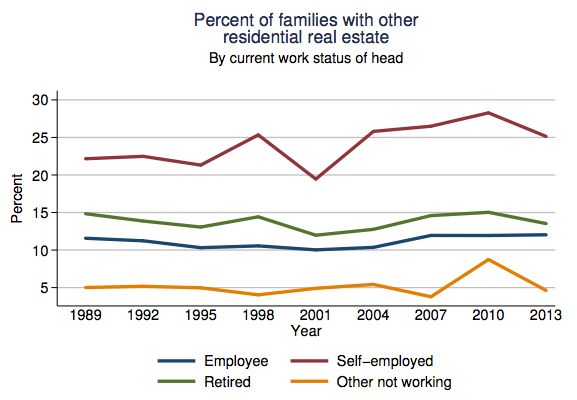


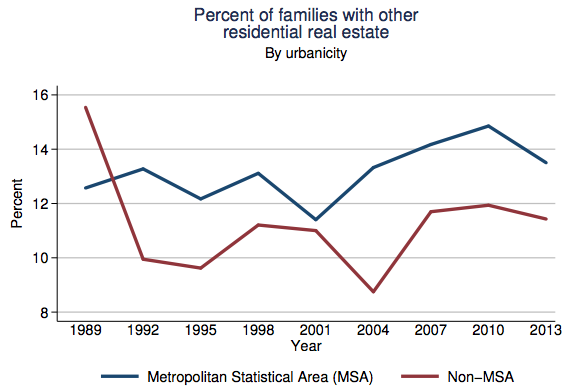


src:
Survey of Consumer Finances. September 2, 2014.
“2013 SCF Chartbook.” The 2013 Survey of Consumer Finances.
The Federal Reserve.
P.651-683
*
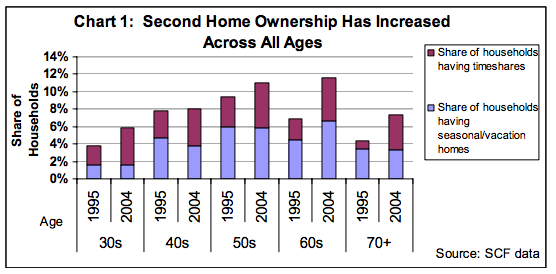
src:
Eric S. Belsky, et al. 2006.
“Multiple-Home Ownership and the Income Elasticity of Housing Demand.”
Joint Center for Housing Studies Harvard University.
citing Survey of Consumer Finances
Note: The source explains that the American Household Survey, the Housing Vacancy Survey, and the decennial Census all include estimates of the number of second home units. Surveys that ask households about whether they own additional properties include: The American Housing Survey; the Survey of Consumer Finances (SCF); the Survey of Income and Program Participation (SIPP), the Panel Study of Income Dynamics (PSID), and industry surveys such as one of new homebuyers conducted by the National Association of Home Builders (2000) and by the National Association of Realtors® (NAR) of homebuyers and homeowners. However, the SCF, conducted by the Federal Reserve Bank, is the only survey conducted on a regular basis (every three years).
Urban/Rural Distribution of Homes
Excerpt:
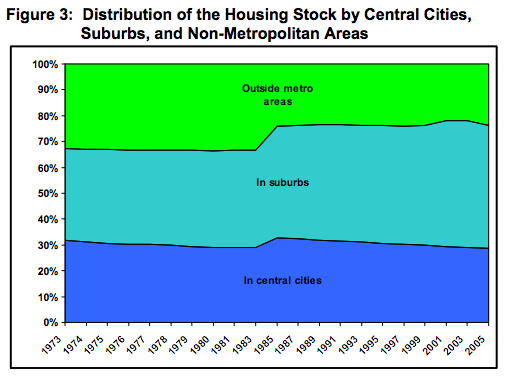
Figure 3 traces the changing shares of the housing stock in “outside metropolitan” areas, in suburbs, and in central cities. The over-the-period changes coincide with expectations; the suburban share is substantially larger in 2005, while the shares in central cities and outside metropolitan areas are smaller. However, the trends are not smooth. The share outside metropolitan areas falls sharply between 1983 and 1985, and the central city share generally declines except for a one-time increase between 1983 and 1985. The discontinuities between 1983 and 1985 result from the introduction of new definitions of metropolitan area—changes that increased the population in central cities and suburbs at the expense of the non-metropolitan population. By 2005, suburbs accounted for 47 percent of the housing stock, central cities for 29 percent, and outside metropolitan areas for 24 percent.
src:
Frederick J. Eggers, et al. October 2007.
“32 Years of Housing Data.” P.7.
U.S. Department of Housing and Urban Development
Housing Features
Highlights of Annual 2014 Characteristics of New Housing
Summary of characteristics for new single family homes, multifamily units, and multifamily buildings in 2014.
src:
US Census Bureau. Accessed May 18, 2016.
“Highlights of Annual 2014 Characteristics of New Housing”
*
For the data from the US Census Bureau below, the following definitions may be relevant:
RSE/SE – Relative Standard Error (percent), Standard Error (percentage points)
NA – Not available
A – Represents an RSE or SE that is greater or equal to 100 percent or could not be computed
Z – Less than 500 units or less than 0.5 percent
S – Withheld because estimate did not meet publication standards on the basis of response rate
or a consistency review
The Census data below is all also accessible through the Census Bureau’s “New Single-Family Homes in 2014” interactive graphic. Data for completed (but not necessarily sold) home are also available via that graphic.
Principal Type of Exterior Wall Material of New Single-Family Houses Sold, 1978-2014
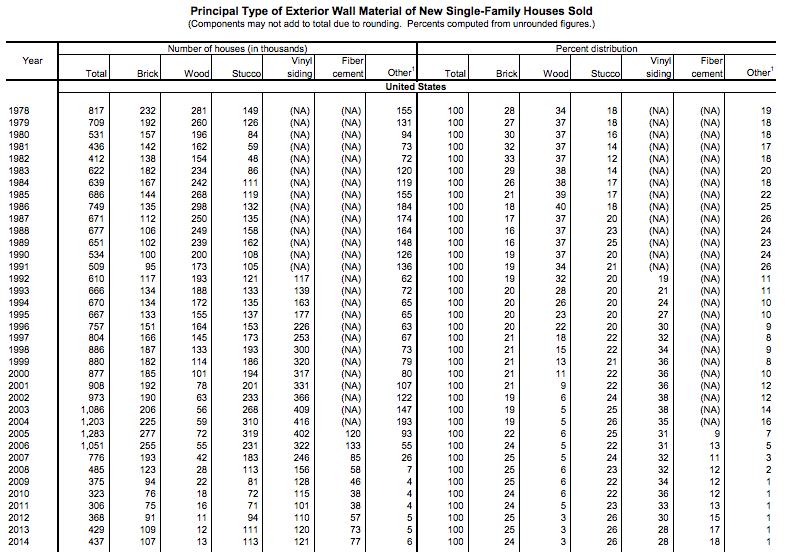
Note 1: Includes concrete block, stone, aluminum siding, and other types.
Data prior to 2005 include fiber cement. Data prior to 1992 include vinyl siding.
src:
US Census Bureau. Accessed May 16, 2016.
“Principal Type of Exterior Wall Material of New Single-Family Houses Sold.” P.1.
*
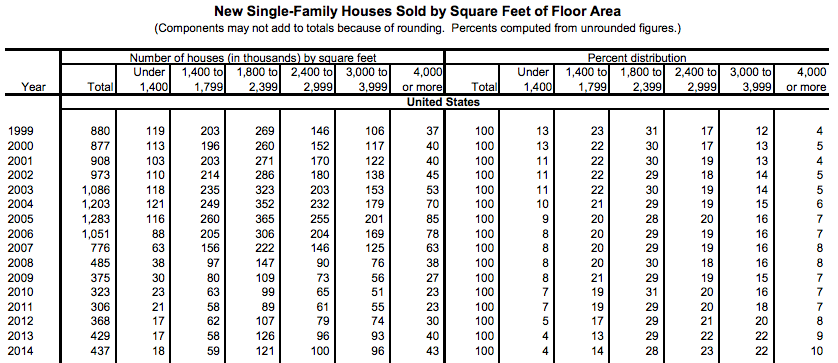
Square Feet of Floor Area in New Single-Family Houses Sold, 1999-2014
src:
US Census Bureau. Accessed May 16, 2016.
“Square Feet of Floor Area in New Single-Family Houses Sold.” P.1.
*
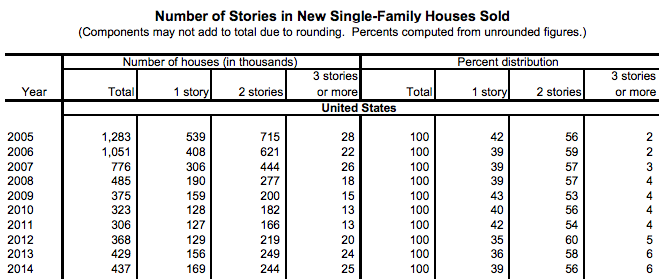
Number of Stories in New Single-Family Houses Sold, 2005-2014
src:
US Census Bureau. Accessed May 16, 2016.
“Number of Stories in New Single-Family Houses Sold.” P.1.
*
Number of Bedrooms in New Single-Family Houses Sold
1973-2014
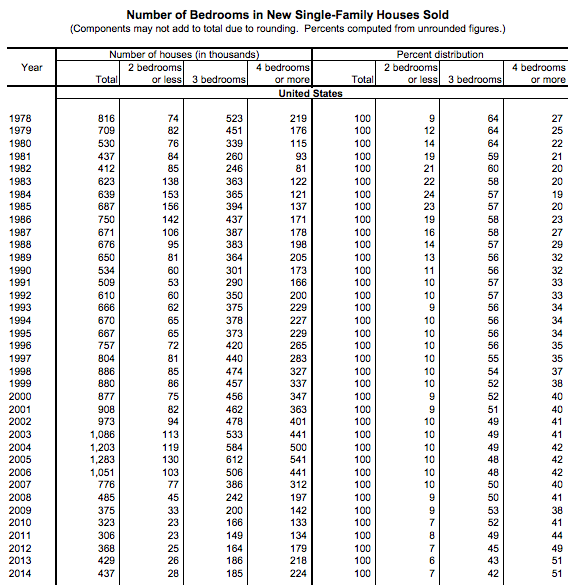
src:
US Census Bureau. Accessed May 16, 2016.
“Number of Bedrooms in New Single-Family Houses Sold.” P.1.
*
Number of Bathrooms in New Single-Family Houses Sold, 1978-2014
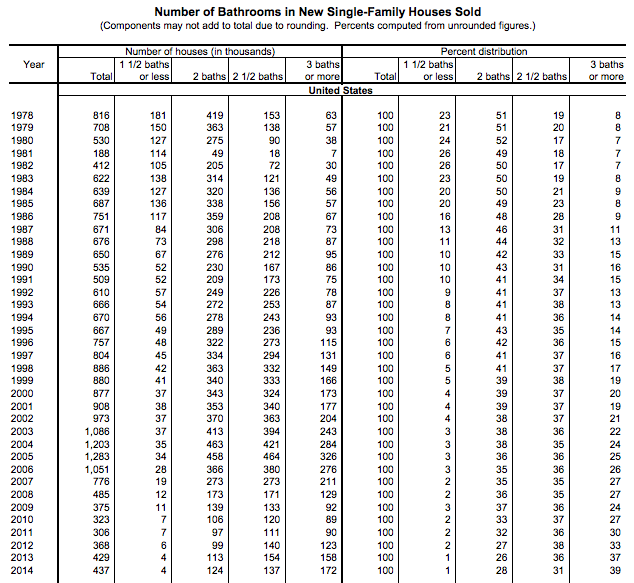
src:
US Census Bureau. Accessed May 16, 2016.
“Number of Bathrooms in New Single-Family Houses Sold.” P.1.
*
Presence of Air-Conditioning in New Single-Family Houses Sold, 1978-2014
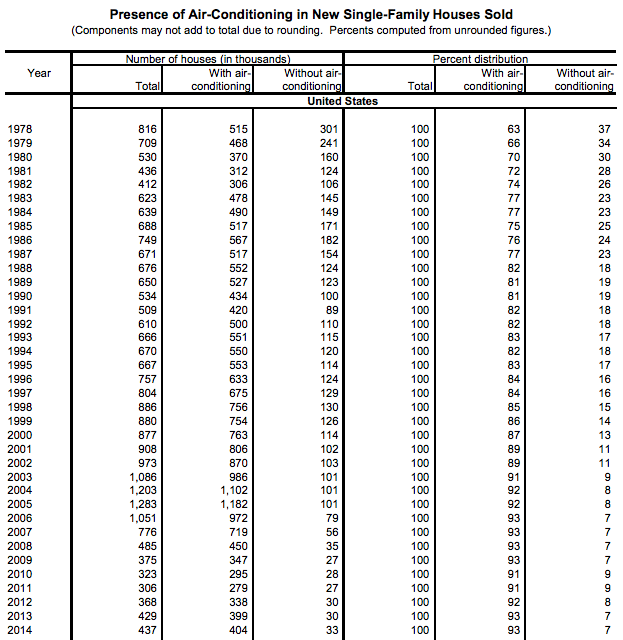
src:
US Census Bureau. Accessed May 16, 2016.
“Presence of Air-Conditioning in New Single-Family Houses Sold.” P.1.
*
Number of Fireplaces in New Single-Family Houses Sold, 1978-2014
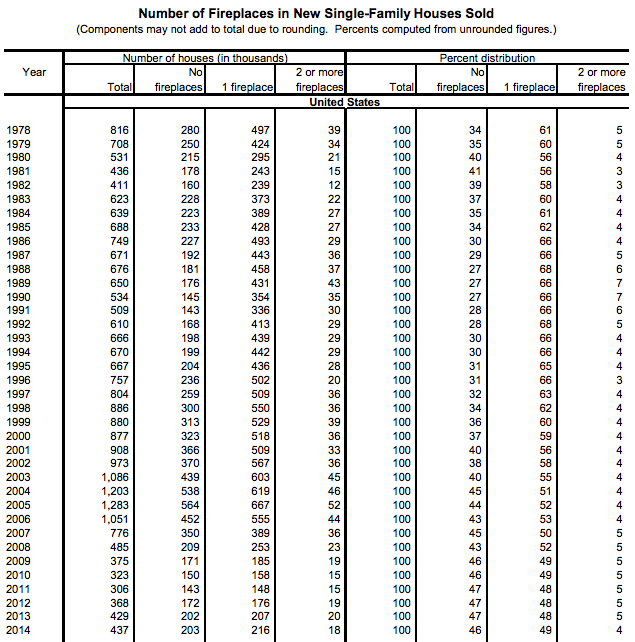
src:
US Census Bureau. Accessed May 16, 2016.
“Number of Fireplaces in New Single-Family Houses Sold.” P.1.
*
Type of Heating System Used in New Single-Family Houses Sold, 1978-2014
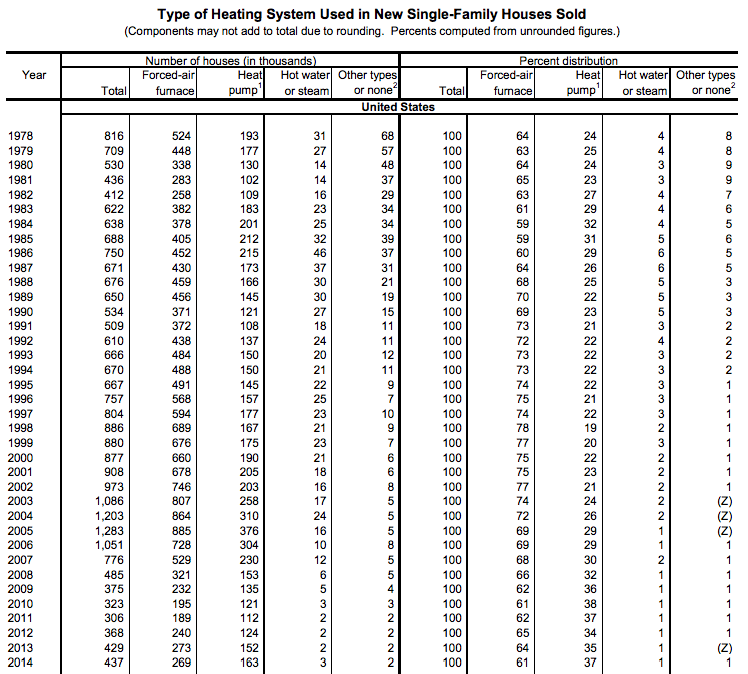
Note 1: Includes both air source and geothermal (ground source) versions.
Note 2: Includes electric baseboard, panel, radiant heat, space heater, floor or wall furnace, solar, and other types.
src:
US Census Bureau. Accessed May 16, 2016.
“Type of Heating System Used in New Single-Family Houses Sold.” P.1.
*
Type of Heating Fuel Used in New Single-Family Houses Sold, 1985-2014
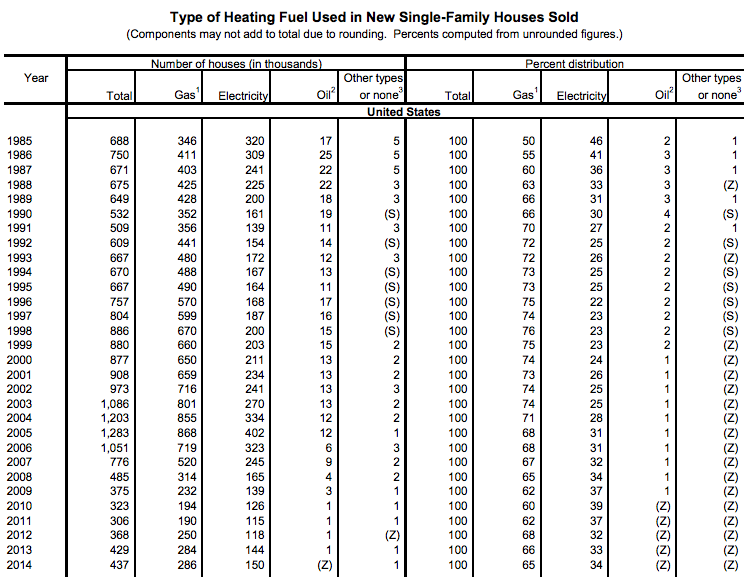
Note 1: Includes natural gas and bottled or liquified petroleum gas (including propane).
Note 2: Includes heating oil and kerosene.
Note 3: Includes wood, coal, solar, and other types. Beginning in 2014, also includes heating oil and kerosene.
src:
US Census Bureau. Accessed May 16, 2016.
“Type of Heating Fuel Used in New Single-Family Houses Sold.” P.1.
*
Type of Foundation in New Single-Family Houses Sold, 1978-2014
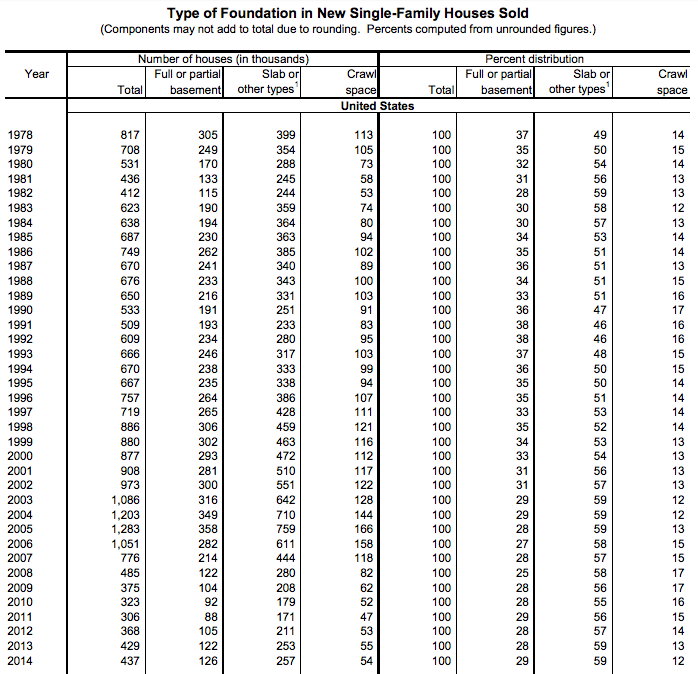
Note 1: Includes raised supports such as pilings and piers, and other types.
src:
US Census Bureau. Accessed May 16, 2016.
“Type of Foundation in New Single-Family Houses Sold.” P.1.
*
Type of Parking Facility of New Single-Family Houses Sold, 1986-2014
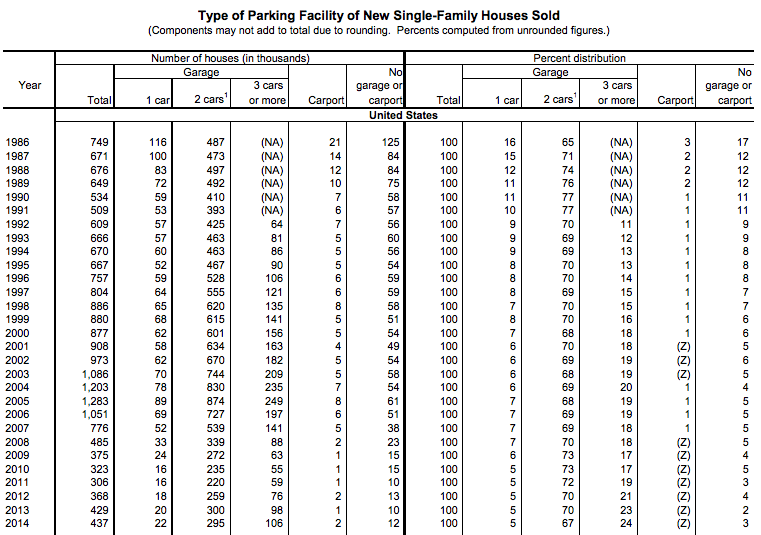
Note 1: Prior to 1992, data included 2 cars or more.
src:
US Census Bureau. Accessed May 16, 2016.
“Type of Parking Facility of New Single-Family Houses Sold.” P.1.
*
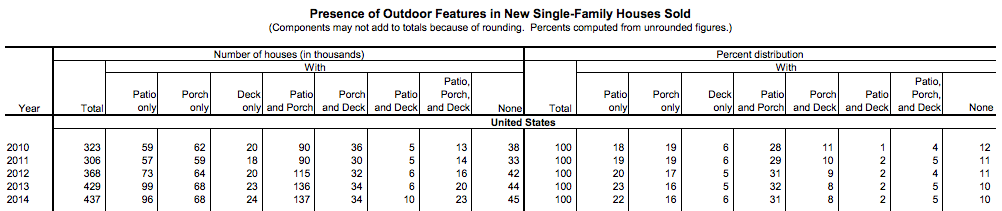
Presence of Outdoor Features in New Single-Family Houses Sold, 2010-2014.
src:
US Census Bureau. Accessed May 16, 2016.
“Presence of Outdoor Features in New Single-Family Houses Sold.” P.1.
*
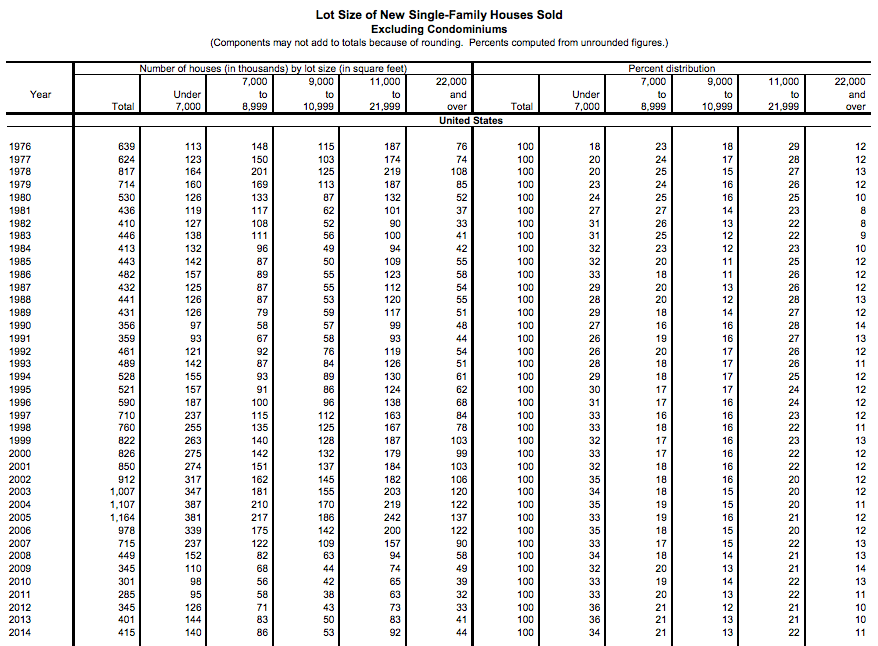
Lot Size of New Single-Family Houses Sold, 1976-2014
src:
US Census Bureau. Accessed May 16, 2016.
“Lot Size of New Single-Family Houses Sold.” P.1.
*
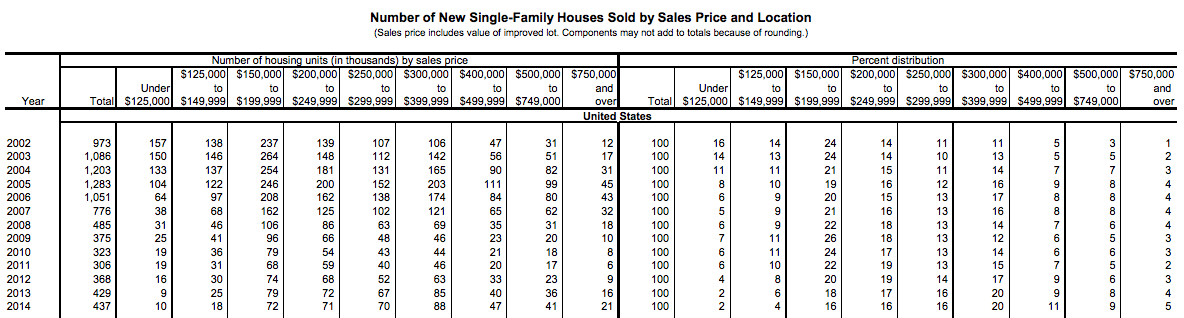
Number of New Single-Family Houses Sold by Sales Price, 2002-2014
src:
US Census Bureau. Accessed May 16, 2016.
“Number of New Single-Family Houses Sold by Sales Price and Location.” P.1.
*
Number of Multifamily Units Completed by Number of Units Per Building, 1972-2014
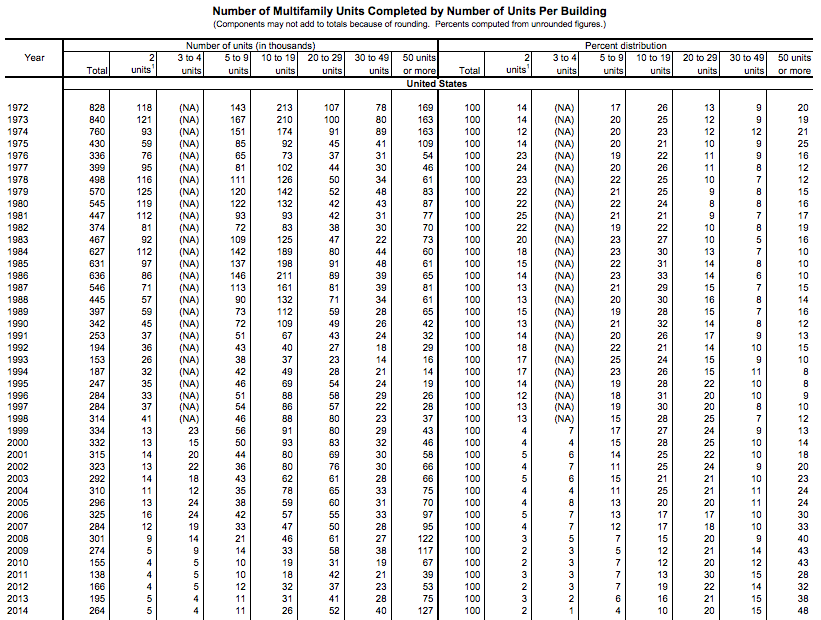
Also available in the PDF linked below: Multifamily units completed for Rent vs Sale, 1999-2014
src:
US Census Bureau. Accessed May 18, 2016.
“Number of Multifamily Units Completed by Number of Units Per Building”
*
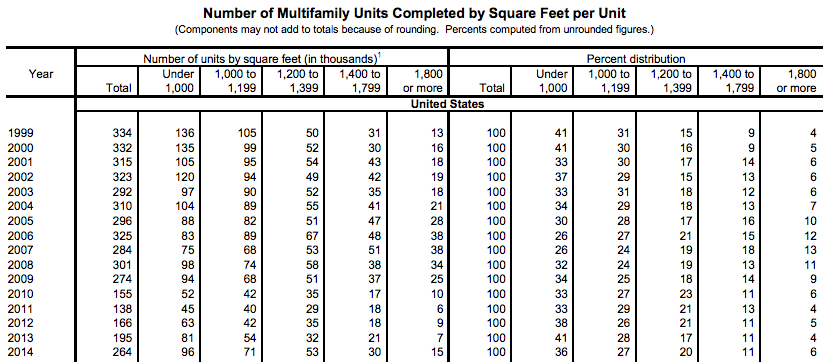
Number of Multifamily Units Completed by Square Feet per Unit, 1999-2014
src:
US Census Bureau. Accessed May 18, 2016.
“Number of Multifamily Units Completed by Square Feet per Unit”
*
More characteristics of units in multifamily units and buildings available from the US Census Bureau, here: Multifamily Units, Multifamily Buildings
*
American Housing Survey
Survey run since 1973, but haven’t found a source for aggregated historic data
All annual reports available here.
Indicators present in the 1973 report
Number of all housing units (numbers back to 1970)
Number of unites in structure (back to 1973)
Median number of rooms per unit (total, owner, renter)
Percent with two bedrooms (total, owner, renter)
Percent with 3 bedrooms or more (total, owner, renter)
Percent with 1.01 or more persons per room (total, owner, renter)
2-or-more-person households (total, owner, renter)
male head-wife present, no nonrelatives (total, owner, renter)
other male head (total, owner, renter)
female head (total, owner, renter)
1-person households (total, owner, renter)
owner-occupied unites (total, in central cities, no in central cities, non-metropolitan)
renter-occupied units (same as above)
Median value (1973 vs 1970)
Median gross rent (1973 vs 1970)
Median income (owner-occupied, renter-occupied, 1973 vs 1970)
src:
US Census Bureau. July 1975.
“Annual Housing Survey: 1973 — Part A, General Characteristics”
Households
Total Number of US Households 1960-2015 (in millions)
src: Statista. Accessed May 18, 2016.
Note: This /has to be/ Census data.
TO-DO: locate Census source and import data to a Google Sheet.
*
Households makeup forecast to 2035
Uses 2013 Census Bureau data to make 5-year projections from 2015 to 2035. Low, middle, and high projections given.
Includes households by age and race forecasts. Projects total households, married w/o children, married with children, partnered w/o children, partnered with children, single-parent w/o other adults, single-parent with other non-partner adults, single person households, and other households.
src:
Daniel McCue. March 2014.
“Baseline Household Projections for the Next Decade and Beyond.”
Joint Center for Housing Studies, Harvard University.
Click “Household Projection Tables” at the bottom of the page for the original Excel file. Also imported into this Google Sheet.
Home Sales and Spending
New Single-Family Home Sales
1978-2012 – chart with line only, no numeric figures for individual years
[NAHB-NewSFHSales-1978-2011.jpg]
src:
“New Home Sales”
NAHB, Accessed May 16, 2016
Annual Numeric values for 2011-2015 available here
src:
“New and Existing Home Sales, U.S.”
NAHB, April 25, 2016
US Census Bureau – New Residential Sales, Historical Data
linking out to…
Houses Sold by Region – Annual Data, 1963-2015
Includes US total for each year
src:
US Census Bureau
Houses for Sale by Region, 1963-2015
Median and Average Sales Prices of New Homes Sold in United States, 1963-2015
Houses Sold by Type of Financing, 1988-2015
Private Residential Construction Spending Index, 2000-2016
line chart with lines for
single-family
multifamily
improvements
Index, with 1/1/2000 as the base
Chart shows multifamily housing with the strongest growth in the last two years, improvements as the most stable over the whole period.
src:
Na Zhao. May 2, 2016. “Multifamily Spending Continues Record Breaking Pace.” NAHB Eye on Housing.
The Science of Forecasting and Prediction
Last week we were fortunate to have had one of the foremost statistical forecasters in the world, Dr. Rob Hyndman, join us for a Big Thinkers talk on the science of forecasting and prediction. Dr. Hyndman delivered a captivating seminar called, “Exploring the boundaries of predictability: what can we forecast, and when should we give up?”
In his talk, Dr. Hyndman discussed his research efforts to realize his long-term goal of understanding what models work best at predicting various types of time-series. Professor Hyndman demonstrated the aspects that make certain time-series more predictable than others by giving real-life examples based on his own research and work consulting for the Australian government. He explored different features that can be extracted from time-series and how they can be used to judge if something is predictable. Professor Hyndman also talked about his work with Yahoo Labs on Anomaly Detection and how extracted time-series features can be used for finding anomalies. While Dr. Hydnaman’s goal of finding the right time-series model for a given dataset is still under active pursuit, his work on anomaly detection in collaboration with Yahoo Labs has already been open-sourced.
The event was broadcast live on our labs.yahoo.com homepage and viewers had the opportunity to ask questions and comment on our Twitter stream @YahooLabs as well as our Facebook page.
If you would like to learn what it takes to forecast and accurately predict the future, watch the full seminar here.

Great overview of basic forecasting methodology from Rob Hyndman.
Rule of thumb – ok to forecast ahead a third of the length of your data. So, if you have 15 years of data, a five-year forecast should be pretty reliable. But doing a 20 year forecast based on 15 years of data is going to be pretty unreliable.
Sick Days and Chronic Illness
I consulted a few different sources of information for illness statistics. The Bureau of Labor Statistics has a very small sample of sick-leave used data (for 2009). Gallup and Healthways also have a small sample of sick-leave data (for 2012). No forecasts are available. Several think tanks are tracking reported rates of chronic illness. A couple forecasts are available. Results are summarized below.
Sick Days
In 2012, researchers from the Bureau of Labor Statistics conducted a one-time tabulation of sick leave provision and usage. The data used were compiled from the 2009 National Compensation Survey, looking only at full-time workers in private industry.
The researchers averaged the amount of sick leave used in each of 6 industry areas (financial activities; information industry; trade, transportation, and utilities; professional and business services; leisure and hospitality; construction). In the first four of those industries, workers used an average of 4 days of sick leave per year. In the last two industries (leisure and hospitality, and construction), workers used an average of 2 days of sick leave per year.
This was a one-time tabulation. Jason Ford says by email that he’s not aware of any forecasts. To his knowledge, additional years of this data are not available.
Src:
Ross O. Barthold, Jason L. Ford. 2012 February 29. “Paid Sick Leave: Prevalence, Provision, and Usage among Full-Time Workers in Private Industry.” Bureau of Labor Statistics.
*
2012 survey data of workers in 14 job categories found that usage of sick days ranged from 6 days per year to 3 days per year. The survey was conducted by Gallup and Healthways as part of Healthways’ annual Well-Being Index report. The survey was administered to 94,000 Americans who work at least 30 hours per week.
Days missed per month
Physicians: .24
Farmers, Foresters, Fishers: .25
Construction or Mining: .28
Installation/Repair: .35
Sales: .35
Managers/Executives: .36
Professionals: .37
Manufacturing/Production: .38
School Teacher: .39
Transportation: .40
Business Owners: .41
Nurses: .43
Clerical or Office Workers: .44
Service Workers: .47
Note: 24/7 Wall St. performed the analysis of data collected by Gallup-Healthways. Emailed Healthways (9/25) to see if they’re still collecting this data.
Src:
Michael B. Sauter, Samuel Weigley and Alexander E.M. Hess. 2013 May 9. “Workers Taking the Most Sick Days.” 24/7 Wall St.
Well-Being Index
Gallup and Healthways have compiled their Well-Being Index annually since 2008. It’s a “barometer of Americans’ perceptions of their well-being.” The index is compiled based on survey responses to questions about six areas of life: life evaluation, emotional health, work environment, physical health, healthy behavior, basic access.
Physical Health Index
2008 76.9
2009 76.6
2010 76.9
2011 76.7
2012 77.0
2013 76.4
The Physical Health Index is comprised of questions related to: Body Mass Index, disease burden, sick days, physical pain, daily energy, history of disease, and daily health experiences.
Overall Well-Being Score
2008 66.5
2009 66.3
2010 66.8
2011 66.2
2012 66.7
2013 66.2
Over the six years of our well-being measurement, Americans’ life evaluations have improved, emotional health and healthy behaviors have remained stable, and basic access, physical health, and work environment have declined. While there are dozens of trends that have impacted the national score since 2008, the three most prominent ones are:
* Annual decreases in the rate of those with health insurance;
* Rising rates of obesity;
* Declining work environment scores.
Src:
Gallup-Healthways Well-Being Index. 2014. “State of American Well-Being.”
Chronic Disease Rates
In 2008, The Milken Institute found that one third of Americans reported having at least one of seven common chronic diseases, with a total of 162.2 million cases in 2003. They forecasted a 42% increase in cases of those diseases by 2023, for a total of 230.7 million cases.
Of the seven chronic diseases, pulmonary conditions were the most common, with 49.2 million cases recorded. Next in prevalence were hypertension, with 36.8 million recorded cases, and mental disorders, with 30.3 million; followed by heart disease at 19.2 million; diabetes at 13.7 million; cancer at 10.6 million; and stroke at 2.4 million.
Src:
Ross DeVol, Armen Bedroussian. 2007. “An Unhealthy America: The Economic Burden of Chronic Disease.” Milken Institute.
*
In 2009, almost half of Americans, 145 million people, had at least one chronic condition. This represented an increase of 10 million people over the estimate that was made in 2002 for the year 2009.
The number of people with chronic conditions reached 125 million in 2000, forecast to reach 147 million by 2010 and 157 million by 2020. By 2030 half the population will have one or more chronic conditions.
Src:
2010. “Chronic Care: Making the Case for Ongoing Care.” Robert Wood Johnson Foundation.
*
Prevalence of Chronic Disease in the U.S. Population
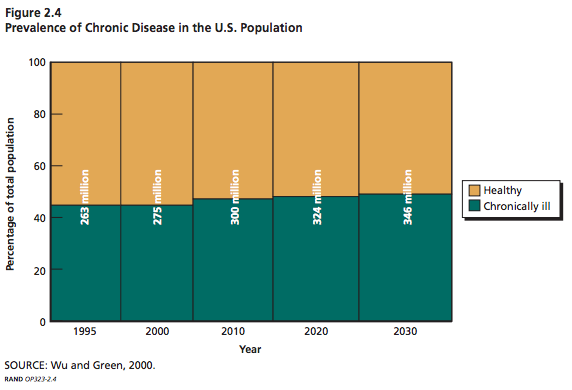
Millions of Americans
Src: Wu, Shin-Yi and Anthony Green. Projection of Chronic Illness Prevalence and Cost Inflation. RAND Corporation; October 2000. (unavailable online)
Cited in:
Soeren Mattke, Lisa Klautzer, Tewodaj Mengistu, et al. 2010. “Health and Well-Being in the Home.” RAND Corporation.
and
The Marshall Protocol Knowledge Base. 2012. “Incidence and Prevalence of Chronic Disease.” Autoimmunity Research Foundation.
Per Capita Rx Usage
Current data
Evaluate and IMS Health both track current and recent rates of drug prescription per capita.
From Evaluate:
2011: 10
2013: 9
src: 2013. Evaluate. Medical Expenditure Panel Survey. Spreadsheet shared by email, 2015 Sep 10.
From IMS Health:
2010: 11.46
2011: 11.33
2013: 12.2
2014: 2.1% more than 2013
Src (2010, 2011): 2012. IMS Institute for Healthcare Informatics. “The Use of Medicines in the United States: Review of 2011.″
Src (2013): 2014. IMS Institute for Healthcare Informatics. “Medicine use and shifting costs of healthcare: A review of the use of medicines in the United States in 2013.″
Src (2014): 2015. IMS Institute for Healthcare Informatics. “Medicines Use and Spending Shifts: A Review of the Use of Medicines in the U.S. in 2014.″
Michael Kleinrock, of IMS, explains via email that Rx usage rates have been very consistent for a very long time. Their data goes back to the early 90s, but the collection of age-band data is a relatively recent addition. They haven’t yet produced harmonized figures showing all of their historic data.
Forecast data
In 2008, a paper published by the Department of Health and Human Services gave forecasts for prescriptions dispensed per visit to the year 2030. Three forecasts were made for prescriptions per physician office visit, per hospital/clinic outpatient visit, and per emergency visit. The forecasts are divided into age bands for patients aged 0-44, 45 to 64, and 65 years and older. The forecasts are all based on analysis of the CDC’s National Ambulatory Medical Care Survey (NAMCS) from 1995 to 2004, with trend extrapolation from 2005 to 2030.
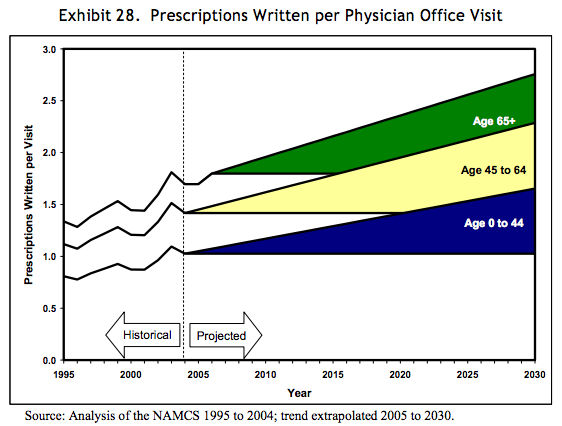
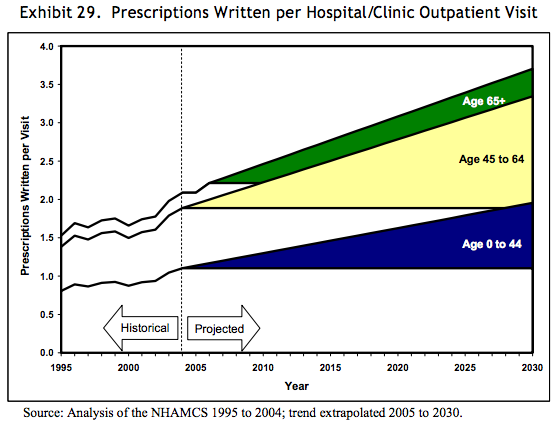

Src: 2008. Department of Health and Human Services. “The Adequacy of Pharmacist Supply: 2004 to 2030.” Exhibits 28-30, pp 31, 32.
Primary Care Office Visits in 2025
“Driven by population growth and aging, the total number of office visits to primary care physicians is projected to increase from 462 million in 2008 to 565 million in 2025. After incorporating insurance expansion, the United States will require nearly 52,000 additional primary care physicians by 2025.”
Src:
Petterson, Stephen M., Winston R. Liaw, Robert L. Phillips, David L. Rabin, David S. Meyers, and Andrew W. Bazemore. 2012. “Projecting US Primary Care Physician Workforce Needs: 2010-2025.” The Annals of Family Medicine 10 (6): 503–9.
The study was based on data from the annual Medical Expenditure Panel Survey (MEPS), conducted by the U.S. Department of Health & Human Services.
In addition to the MEPS data, the CDC also produces annual estimates of physician office visits, as well as hospital visits via it’s National Ambulatory Medical Care Survey (NAMCS) as well as its National Hospital Ambulatory Medical Care Survey (NHAMCS). Tables of recent survey results are available here. We’ve not yet found a forecast for hospital visits, but we’ve aggregated NAMCS and NHAMCS figures going back to 2000 here.
Pharmaceutical Sales Through 2020
EvaluatePharma (life science market research firm) releases an annual report of current pharmaceutical sales figures with forecasts looking 5 years out.
According to the 2015 report, Novartis was the number one pharmaceutical company in 2014 and is forecast to maintain its position in 2020
Other indicators reported:
worldwide prescription drug sales (2006-2020)
regional prescription drug sales
Top 20 Companies by Rx sales in 2020
worldwide R&D spending by company
worldwide Rx drug & OTC sales by therapy area in 2020
Src: “World Preview 2015, Outlook to 2020.” 2015. Evaluate.
They also track sales volume and pricing including cost and volume per patient for the U.S. and other regions. Not available in the free report – contact them.
Media Contacts:
Evaluate and EP Vantage (for general questions)
Christine Lindgren
+1 617-866-3906
christine.lindgren@evaluategroup.com
Chempetitive Group (for U.S. media)
Rachel Wallace
+1 781-775-3640
rwallace@chempetitive.com
State of the Future Index (28 variables)
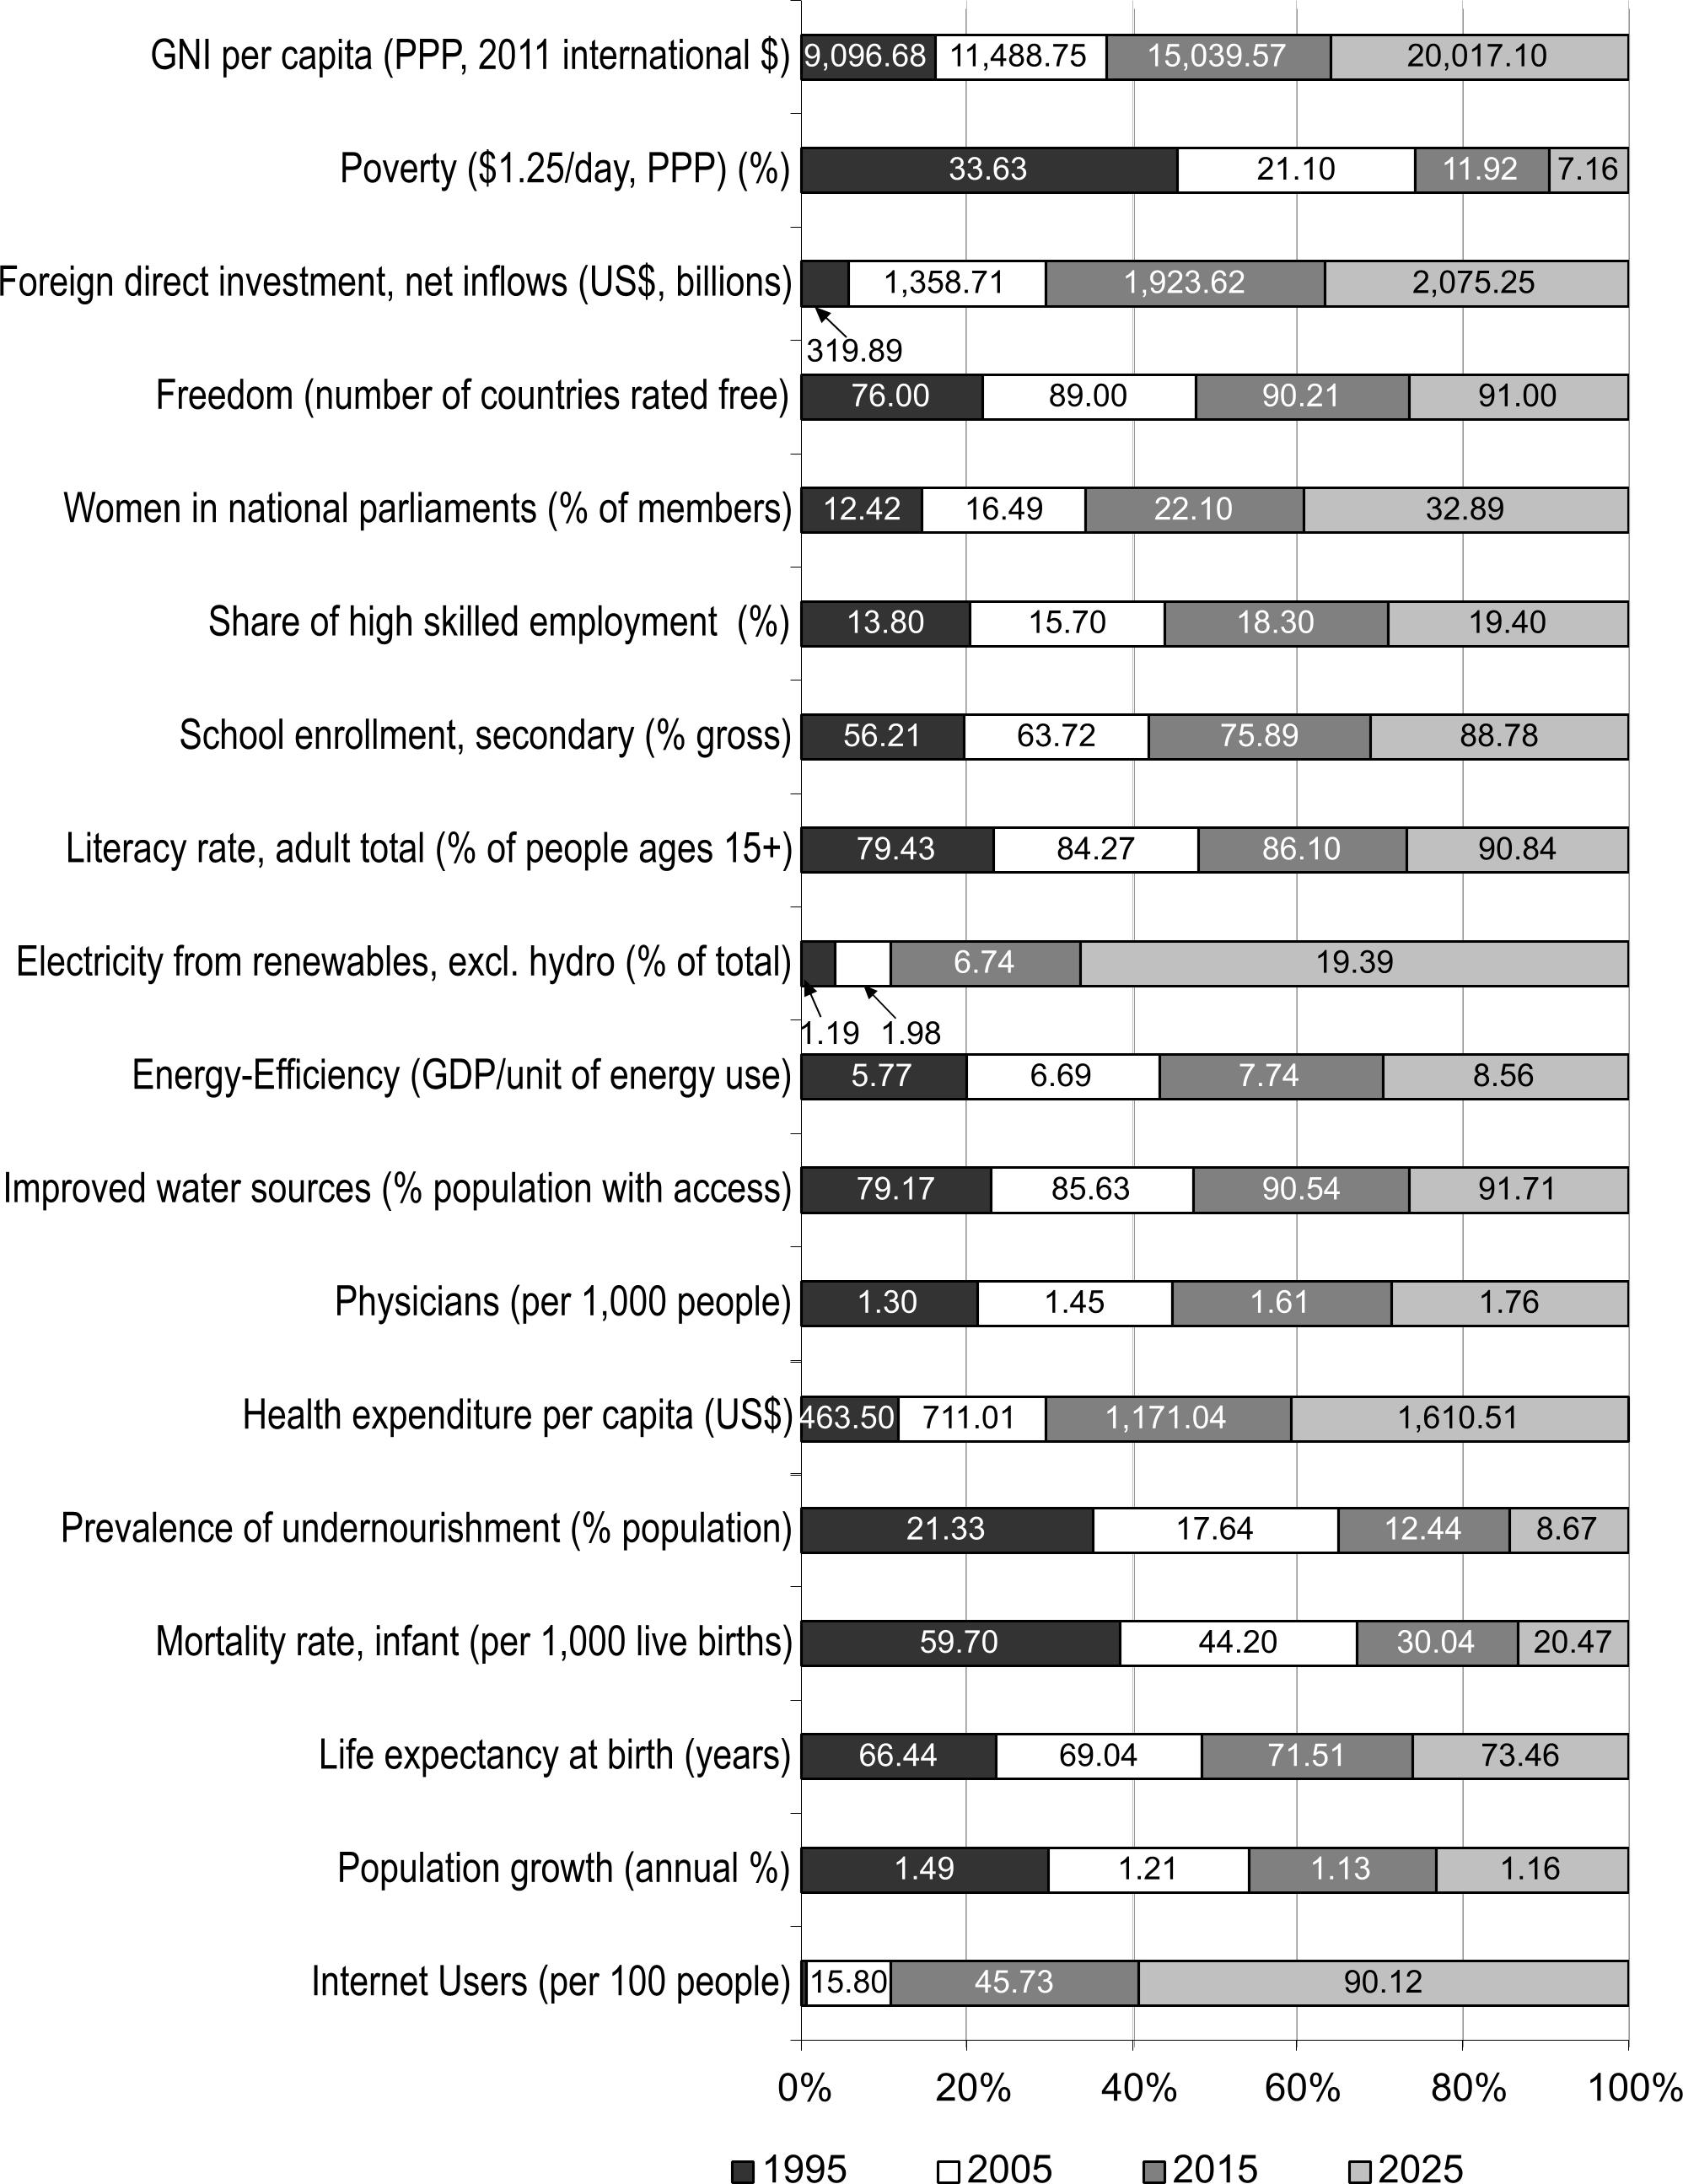
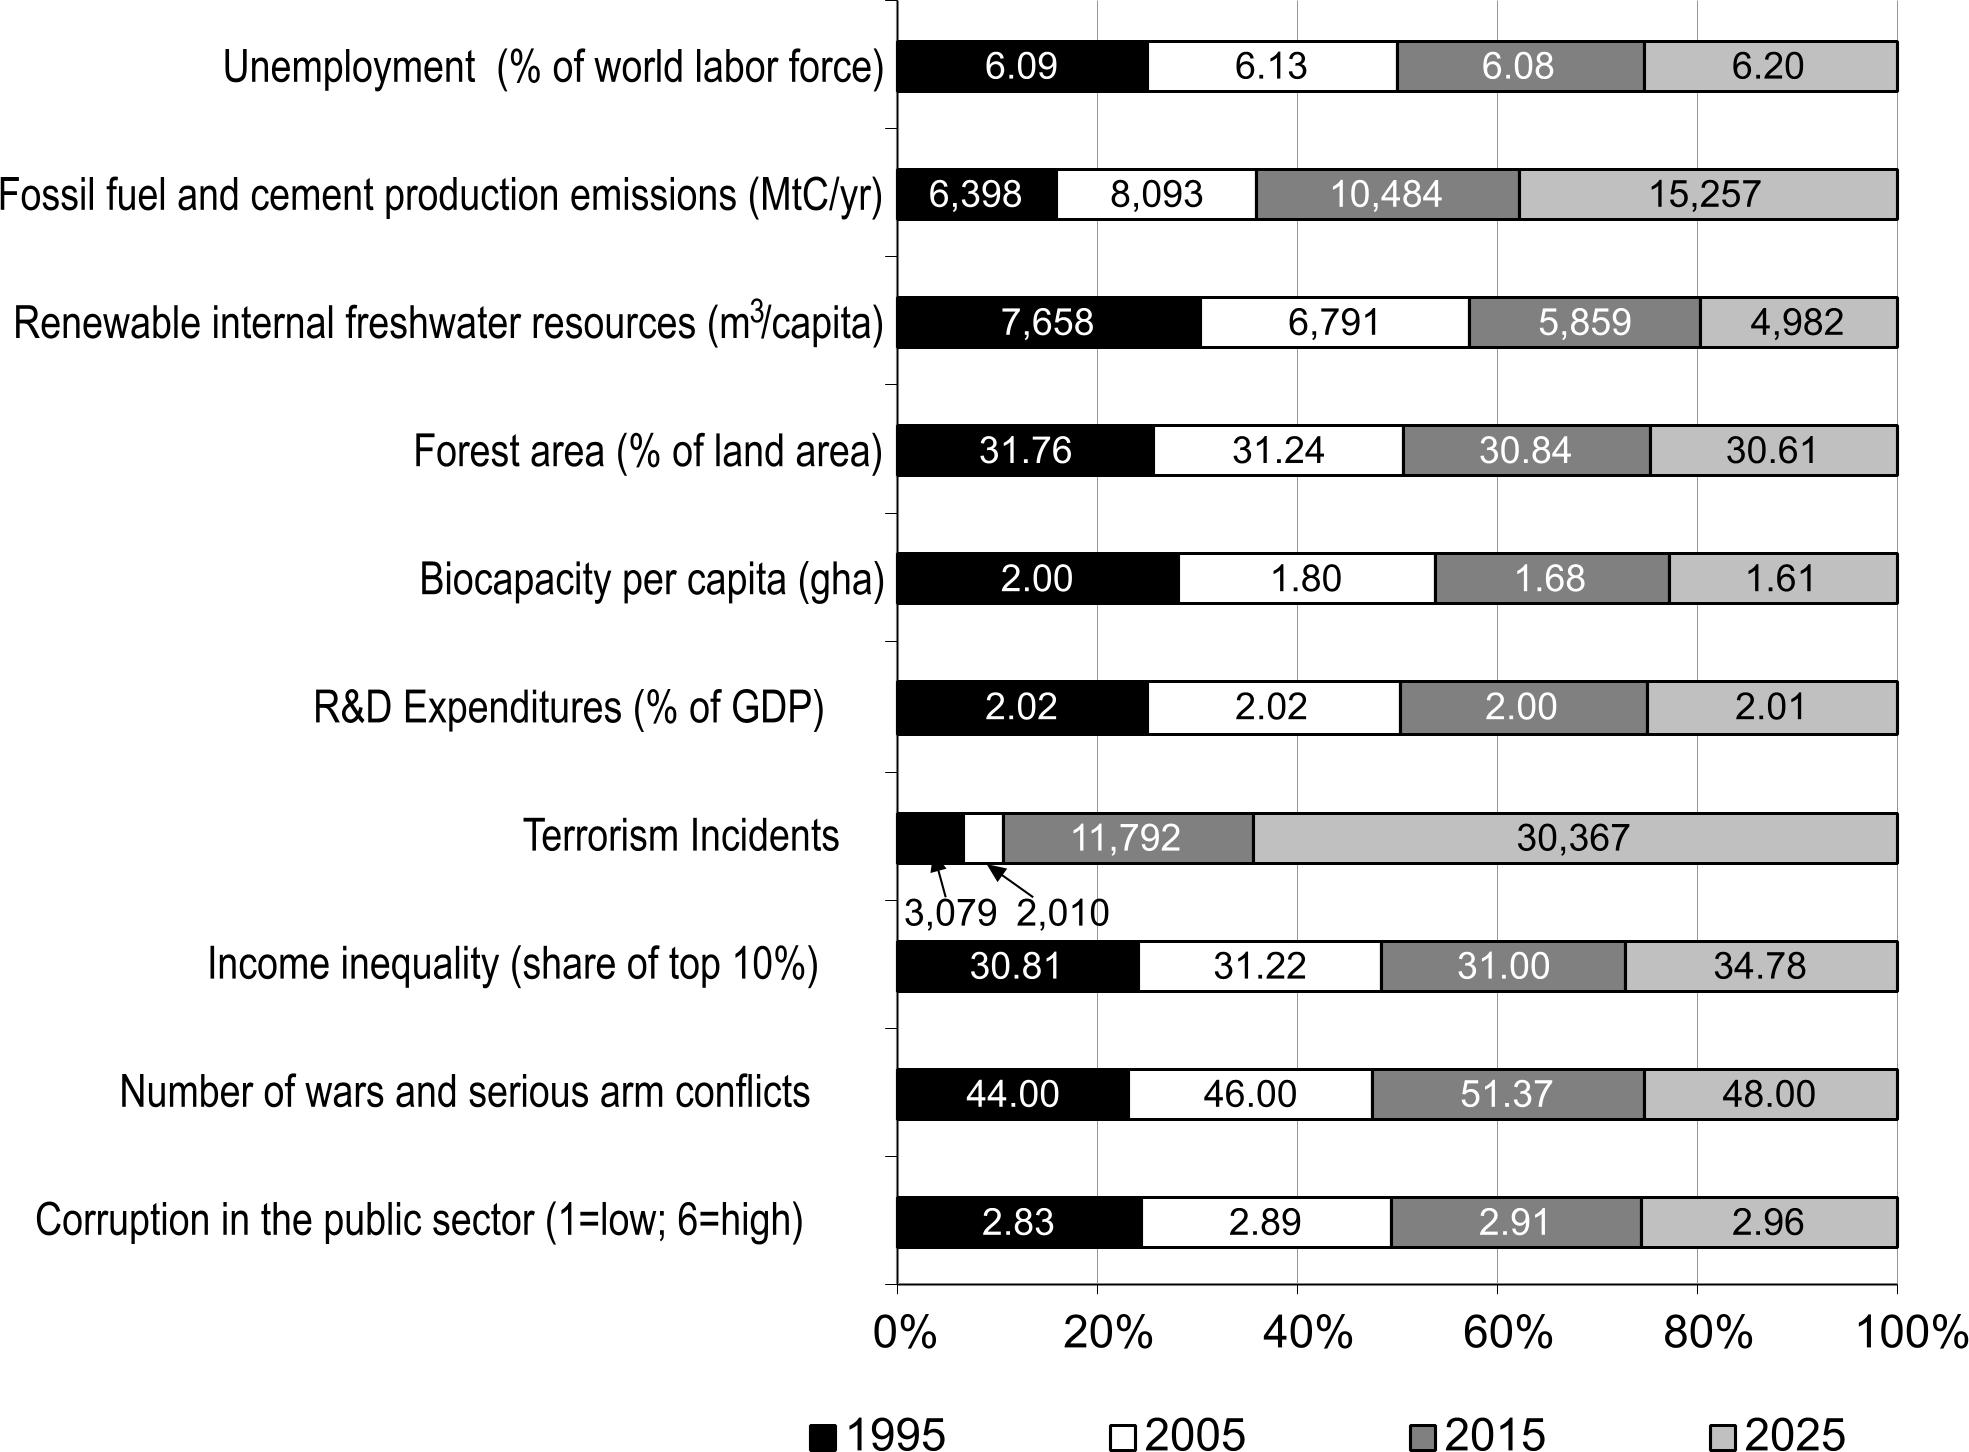
Every year, The Millennium Project (MP) computes a “State of the Future Index” looking 10 years into the future, based on data from the previous 20 or more years. The index calculation is based on values for multiple, individually-forecast key variables (28 in 2015). The index is calculated globally, as well as for individual countries. The overall index is intended to show the direction of things to come.
For our purposes the forecasts for the 28 individual variables are of most interest. MP breaks the variables into two groups: those showing improvement, and those showing decline. The values for the individual variables (previous actual, and forecast) are displayed within the shaded area of the charts.
Areas showing improvement in 2015:
Areas showing decline in 2015:
In 2015, the calculated Index looks like this:
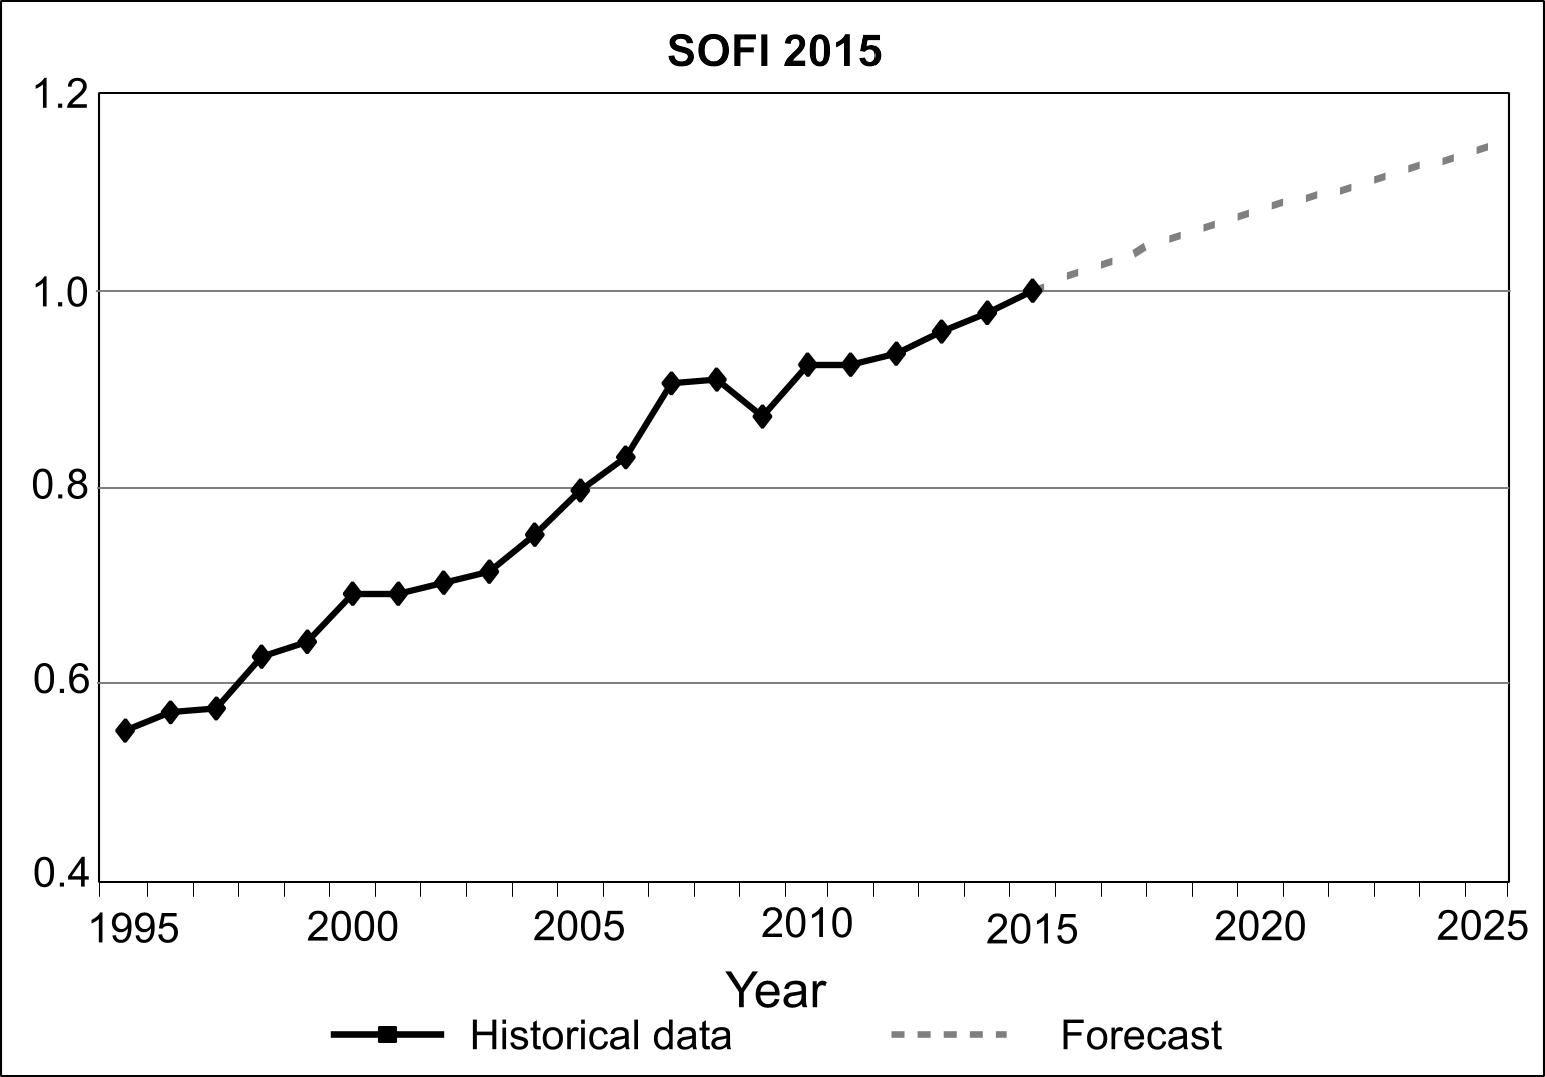
Src: Gordon, Theodore J. 2015. “2015 State of the Future Index.” The Millennium Project.
Charts for each indicator, and a brief indication of the source for the data are in this PDF.
The Millennium Project is an independent non-profit global participatory futures research think tank of futurists, scholars, business planners, and policy makers who work for international organizations, governments, corporations, NGOs, and universities. Their annual report collects and assesses judgments from over 3,000 people selected by its 56 nodes around the world.
THE FUTURE IS ALREADY HERE
Summary of future predictions from 19th century scifi that have come to pass. Focus on Jules Verne and H.G. Wells, but also gives early-mid 20th century examples from Zamayatin, Huxley, and Orwell. (Link goes to a pretty meaty excerpt – full article behind paywall.)
Source: Bædkel, Anne Dencker. October 1, 2014. “The Future Is Already Here.” Scenario, 5.
Benedict Evans on Cars
Benedict Evans made an interesting post recently about the future of cars in the next few decades. Specifically, about what a car is, how it gets made, who owns them.
Evans suggests the the car manufacturing industry may undergo similar organizational and technological shifts to those seen in cell phone manufacturing.
As on-demand car services comprise an increasing share of car purchases, characteristics like flair, design, innovation, fit and finish won’t matter as much.
Self-driving cars will increase supply of on-demand car services. They will also induce many other second-order effects: decreased demand for parking and public transport; more retail spaces (because of less car parking), more visitors to city centers; more traffic congestion (or less b/c of automated traffic optimization); possibly limited transport options for low-income pub transit users; possibly increased biking because it will be safer, or less because of availability/convenience of on-demand cars.
Overall, fewer cars will be sold. Many (maybe most) will be sold to on-demand service providers. Few of them will be luxury models.
Car smarts will increasingly come from software, and that software will be delivered to some (maybe large) extent from the mobile devices we carry.
Source: Benedict Evans. August 21, 2015. “Ways to Think about Cars.”
