

Smart Clothing and Fitness Devices
Summary
Smart clothing seems to be just around the corner, with several companies already selling specialty items (athletic wear, baby clothes, etc) embedded with sensors. However, quantitative forecasts describing the prevalence of smart clothing in the next 10 years or so are hard to find. Gartner made a forecast to 2016 back in 2014. Tractica has a forecast to 2020. Both forecasts describe millions of units shipped worldwide. Although it’s difficult to extrapolate market penetration, both reports suggest that smart clothing will be more prevalent than wearable devices. Other research firms and analysts are skeptical of such a swift uptake by smart garments, instead forecasting dominance by other wearable devices.
Research Excerpts
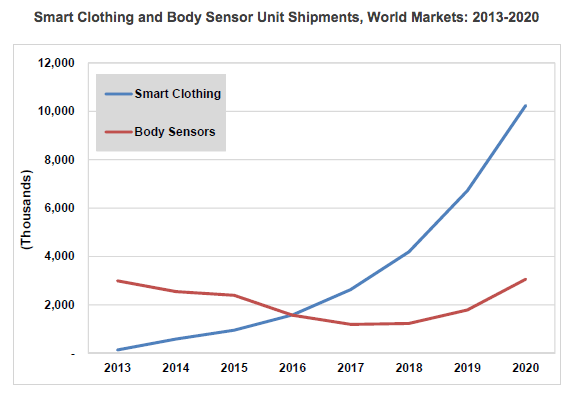
Tractica forecasts that smart clothing shipments will grow from 140,000 units in 2013 to 10.2 million units by 2020, while body sensor shipments will decrease from 3.0 million units in 2013 to 1.2 million by 2017, before rising again to 3.1 million units in 2020.
Src:
Tractica. May 4, 2015. “The Wearable Devices Market is Poised for Expansion into Smart Clothing and Body Sensors.”
Executive Summary
Chart from above report:
[via Global Information]
*
| Worldwide Wearable Electronic Fitness Devices Shipments (millions of units) | ||||
| Device Category | 2013 | 2014 | 2015 | 2016 |
| Smart Wristband | 30 | 20 | 17 | 19 |
| Sports Watch | 14 | 18 | 21 | 24 |
| Other Fitness Monitor | 18 | 20 | 12 | 15 |
| Chest Strap | 11 | 12.1 | 8 | 7.3 |
| Smart Garment | 0.01 | 0.1 | 10.1 | 26 |
| Total Market | 73.01 | 70.2 | 68.1 | 91.3 |
Src:
Gartner. November 18, 2014. “Gartner Says in 2015, 50 Percent of People Considering Buying a Smart Wristband Will Choose a Smartwatch Instead.”
Note: Angela McIntyre, Gartner research director – gave an interview to The Guardian. Might be available for comment.
*
Growth will be “largely driven by the sales of wrist-based trackers, while hundreds of thousands of connected garments used by professional sports teams showcase wearable technology’s most advanced capabilities.” Hundreds of thousands of thousands of connected garments is hardly a drop in the ocean compared to the millions of Fitbits, Xiaomis, Apple Watches, Jawbones and other devices which will be coining in the revenue by 2020. [emphasis mine]
Src:
James Stables. November 18, 2015. “Juniper Report Skeptical on Smart Clothing but Says Fitness Trackers are Set to Soar.” Wearable.com.
*
In our latest smart glasses report, we expect over 3 million smart glasses to be in use in enterprise by 2018, with nearly 6 million users. [worldwide, I think]
Src:
Juniper Research. 2015. “The World In 2020 – A Technology Vision.”
Note: The White paper seems to be referring to this paid research report.
*
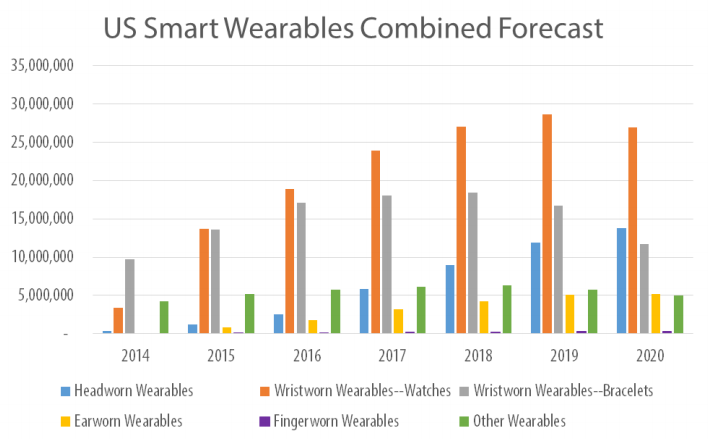
The US market for wearables is forecast to evolve more quickly than worldwide, leading to a peak of 68.3 million units in 2019, then dropping to 62.9 million in 2020.
Smart watches will be the top category as of this year in the US, followed by smart bands/bracelets.
In 2020, headworn wearables are expected to become the number two segment.
Src:
Bob O’Donnell. May 2015. “The Slow Build: Smart Wearables Forecast, 2014-2020.” Technalysis Research.
Note: This report does not include clothing with embedded sensors. Bob O’Donnell is skeptical of the ability of smart clothing to surpass other wearables in the foreseeable future.
Pharmaceutical Sales Through 2020
EvaluatePharma (life science market research firm) releases an annual report of current pharmaceutical sales figures with forecasts looking 5 years out.
According to the 2015 report, Novartis was the number one pharmaceutical company in 2014 and is forecast to maintain its position in 2020
Other indicators reported:
worldwide prescription drug sales (2006-2020)
regional prescription drug sales
Top 20 Companies by Rx sales in 2020
worldwide R&D spending by company
worldwide Rx drug & OTC sales by therapy area in 2020
Src: “World Preview 2015, Outlook to 2020.” 2015. Evaluate.
They also track sales volume and pricing including cost and volume per patient for the U.S. and other regions. Not available in the free report – contact them.
Media Contacts:
Evaluate and EP Vantage (for general questions)
Christine Lindgren
+1 617-866-3906
christine.lindgren@evaluategroup.com
Chempetitive Group (for U.S. media)
Rachel Wallace
+1 781-775-3640
rwallace@chempetitive.com
