

Transportation: Air and Train Travel
Summary
This collection of data includes the following indicators:
AIR TRAVEL
revenue passenger miles, 2014-2040 & 2014-2034, US Energy Information Administration (EIA), Boeing
seat miles demanded by plane size, 2014-2040, EIA
annual passengers on US-based flights, 2003-2015, Dept. of Transportation (DoT)
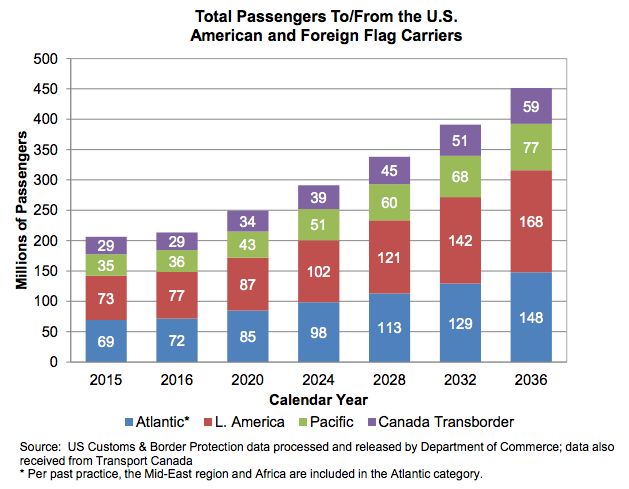
annual passengers to/from the US, 2015-2036, FAA
passengers to/from/within the US CAGR, 2014-2034, IATA
number of aircraft by type, 1965-2014, DoT
number of certificated aircraft, 1960-2005, Statista (citing AIA, DoT, FAA)
number of commercial aircraft by size, 2006-2036 & 2014/2034, FAA, Boeing
number of general aircraft by size, 2006-2036, FAA
number of airlines, [forthcoming data] & 1950/2002 & speculation, DoT, Aviation Mgmt College, Boeing
number of airports, 1980-2014 & current count by size, DoT, FAA
incoming intl travel and “mega-cities”, 2012/2032, Airbus
PERSONAL DRONES
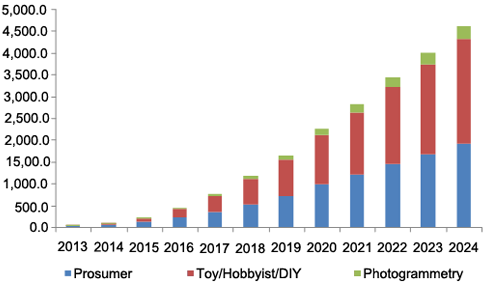
consumer drone market USD millions, 2013-2024, Grand View Research
RAIL TRAVEL
passenger miles light rail and heavy rail, 1980-2014, DoT
passenger miles commuter rail and Amtrak, 1960-2014, DoT
miles of subway trackway, 1997-2014, DoT
high speed rail development map, 2015-2030 & undated, US High Speed Rail Association, DoT
Findings
Miles Flown
Travel Demand — Revenue Passenger Miles (billion miles)
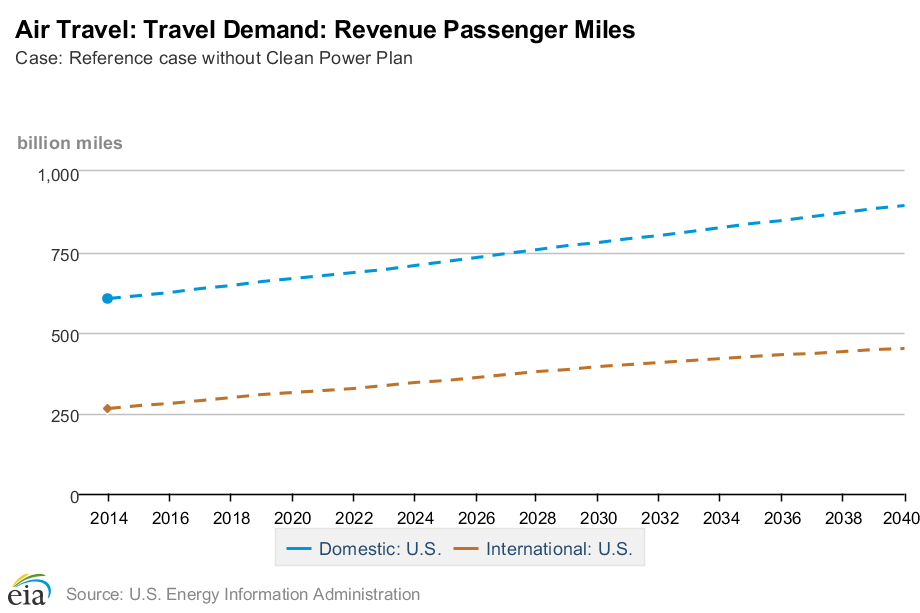
Note: Revenue revenue passenger miles are calculated by multiplying the number of revenue paying-passengers aboard the vehicle by the distance traveled. Sometimes abbreviated to RPM or RPK.
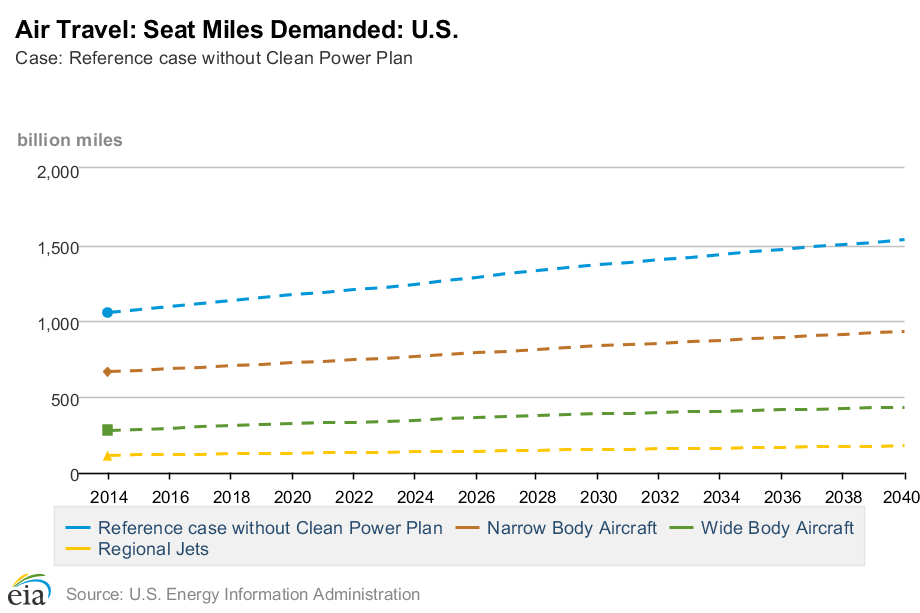
Seat Miles Demanded (total and by plane size)
src:
US Energy Information Administration. 2016.
“Annual Energy Outlook 2016”
Transportation Sector
Table: Air Travel Energy Use
NOTE: ONLY THE DATA TABLES ARE CURRENTLY AVAILABLE. THE EXECUTIVE SUMMARY AND OTHER NARRATIVE PARTS OF THE REPORT WILL BE AVAILABLE AFTER JULY 21, 2016. CHECK BACK HERE.
*
“Owing to network carrier capacity discipline, we think that the domestic US market is ripe for even higher growth than previously forecast. Our revised domestic forecast has traffic growth in the range of 2.5 to 3.0 percent over the next five years. With a load factor of 83 percent for 2014 (and average load factors in excess of 80 percent over the past few years), network carriers may be prompted to further ease their capacity discipline in the face of competitive pressures and continued economic recovery.”
src:
Boeing. 2015.
“Current Market Outlook: 2015–2034.” P. 23, 42.
contact: BoeingCurrentMarketOutlook@Boeing.com
Passengers Flying
The U.S. Department of Transportation’s Bureau of Transportation Statistics (BTS) reported today that U.S. airlines and foreign airlines serving the United States carried an all-time high of 895.5 million systemwide (domestic and international) scheduled service passengers in 2015, 5.0 percent more than the previous record high of 853.1 million reached in 2014. The systemwide increase was the result of a 5.0 percent rise from 2014 in the number of passengers on domestic flights (696.2 million in 2015) and 4.7 percent growth from 2014 in passengers on U.S. and foreign airlines’ flights to and from the U.S. (199.4 million in 2015)
Annual Total Passengers on US-Based Flights
Data available from the source (table, or excel)
src:
Department of Transportation. March 2016.
“2015 U.S.-Based Airline Traffic Data.”
Bureau of Transportation Statistics.
media contact: Dave Smallen, 202-366-5568
TO DO: SEE IF THE DEPT. OF TRANSPORTATION HAS OLDER FIGURES.
*
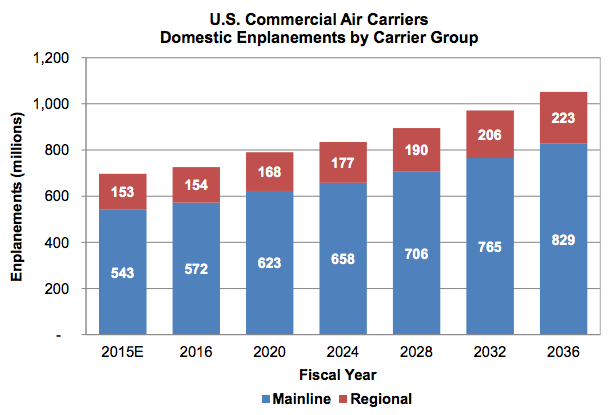
Enplanements = passengers
Note: Mainline carriers are defined as those providing service primarily via aircraft with 90 or more seats. Regionals are defined as those providing service primarily via aircraft with 89 or less seats and whose routes serve mainly as feeders to the mainline carriers.
src:
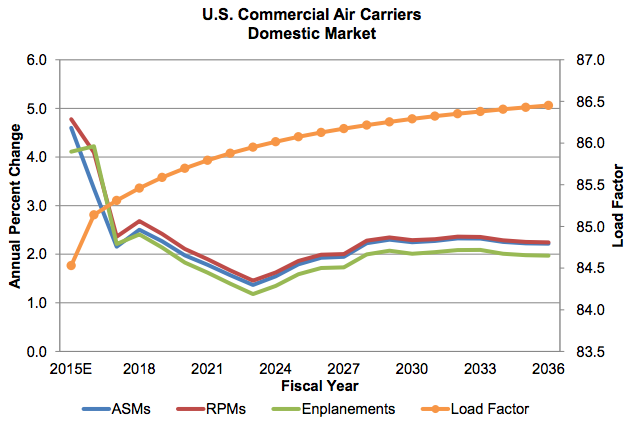
Federal Aviation Administration. Accessed July 1, 2016.
“FAA Aerospace Forecast: Fiscal years 2016-2036.”
*
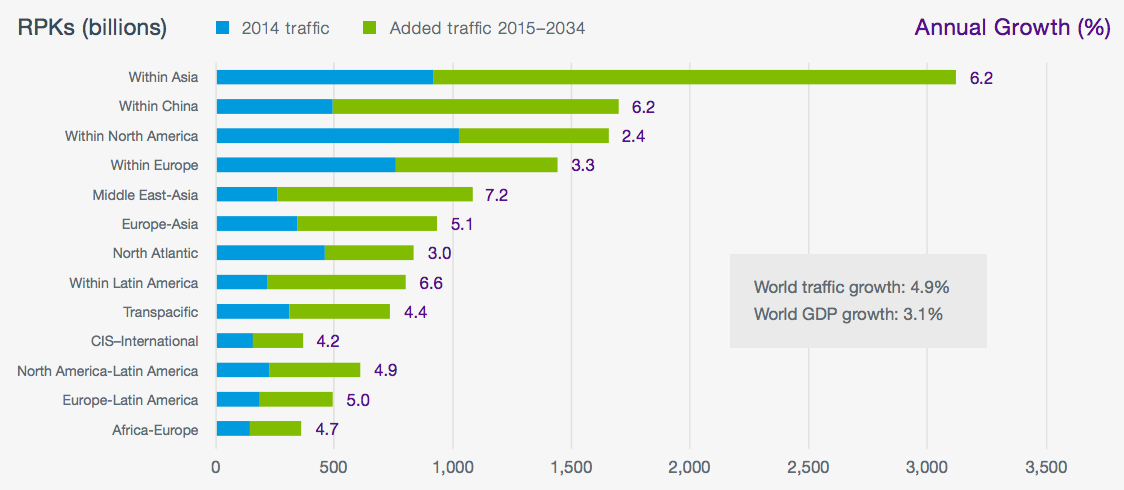
Traffic to, from and within the US is expected to grow at an average annual growth rate of 3.2% that will see 1.2 billion passengers by 2034 (559 million more than 2014).
src:
IATA. October 2014.
“New IATA Passenger Forecast Reveals Fast-Growing Markets of the Future.”
TO DO: INQUIRE ABOUT NEWER FORECAST
David Oxley, IATA Senior Economist, oxleyd@iata.org
OR corpcomms@iata.org
Number and Types of Commercial Jets
Table 1-13: Active U.S. Air Carrier and General Aviation Fleet by Type of Aircraft (Number of carriers)
Annual data available 1965-2014
src:
US Department of Transportation. Accessed July 1, 2016.
“Table 1-13: Active U.S. Air Carrier and General Aviation Fleet by Type of Aircraft (Number of carriers).”
TO DO: PULL DATA OUT INTO A GOOGLE SPREADSHEET
*
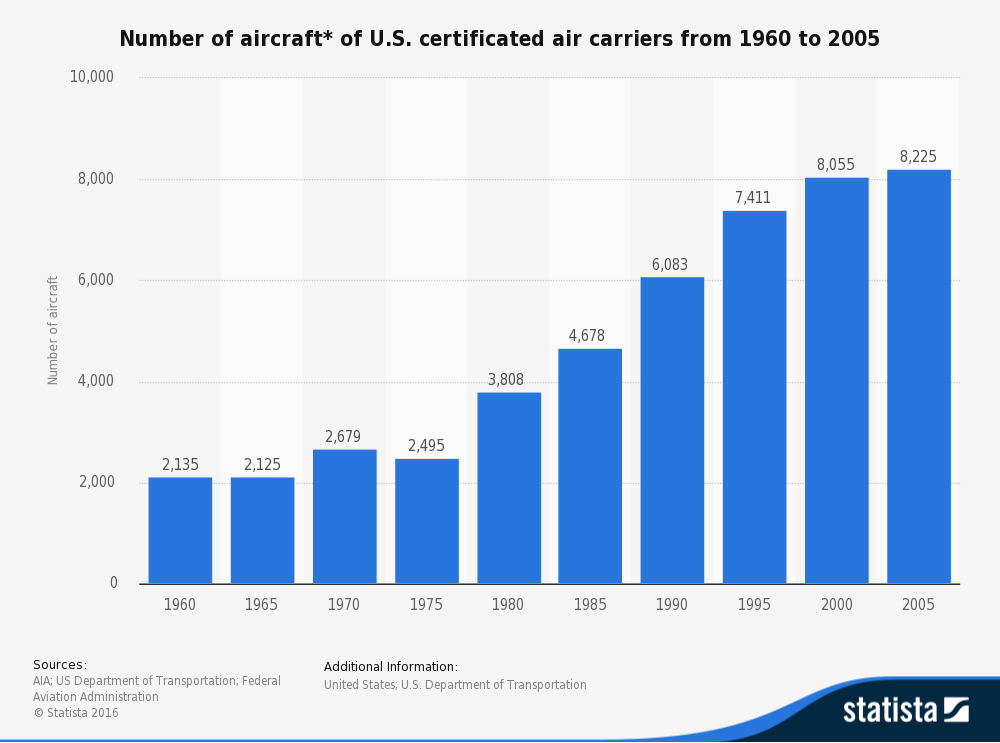
Number of aircraft of U.S. certificated air carriers from 1960 to 2005
The timeline shows the number of U.S. certificated air carrier aircraft from 1960 to 2005. In 2000, there were 8,055 certificated air carrier aircraft in the United States.
src:
Statistia. Accessed July 8, 2016.
“Number of aircraft* of U.S. certificated air carriers from 1960 to 2005.”
citing:
AIA; Dept. of Transportation; Federal Aviation Administration
FORECAST BELOW
*
US Commercial Aircraft Forecast
(CC’s notes: includes scheduled air services – pilot is paid, must have commercial pilot certificate)
The number of aircraft in the U.S. commercial fleet is forecast to increase from 6,871 in 2015 to 8,414 in 2036, an average annual growth rate of 1.0 percent a year. Increased demand for air travel and growth in air cargo is expected to fuel increases in both the passenger and cargo fleets.
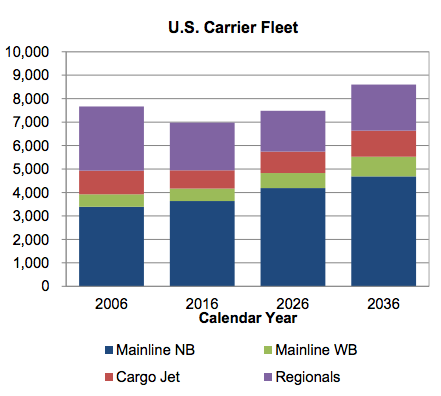
NB: narrow-body
WB: wide-body
General Aviation Forecast
(CC’s notes: does not include schedule air services – pilot not paid, private pilot certificate is sufficient)
The active general aviation fleet is projected to increase at an average annual rate of 0.2 percent over the 21-year forecast period, growing from an estimated 203,880 in 2015 to 210,695 aircraft by 2036.
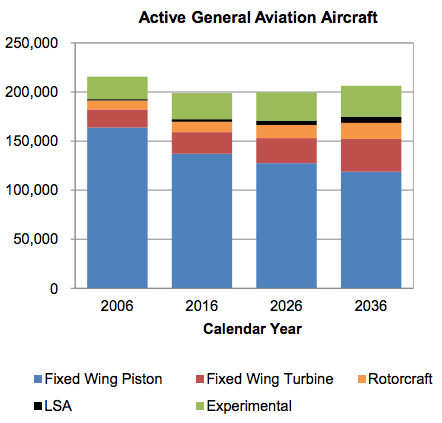
LSA: light-sport-aircraft (category established in 2005)
Note: An active aircraft is one that flies at least one hour during the year.
src:
Federal Aviation Administration. Accessed July 1, 2016.
“FAA Aerospace Forecast: Fiscal years 2016-2036.”
*
src:
Boeing. 2015.
“Current Market Outlook: 2015–2034.” p.42
contact: BoeingCurrentMarketOutlook@Boeing.com
Number of Airlines
The Dept. of Transportation has a simple PDF list of certificated air carriers and commuter air carriers, but there’s no “member since” info and presumably doesn’t include former members.
https://www.transportation.gov/policy/aviation-policy/certificated-air-carriers-list
https://www.transportation.gov/policy/aviation-policy/commuter-air-carriers-list
https://www.transportation.gov/policy/aviation-policy/licensing/US-carriers
Air Carrier Fitness Division
Office of Aviation Analysis
Dept. of Transportation
1200 New Jersey Ave, SE
Washington, DC 20590
United States
Phone: (202) 366-9721
Business Hours:
8:30am-5:00pm ET, M-F
EMAILED LAURALYN REMO, laura.remo@dot.gov, JULY 8, 2016.
Caitlin Harvey, caitlin.harvey@dot.gov, wrote back and shared the following Excel files (with data from 1978-2016):
“Commuter Carrier List.xls”
“Certificated Carrier List.xls”
*
Certificated airlines in the US
1950 – 17 airlines
2002 – 12 airlines
src:
Aviation Management College.
“Introduction to Aviation Economics.”
Slide 15.
*
“Post the 2008 downturn, the introduction of the ultra-low-cost carrier (ULCC) business model in the United States is literally taking off. Spirit Airlines is the fastest growing domestic airline, recording double-digit growth. Frontier Airlines, which is undergoing a change in strategy, is expected to challenge Spirit in the quest to become the preeminent ULCC in the United States. The expectation is that over time, the industry will further consolidate, with the LCC and smaller network carriers becoming potential consolidation targets.”
[emphasis mine]
src:
Boeing. 2015.
“Current Market Outlook: 2015–2034.” P.42
contact: BoeingCurrentMarketOutlook@Boeing.com
Number of Airports
Table 1-3: Number of U.S. Airports
Annual data available 1980-2014
src:
US Department of Transportation. Accessed July 6, 2016.
“Table 1-3: Number of U.S. Airports.”
NOTE: THESE FIGURES ARE MUCH HIGHER THAN THOSE BELOW DESCRIBING THE NUMBER OF US AIRPORTS WHERE REGIONAL AIRLINES OPERATE. THOSE FIGS MIGHT BE REFERRING TO “CERTIFICATED” AIRPORTS, BUT DATA FOR THESE AIRPORTS ARE ONLY AVAILABLE 1994-2004.
TO DO: PULL DATA OUT INTO A GOOGLE SPREADSHEET
*
A total of 614 U.S. airports are served by regional airlines, with 70% (431 airports) relying exclusively on regional airlines for their scheduled service.
The United States’ air transportation network is the most developed in the world, but is evolving as airlines battle rising costs. While regional aircraft operate approximately 33% of commercial flights worldwide, 50% of all commercial flights in the United States are flown by regional aircraft with less than 100 seats. According to the Regional Airline Association (RAA), average capacity of U.S. regional aircraft has increased from 37 seats in 2000 to 50 seats in 2005 and to 56 seats in 2013. Average trip length increased from 476 kilometres in 2000 to 763 kilometres in 2013. These trends are expected to continue as new large regional aircraft replace 20-to59-seat aircraft.
src:
Bombardier. July 2014.
“Bombardier Commercial Aircraft Market Forecast 2014-2033.”
P.31
citing:
Regional Airline Association (RAA)
*
2014
Total FAA Towers – 264
Total Contract Towers – 252
2014 airport hubs
30 large hub airports (1%+ total US passenger enplanements)
31 medium hub airports (.25-.99%)
74 small hub airports (.05-.249%)
381 non-hub airports non-hub airports (less than .05%)
Total: 516
For example, Atlanta was the busiest large hub in 2014, and it saw 6.13% of total US enplanements in 2014.
Enplanements at large hubs expected to increase at an annual rate of 2.0% through 2040. Operations (take-offs and landings) at these hubs are forecast to increase at an annual rate of 1.6%.
Medium and small hubs are forecast to increase at 2.0% and 1.7% annually, respectively. Operations at medium hubs expected to grow at 1.3% annually. Operations at small hubs are forecast to grow at .8% per year.
Non-hub operations accounted for 52% of total operations at FAA and Federal contract towers. General aviation operations (e.g.: private) accounted for the majority of operations at these smaller airports.
src:
Federal Aviation Administration. 2015.
“Terminal Area Forecast Summary: Fiscal Years 2015-2040.”
contact:
Roger Schaufele, Jr.
Manager
Forecast and Performance Analysis Division
Office of Aviation Policy and Plans
202-267-3306
Roger.Schaufele@faa.gov
EMAILED ROGER SHAUFELE JULY 8, 2016.
ALSO TRY CONTACTING THE FAA OFFICE OF THE ASSOCIATE ADMIN FOR AIRPORTS. NO EMAIL, PHONE IS DISCONNECTED.
*
Airport Data retrieval form from the FAA.
TO DO: CONTACT FAA FOR AN ANNUAL TALLY. NOT SURE BEST CONTACT AVENUE.
TRY THE FORM HERE. OR THE OFFICE OF THE ASSOCIATE ADMIN FOR AIRPORTS
Incoming Intl Travel to US
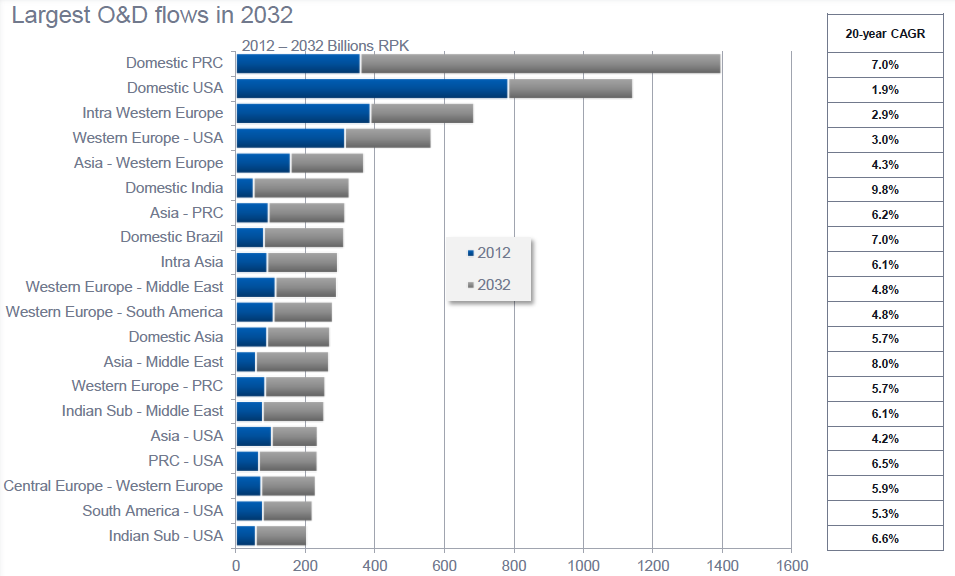
In 2012, the US has one “aviation mega-city” receiving more than 50,000 daily long-haul passengers. In 2032, there will be five.
Long haul traffic: flight distance >2,000nm, excl. domestic traffic
citing: GMF 2013; Cities with more than 10,000 daily passengers
src:
Bob Lange. September 2013.
“Global Market Forecast 2013-2032.”
Airbus. P. 15, 29
Personal Drones
Grand View Research is tracking the consumer drone market, and although the summary for their recent report does not include much unit data, the forecast does show the relative growth across three consumer applications: prosumer, toy/hobbyist/DYI, and photogrammetry.
North America consumer drone market by technology, 2012 – 2022 [sic] (USD Million)
src:
Grand View Research. May 2016.
“Consumer Drone Market Analysis By Product (Multi-Rotor, Nano), By Application (Prosumer, Toy/Hobbyist, Photogrammetry) And Segment Forecasts To 2024.”
Rail Passenger Miles
Table 1-40: U.S. Passenger-Miles (Millions)
Includes
Light rail: 1980-2014
Heavy rail: 1980-2014
Commuter rail: 1960-2014
Intercity/Amtrak: 1960-2014
Note: This table also includes figures for air, highway, bus and ferry travel.
src:
US Department of Transportation. Accessed July 11, 2016.
“Table 1-40: U.S. Passenger-Miles (Millions).”
TO DO: PULL DATA OUT INTO A GOOGLE SPREADSHEET
Definitions src
Heavy Rail: includes subways, elevated railways, and metropolitan (metro) railways and refers to an electric railway with the capacity to transport a heavy volume of passenger traffic and characterized by exclusive rights-of-way, multicar trains, high speed, rapid acceleration, sophisticated signaling, and high-platform loading.
Light Rail: A streetcar-type vehicle operated on city streets, semiexclusive rights-of-way, or exclusive rights-of-way. Service may be provided by step-entry vehicles or by level boarding.
Commuter Rail: Urban passenger train service for short-distance travel between a central city and adjacent suburb. Does not include rapid rail transit or light rail service.
Amtrak: Operated by the National Railroad Passenger Corporation of Washington, D.C., this rail system was created by the Rail Passenger Service Act of 1970 (P.L. 91-518, 84 Stat. 1327) and given the responsibility for the operation of intercity, as distinct from suburban, passenger trains between points designated by the Secretary of Transportation.
Miles of Trackway
Subway: 1997-2014 (in separate annual reports)
src:
US Department of Transportation ~1997-2014.
“NTD Data Reports.”
Federal Transit Administration.
TO DO: EXTRACT DATA
High-Speed Rail
The High Speed Rail Association has published a US network phasing plan showing construction phases from 2015-2030.
src:
US High Speed Rail Association. Accessed July 11, 2016.
“US HSR Network Phasing Plan.”
NOTE: This plan may reflect expect START dates for construction, rather than completion. For example, while work on phase 1 of California’s high-speed rail system began in 2014, it’s not expected to be complete until 2029. src
*
In 2009, the Department of Transportation published a strategic plan for US high-speed rail development, which designated 10 high-speed corridors.
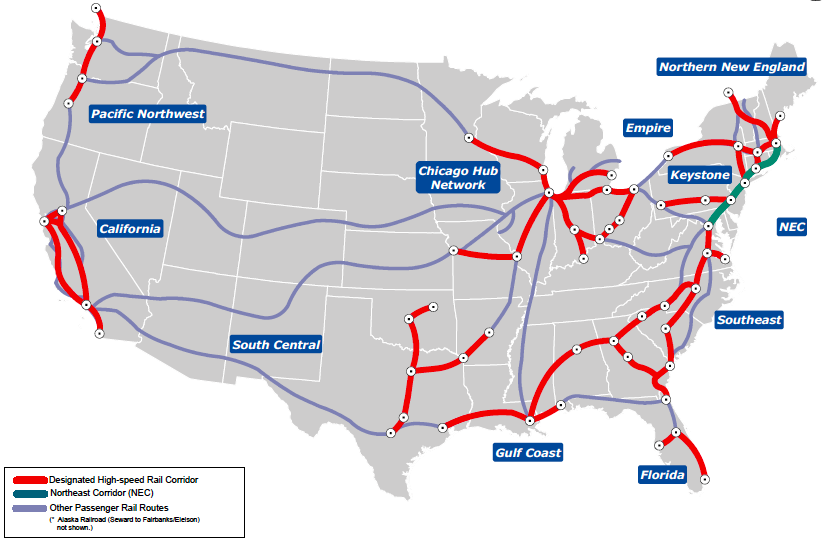
Note: The plan does not include a specific timeline for completion of the high-speed corridors.
src:
US Department of Transportation. April 2009.
“High-Speed Rail Strategic Plan.” P.6
