

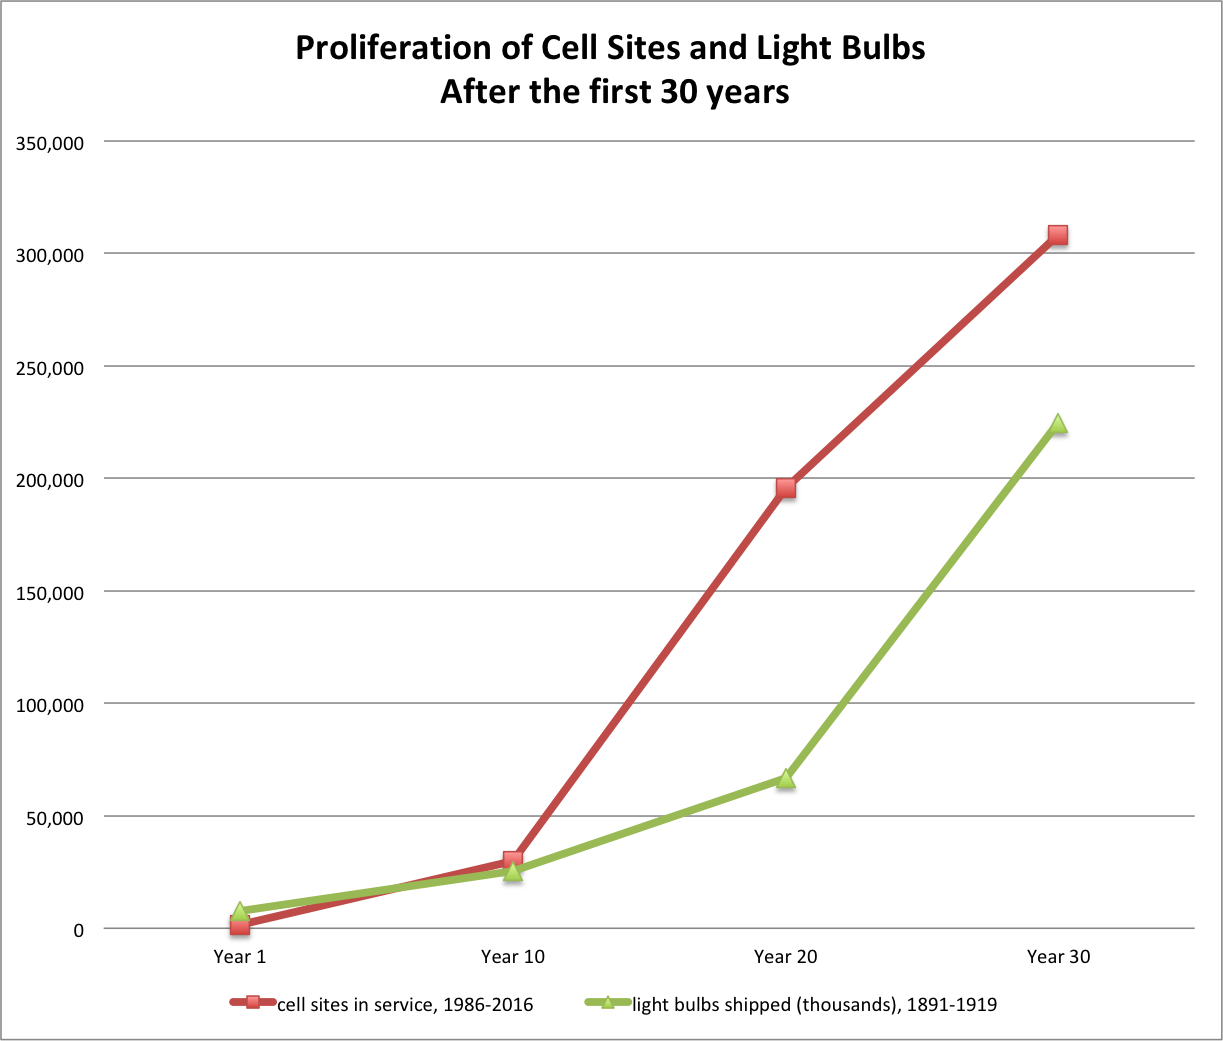
Proliferation of cell sites and light bulbs
NOTE:
This chart reflects production of large incandescent lamps, which include the ordinary electric-light bulbs for residential, commercial, and industrial use. This category excludes miniature lamps such as those for motor vehicles, flashlights, and Christmas trees. (Bright, p.5, Note 2). Production of other types of lamps (miniatures, photofloods, etc) seem to’ve been fairly low in the first three decades of lamp production (1891-1919), but began to ramp up soon thereafter, certainly by 1939 (figures reported in Bright, p. 10), and by 1945 these other categories of lamps accounted for about 36% of total lamp production (calculated based on figures reported by the FTC in 1980, p.34).
DATA
Cell sites in service
1986 1,531
1996 30,045
2006 195,613
2016 308,334
src:
CTIA, 2017
“Wireless Snapshot 2017”
Light bulbs shipped (thousands)
1891 7,500
1899 25,320
1909 66,776
1919 224,713
src:
MIT Studies of Innovation, 1949
Arthur A. Bright
“The Electric-Lamp Industry: Technological Change and Economic Development from 1800 to 1947”
p.4, Table I: The Production Of Large Incandescent Lamps In The United States 1879-1945
NOTE:
Data from these two sources is aggregated in CC’s Excel file: cell-sites-vs-light-bulbs.xls, which includes additional years of data (through 1945) for the light bulb industry, as well as calculated rates of growth.
*
Additional source for light bulb production
Federal Trade Commission, February 1980
“Staff Report on the Development and Structure of the U.S. Electric Lamp Industry”
Excerpts:
Total volume of light bulb industry
1912 90.8 million
1926 478.9 million (527% increase from 1912)
p.103
| Comparison of 1945 and 1974 Shipments of Various Types of Electric Lamps [thousands of units] |
|||
| Type of Lamp | 1945 shipments | 1974 shipments | Percentage change |
| Photographic | 36,447 | 2,406,332 | 6,502.3 |
| Large incan. | 794,402 | 1,532,039 | 92.9 |
| Miniature* | 337,325 | 964,016 | 185.8 |
| Fluorescent | 42,781 | 284,529 | 561.1 |
| Total | 1,250,689 | 5,395,942 | 331.4 |
p.34
*Of the 964,016 Miniature lamps shipped in 1974, 665,208 were used in automotive applications. (p.43)
citing:
U.S. Department of Commerce,_c: Bureau of the Census, Current Industrial Report: Series MQ-36B(74)-5, Electric Lamps, 1975; and U.S. Department of Commerce, Bureau of the Census, Facts for Industry: Electric Lamps, 1946.
Table 111-1 shows the U.S. value of shipments, exports, and imports in SIC 3641 for the years 1967 to 1973. During that time; imports never accounted for more than 6.79 percent of total domestic value of shipments while exports never accounted for more than 5.21 percent. When imports are added to value of shipments and exports subtracted from the whole, consumption can be found. Between 1967 and 1973, 93 percent of the total lamps consumed in the United States were manufactured in the U.S. In the same seven-year period, 94.8 percent of the lamps manufactured in the United States were used in the U.S.
p.38-40
***
OTHER BITS OF POSSIBLE INTEREST…
“Consumption Spreads Faster Today”
Chart shows historic penetration rates for new technologies – accelerating over time.
Includes electricity.

Other interesting excerpt:
At the average wage, a VCR fell from 365 hours in 1972 to a mere two hours today. A cellphone dropped from 456 hours in 1984 to four hours. A personal computer, jazzed up with thousands of times the computing power of the 1984 I.B.M., declined from 435 hours to 25 hours. Even cars are taking a smaller toll on our bank accounts: in the past decade, the work-time price of a mid-size Ford sedan declined by 6 percent.
src:
New York Times, February 2008
graphic src:
Nicholas Felton (not sure about data src, although many other version of this chart exist, so it must be widely available data)
And here’s an older version of the chart (1998), different illustrator, additional detail.
And another version, through 2010, which really emphasizes the acceleration of penetration rates.
*
U.S. Housholds by Type of Phone, 1900-2011
src:
Harvard Business Review, Nov 2013
graphic by:
Michael Degusta, MIT Technology Review
using data from Forrester, Knowledge Networks, Net York times, PEW, US Census
*
The History of the Light Bulb – US Department of Energy
Interactive timeline of light bulb technology
Light – Our World in Data
Price (1300 to current, UK), consumption (1700 to current, UK), and access (current, global) to lighting
