

Homes
Summary
This is a roundup of basic statistics describing American homes including homeownership rates, housing starts, second home ownership, urban vs. rural home distribution, housing features distribution, total households, and home sales/spending. Most of the data are historic, with a couple forecasts (for housing starts and total households).
Historic home ownership rates are available from the US Census Bureau from the present going back to 1965. Statistics broken down by age-group are available back to 1982.
Forecasts for housing starts are available to 2025 from Forisk. Much shorter one-year forecasts are available from the National Association of Home Builders. Historic housing starts data are available from the UC Census Bureau at least to 2000, possibly as far back as 1959 (TO DO: CHECK FOR OLDER DATA)
Decadal historic data for the number of vacation homes are available from 1940 to 2000 from the US Census Bureau. Biennial data for the number of seasonal homes from 1973 through 2005 have been aggregated by the US Department of Housing and Urban Development (HUD). These figures just describe the number of second homes, but I’ve found a couple sources describing the number of households that own second homes (second home ownership rates). Statista has data for the number of people living in households that own second homes from 2008 to 2015. The US Federal Reserve (Fed) has “other residential real estate” ownership rates broken down by a variety of demographic characteristics going back to 1989 (their survey is conducted every three years). The Joint Center for Housing Studies Harvard University (JCHS) has a comparison of second homeownership by age for 1995 and 2004 (using data from the Fed).
HUD has aggregated figures on the distribution of urban vs. rural housing from 1973 to 2005.
The US Census Bureau has a collection of housing features data for new single family homes, multifamily units, and multifamily buildings. Many of the data points go back to 1973, some only to 2005. Features tracked include square footage, number of stories, number of bedrooms, number of bathrooms, number of fireplaces, type of heating system, type of heating fuel, type of foundation, type of parking, outdoor features, lot size, number of units sold by price. Figures include the total number of houses/units, and the percentage distribution.
Statista has figures on the total number of US households from 1960 to 2015. The JCHS has a forecast (based on Census data) to 2035 for total households, as well as households by age, race, and occupancy relationships (single, married, families, etc).
NAHB has a line chart showing the number of new single-family homes sold from 1978-2012. Annual numeric values for 2011-2015 are available in a separate NAHB document. Data points for previous individual years may be available from NAHB upon request. In any case, the Census has data on new residential sales going back to 1963. Census also has median and average sales prices for new homes sold back to 1963, and type of financing for houses sold back to 1988. NAHB has an indexed comparison between residential construction spending for single-family homes, multifamily units, and improvements from 2000 through 2016.
Findings
Ownership vs Renting
Homeownership Rates for the US and Regions: 1965 to Present
src:
US Census Bureau. Accessed May 16, 2016.
Housing Vacancies and Homeownership (CPS/HVS)
Historical Tables
“Table 14. Quarterly Homeownership Rates for the U.S. and Regions: 1965 to Present”
and imported to this Google Sheet.
*
Annual Homeownership Rates for the United States and Regions, 1968-2015
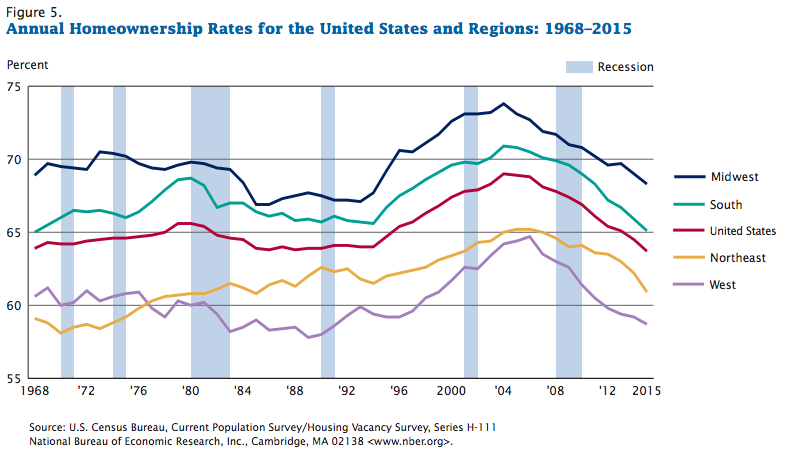
src:
US Census Bureau. Accessed May 16, 2016.
Current Population Survey/Housing Vacancy Survey, Series H-111.
*
Annual Homeownership Rates for the United States by Age Group, 1982-2015

src:
US Census Bureau. Accessed May 16, 2016.
Current Population Survey/Housing Vacancy Survey, Series H-111.
Housing Starts
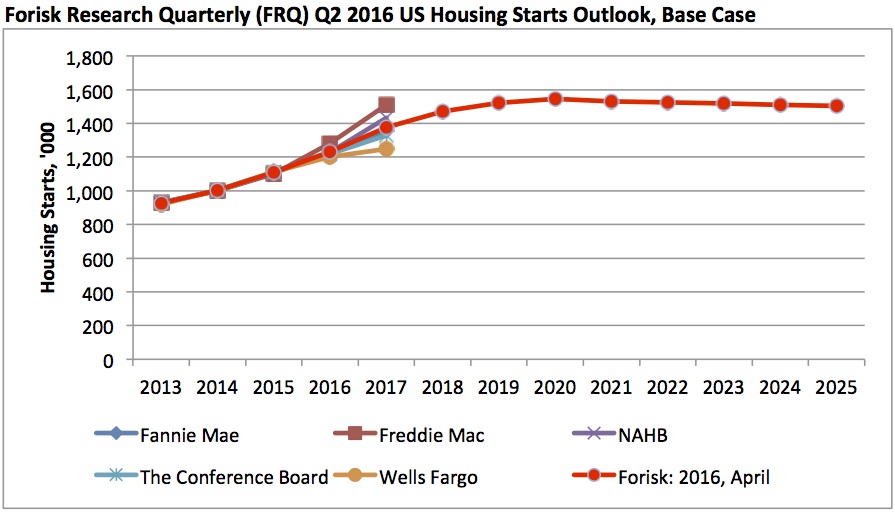
Forisk provides consulting services to the forest industry, wood bioenergy and timberland investing sectors.
src:
Brooks Mendell. April 22, 2016. “Forisk Forecast: US Housing Starts Outlook, Q2 2016 Update.” Forisk.
*
2011-2017 Housing Starts, New Single Family Sales, Existing Single-Family Home Sales, Interest Rates
src:
NAHB. “Housing and Interest Rate Forecasts”
Accessed May 16, 2016 via the NAHB Forecasts page.
Exported to this Google Sheet.
*
New Housing Units Started in the United States
Note: Possible to infer multifamily starts from this chart by subtracting the single-family starts from total starts.
src:
“New Residential Construction”
US Census Bureau. Accessed May 18, 2016.
Data likely comes from one of these time series, for example, which go back to 1959.
Second Homes
Vacation Homes – United States, 1940-2000 (decadal data only)
Aggregated in the following Google Sheet.
src:
US Census Bureau. Accessed May 20, 2016.
“Historical Census of Housing Tables: Vacation Homes”
Note: the Census Bureau has annual data in individual annual reports, but this is the best aggregation I’ve found so far.
*
Excerpt:
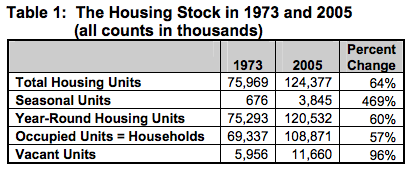
Year-round units are either occupied or vacant. Note that “occupied” and “vacant” have precise definitions that do not coincide exactly with the common understanding of these words. A house may have one or more persons living in it, but if those persons typically reside somewhere else, the house is considered vacant from the perspective of the AHS. The decennial censuses use the same logic because this approach ensures that every household has one and only one place where it “resides,” and the approach also results in the number of households being equal to the number of occupied housing units.
Using this logic, a unit is vacant if it is not the “usual residence” of some household. Defined this way, a vacant unit is in some sense an excess unit—like having more chairs than children in a game of musical chairs. Table 1 shows that vacant units grew almost twice as fast as households between 1973 and 2005. This fact, combined with the growth in seasonal units, accounts for the increase in the ratio of housing units to households.
Data points aggregated in the following Google Sheet.
src:
Frederick J. Eggers, et al. October 2007.
“32 Years of Housing Data.” P.4-5, A2-A8
U.S. Department of Housing and Urban Development
*
Second home ownership: Number of people living in households that own a second home in the United States (USA) from spring 2008 to spring 2015 (in millions)
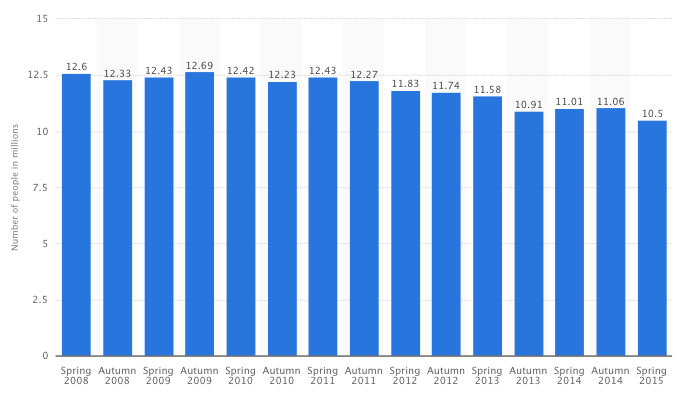
This statistic illustrates the number of people living in households that own a second home in the United States (USA) from spring 2008 to spring 2015. In spring 2008, the number of people who said they live in a household that own a second home in the United States (USA) amounted to around 12.60 million.
src:
Statista (source hidden). Accessed May 23, 2016.
“Second home ownership: Number of people living in households that own a second home in the United States (USA) from spring 2008 to spring 2015 (in millions)”
Note: I suspect the data either comes from the Census Bureau or the Survey of Consumer Finances, but I haven’t found the exact report/indicator.
*
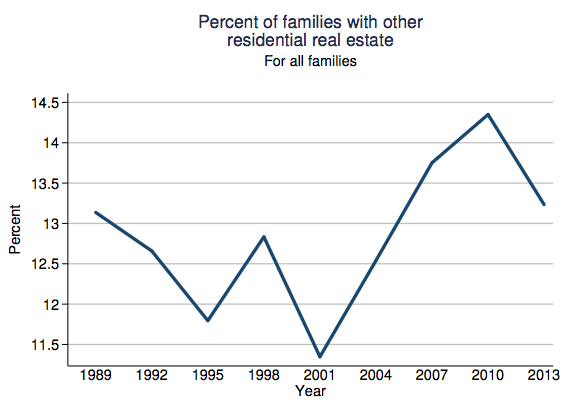


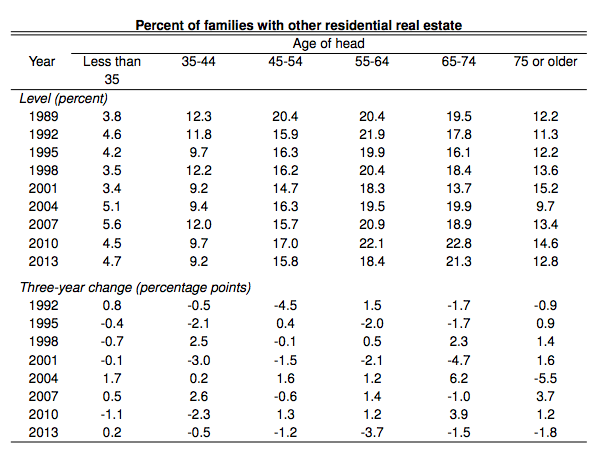

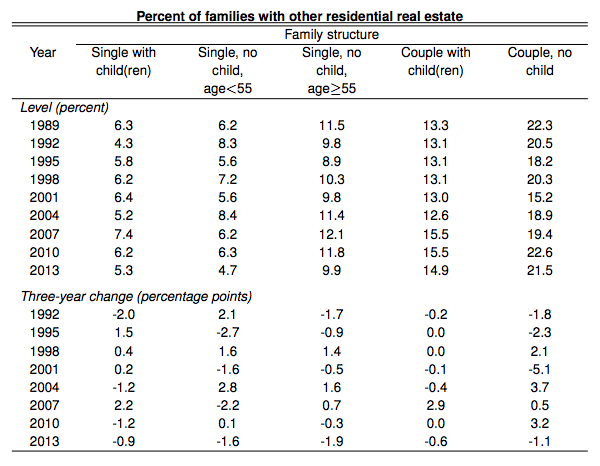

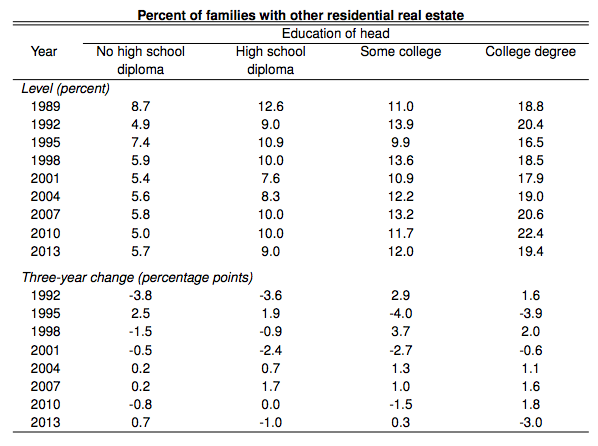
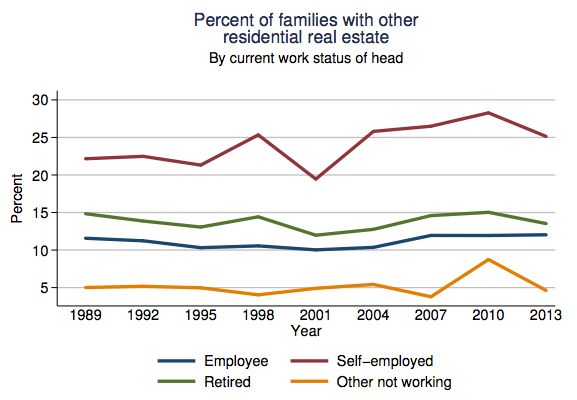


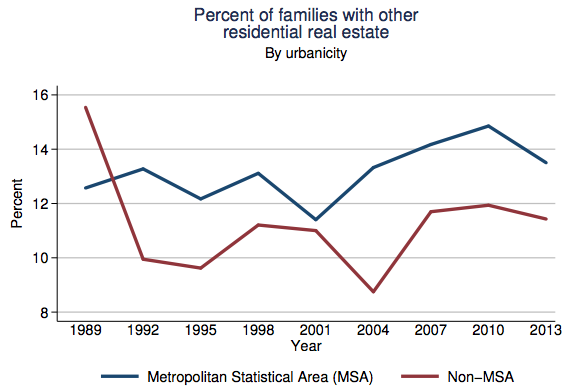


src:
Survey of Consumer Finances. September 2, 2014.
“2013 SCF Chartbook.” The 2013 Survey of Consumer Finances.
The Federal Reserve.
P.651-683
*
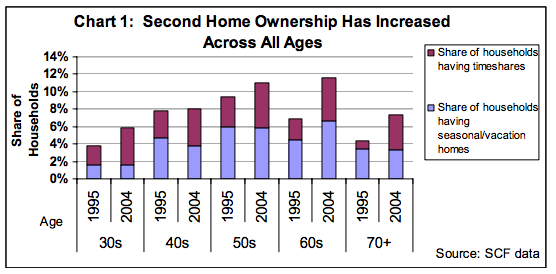
src:
Eric S. Belsky, et al. 2006.
“Multiple-Home Ownership and the Income Elasticity of Housing Demand.”
Joint Center for Housing Studies Harvard University.
citing Survey of Consumer Finances
Note: The source explains that the American Household Survey, the Housing Vacancy Survey, and the decennial Census all include estimates of the number of second home units. Surveys that ask households about whether they own additional properties include: The American Housing Survey; the Survey of Consumer Finances (SCF); the Survey of Income and Program Participation (SIPP), the Panel Study of Income Dynamics (PSID), and industry surveys such as one of new homebuyers conducted by the National Association of Home Builders (2000) and by the National Association of Realtors® (NAR) of homebuyers and homeowners. However, the SCF, conducted by the Federal Reserve Bank, is the only survey conducted on a regular basis (every three years).
Urban/Rural Distribution of Homes
Excerpt:
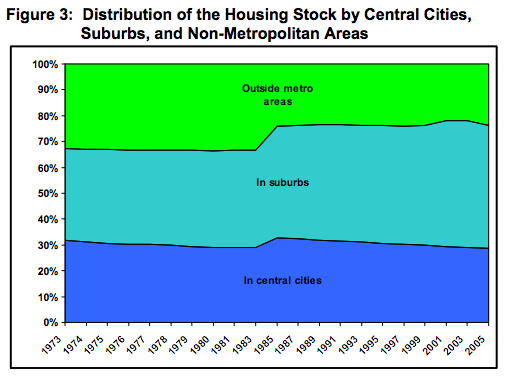
Figure 3 traces the changing shares of the housing stock in “outside metropolitan” areas, in suburbs, and in central cities. The over-the-period changes coincide with expectations; the suburban share is substantially larger in 2005, while the shares in central cities and outside metropolitan areas are smaller. However, the trends are not smooth. The share outside metropolitan areas falls sharply between 1983 and 1985, and the central city share generally declines except for a one-time increase between 1983 and 1985. The discontinuities between 1983 and 1985 result from the introduction of new definitions of metropolitan area—changes that increased the population in central cities and suburbs at the expense of the non-metropolitan population. By 2005, suburbs accounted for 47 percent of the housing stock, central cities for 29 percent, and outside metropolitan areas for 24 percent.
src:
Frederick J. Eggers, et al. October 2007.
“32 Years of Housing Data.” P.7.
U.S. Department of Housing and Urban Development
Housing Features
Highlights of Annual 2014 Characteristics of New Housing
Summary of characteristics for new single family homes, multifamily units, and multifamily buildings in 2014.
src:
US Census Bureau. Accessed May 18, 2016.
“Highlights of Annual 2014 Characteristics of New Housing”
*
For the data from the US Census Bureau below, the following definitions may be relevant:
RSE/SE – Relative Standard Error (percent), Standard Error (percentage points)
NA – Not available
A – Represents an RSE or SE that is greater or equal to 100 percent or could not be computed
Z – Less than 500 units or less than 0.5 percent
S – Withheld because estimate did not meet publication standards on the basis of response rate
or a consistency review
The Census data below is all also accessible through the Census Bureau’s “New Single-Family Homes in 2014” interactive graphic. Data for completed (but not necessarily sold) home are also available via that graphic.
Principal Type of Exterior Wall Material of New Single-Family Houses Sold, 1978-2014
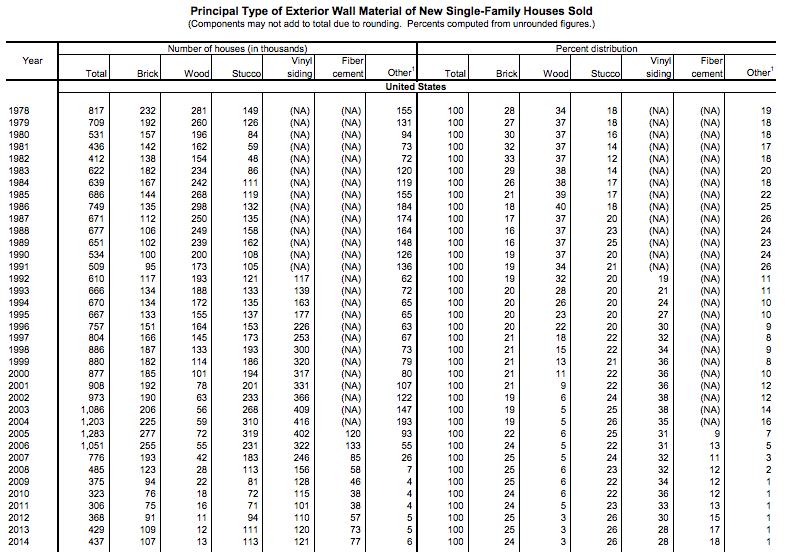
Note 1: Includes concrete block, stone, aluminum siding, and other types.
Data prior to 2005 include fiber cement. Data prior to 1992 include vinyl siding.
src:
US Census Bureau. Accessed May 16, 2016.
“Principal Type of Exterior Wall Material of New Single-Family Houses Sold.” P.1.
*
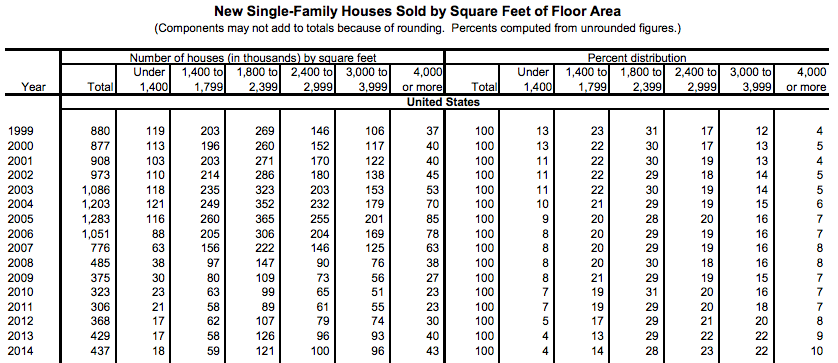
Square Feet of Floor Area in New Single-Family Houses Sold, 1999-2014
src:
US Census Bureau. Accessed May 16, 2016.
“Square Feet of Floor Area in New Single-Family Houses Sold.” P.1.
*
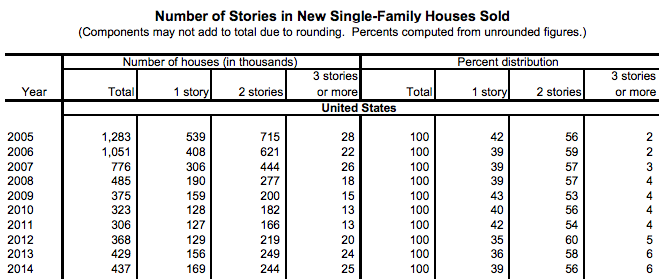
Number of Stories in New Single-Family Houses Sold, 2005-2014
src:
US Census Bureau. Accessed May 16, 2016.
“Number of Stories in New Single-Family Houses Sold.” P.1.
*
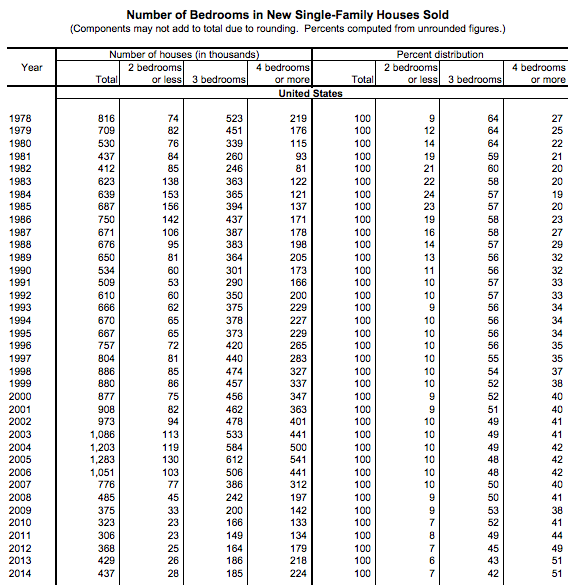
Number of Bedrooms in New Single-Family Houses Sold
1973-2014
src:
US Census Bureau. Accessed May 16, 2016.
“Number of Bedrooms in New Single-Family Houses Sold.” P.1.
*
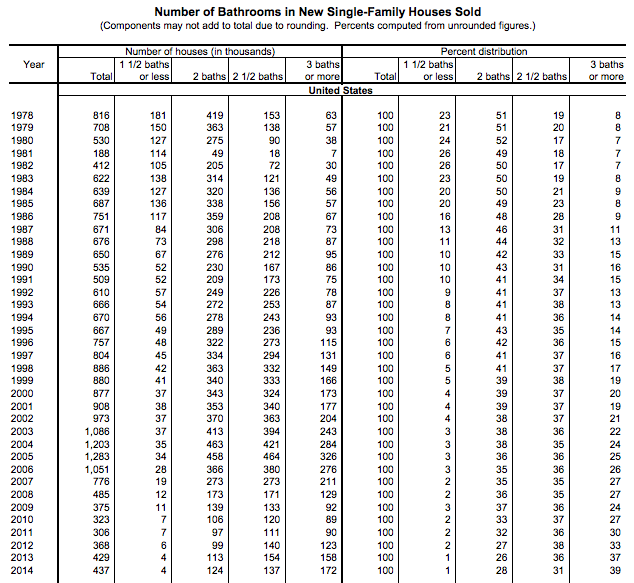
Number of Bathrooms in New Single-Family Houses Sold, 1978-2014
src:
US Census Bureau. Accessed May 16, 2016.
“Number of Bathrooms in New Single-Family Houses Sold.” P.1.
*
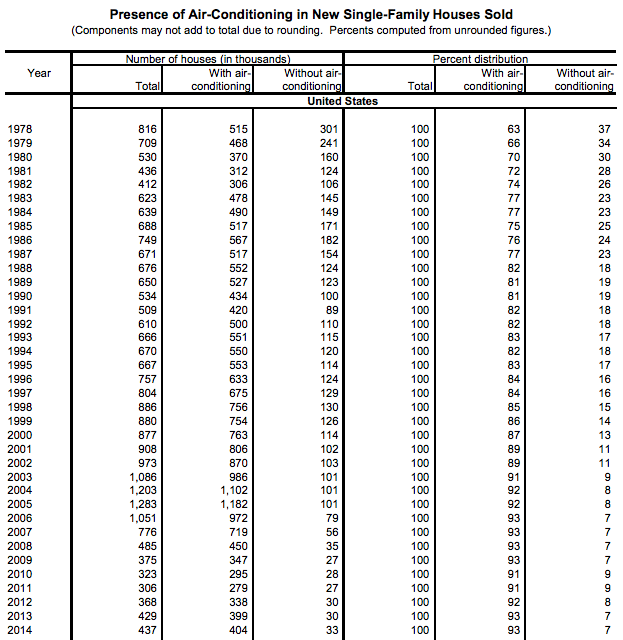
Presence of Air-Conditioning in New Single-Family Houses Sold, 1978-2014
src:
US Census Bureau. Accessed May 16, 2016.
“Presence of Air-Conditioning in New Single-Family Houses Sold.” P.1.
*
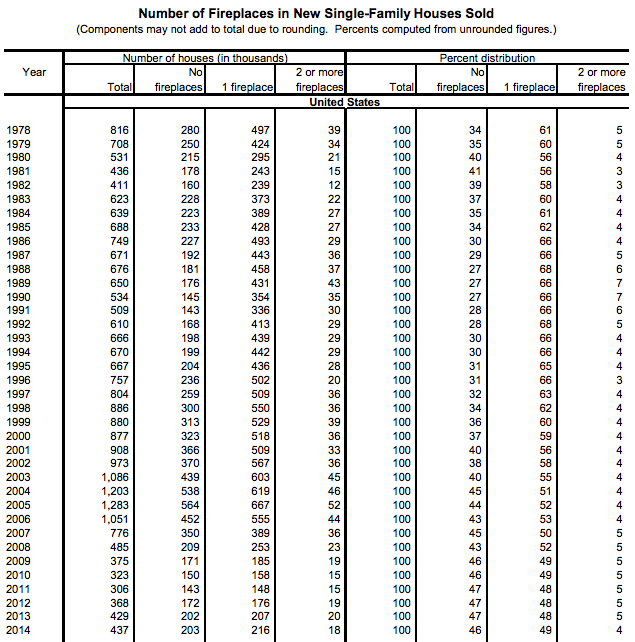
Number of Fireplaces in New Single-Family Houses Sold, 1978-2014
src:
US Census Bureau. Accessed May 16, 2016.
“Number of Fireplaces in New Single-Family Houses Sold.” P.1.
*
Type of Heating System Used in New Single-Family Houses Sold, 1978-2014
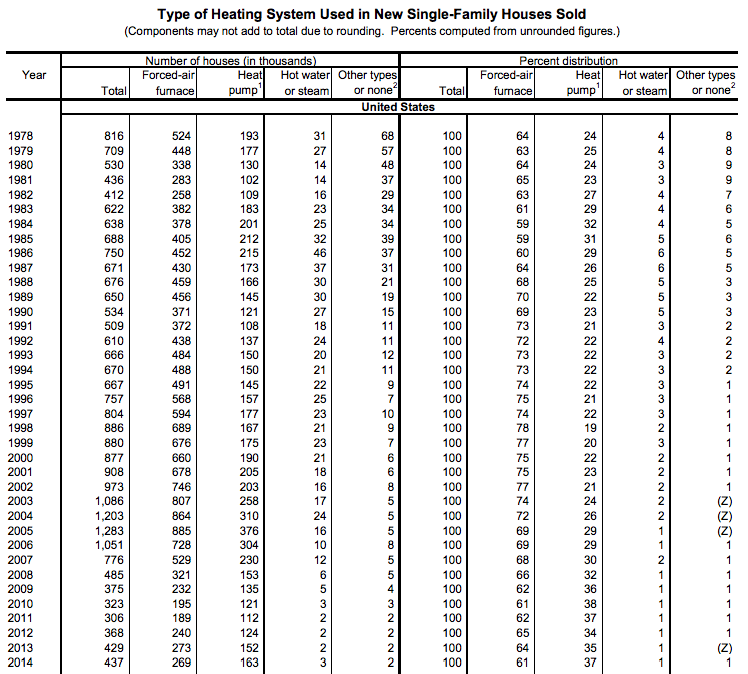
Note 1: Includes both air source and geothermal (ground source) versions.
Note 2: Includes electric baseboard, panel, radiant heat, space heater, floor or wall furnace, solar, and other types.
src:
US Census Bureau. Accessed May 16, 2016.
“Type of Heating System Used in New Single-Family Houses Sold.” P.1.
*
Type of Heating Fuel Used in New Single-Family Houses Sold, 1985-2014
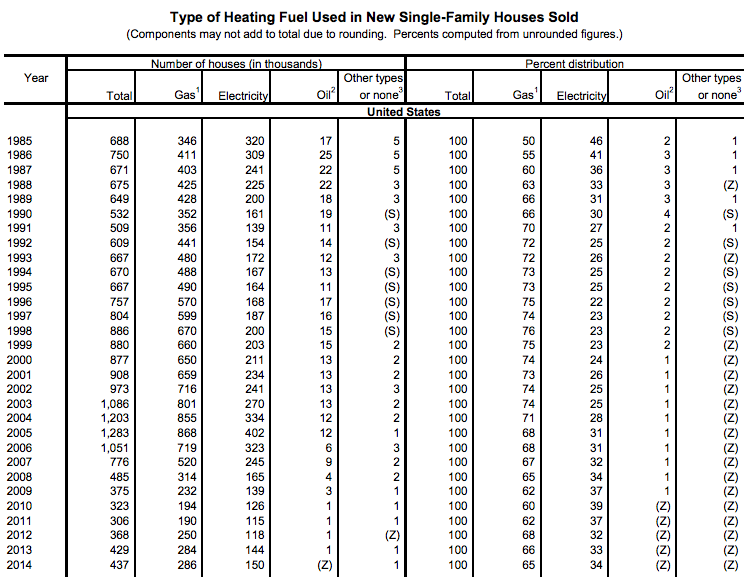
Note 1: Includes natural gas and bottled or liquified petroleum gas (including propane).
Note 2: Includes heating oil and kerosene.
Note 3: Includes wood, coal, solar, and other types. Beginning in 2014, also includes heating oil and kerosene.
src:
US Census Bureau. Accessed May 16, 2016.
“Type of Heating Fuel Used in New Single-Family Houses Sold.” P.1.
*
Type of Foundation in New Single-Family Houses Sold, 1978-2014
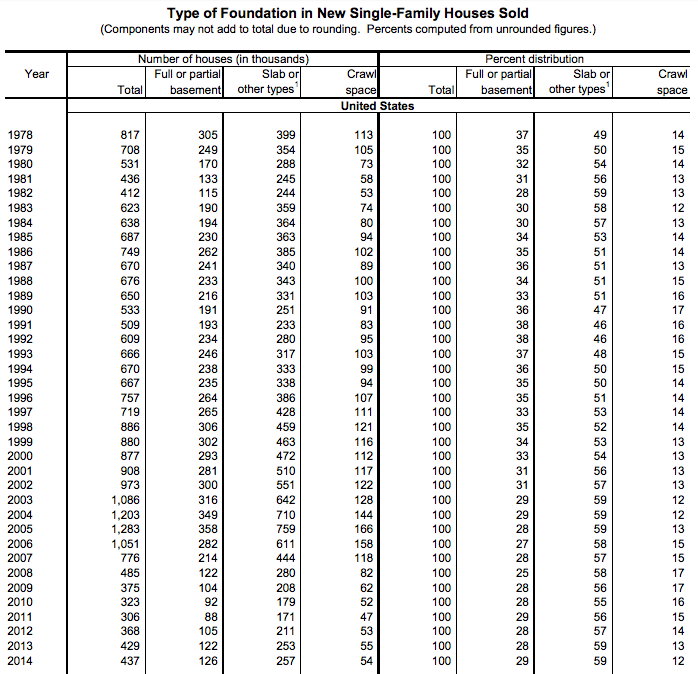
Note 1: Includes raised supports such as pilings and piers, and other types.
src:
US Census Bureau. Accessed May 16, 2016.
“Type of Foundation in New Single-Family Houses Sold.” P.1.
*
Type of Parking Facility of New Single-Family Houses Sold, 1986-2014
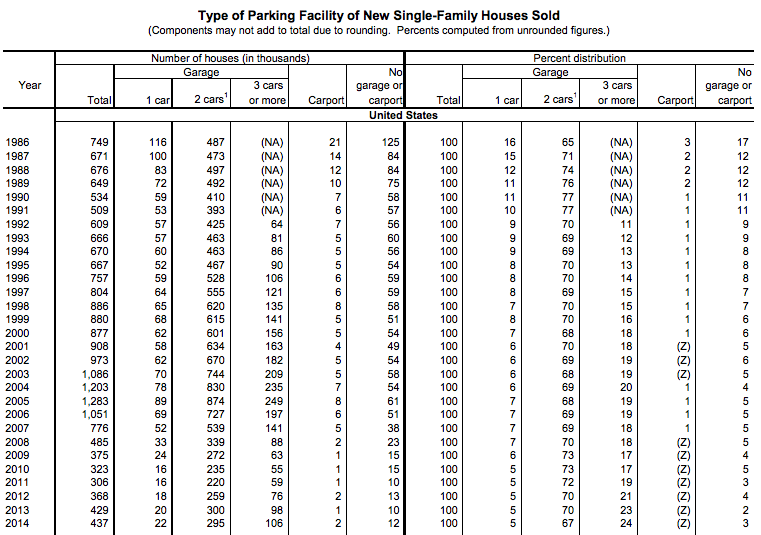
Note 1: Prior to 1992, data included 2 cars or more.
src:
US Census Bureau. Accessed May 16, 2016.
“Type of Parking Facility of New Single-Family Houses Sold.” P.1.
*
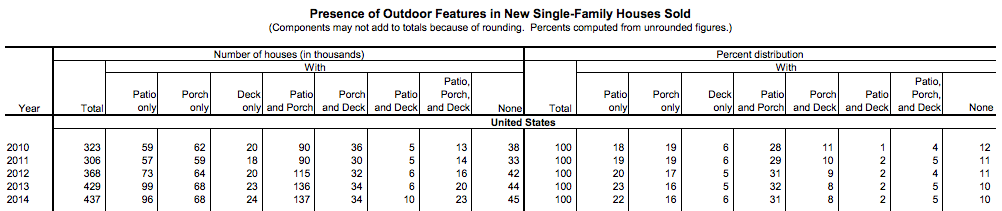
Presence of Outdoor Features in New Single-Family Houses Sold, 2010-2014.
src:
US Census Bureau. Accessed May 16, 2016.
“Presence of Outdoor Features in New Single-Family Houses Sold.” P.1.
*
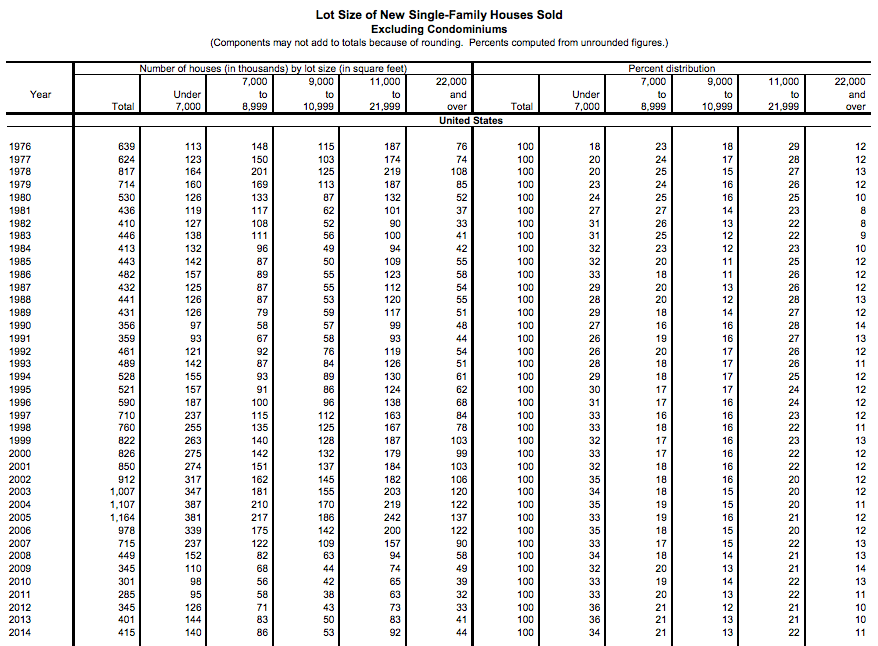
Lot Size of New Single-Family Houses Sold, 1976-2014
src:
US Census Bureau. Accessed May 16, 2016.
“Lot Size of New Single-Family Houses Sold.” P.1.
*
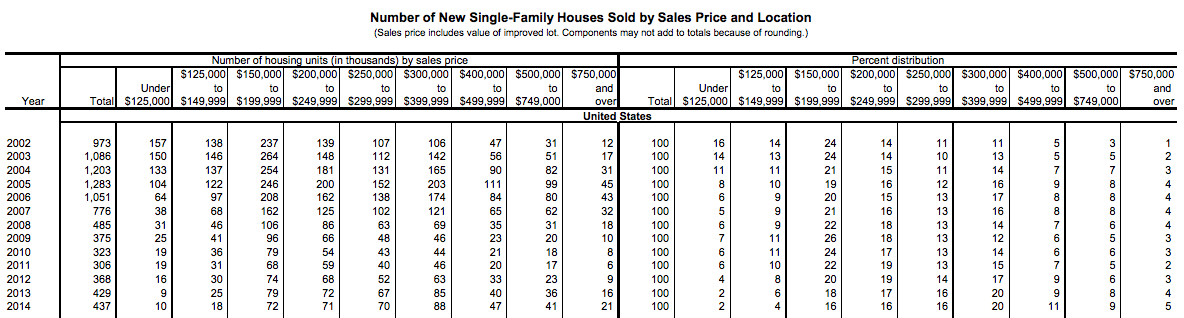
Number of New Single-Family Houses Sold by Sales Price, 2002-2014
src:
US Census Bureau. Accessed May 16, 2016.
“Number of New Single-Family Houses Sold by Sales Price and Location.” P.1.
*
Number of Multifamily Units Completed by Number of Units Per Building, 1972-2014
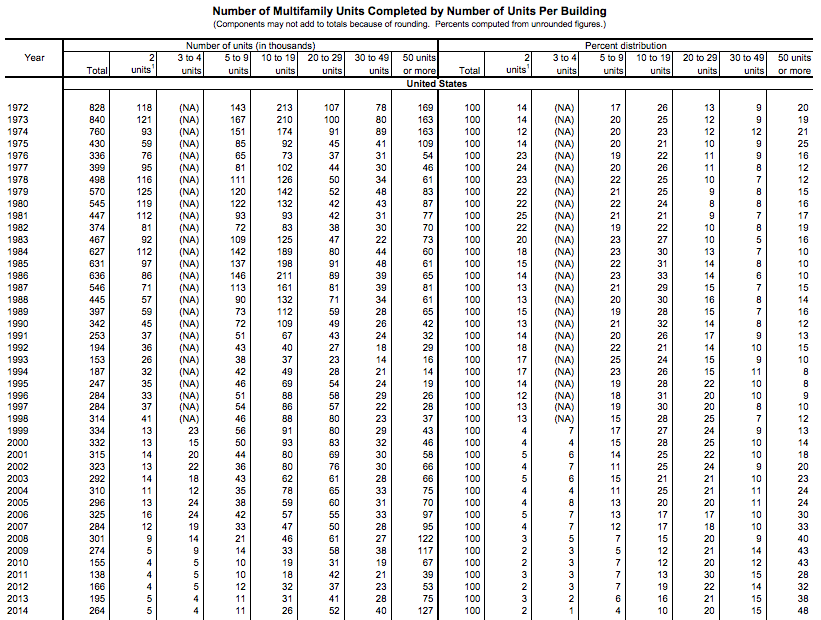
Also available in the PDF linked below: Multifamily units completed for Rent vs Sale, 1999-2014
src:
US Census Bureau. Accessed May 18, 2016.
“Number of Multifamily Units Completed by Number of Units Per Building”
*
Number of Multifamily Units Completed by Square Feet per Unit, 1999-2014
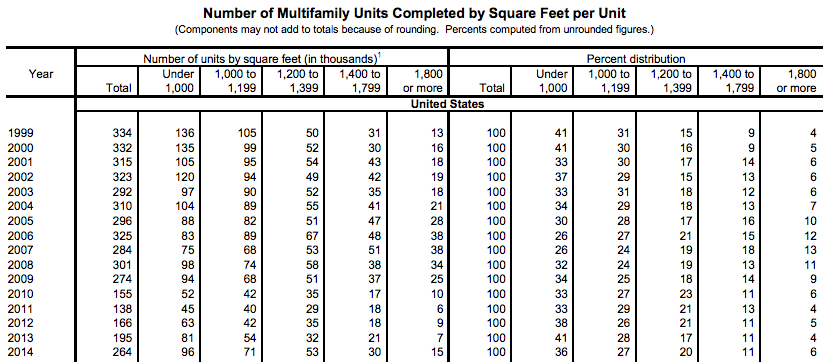
src:
US Census Bureau. Accessed May 18, 2016.
“Number of Multifamily Units Completed by Square Feet per Unit”
*
More characteristics of units in multifamily units and buildings available from the US Census Bureau, here: Multifamily Units, Multifamily Buildings
*
American Housing Survey
Survey run since 1973, but haven’t found a source for aggregated historic data
All annual reports available here.
Indicators present in the 1973 report
Number of all housing units (numbers back to 1970)
Number of unites in structure (back to 1973)
Median number of rooms per unit (total, owner, renter)
Percent with two bedrooms (total, owner, renter)
Percent with 3 bedrooms or more (total, owner, renter)
Percent with 1.01 or more persons per room (total, owner, renter)
2-or-more-person households (total, owner, renter)
male head-wife present, no nonrelatives (total, owner, renter)
other male head (total, owner, renter)
female head (total, owner, renter)
1-person households (total, owner, renter)
owner-occupied unites (total, in central cities, no in central cities, non-metropolitan)
renter-occupied units (same as above)
Median value (1973 vs 1970)
Median gross rent (1973 vs 1970)
Median income (owner-occupied, renter-occupied, 1973 vs 1970)
src:
US Census Bureau. July 1975.
“Annual Housing Survey: 1973 — Part A, General Characteristics”
Households
Total Number of US Households 1960-2015 (in millions)
src: Statista. Accessed May 18, 2016.
Note: This /has to be/ Census data.
TO-DO: locate Census source and import data to a Google Sheet.
*
Households makeup forecast to 2035
Uses 2013 Census Bureau data to make 5-year projections from 2015 to 2035. Low, middle, and high projections given.
Includes households by age and race forecasts. Projects total households, married w/o children, married with children, partnered w/o children, partnered with children, single-parent w/o other adults, single-parent with other non-partner adults, single person households, and other households.
src:
Daniel McCue. March 2014.
“Baseline Household Projections for the Next Decade and Beyond.”
Joint Center for Housing Studies, Harvard University.
Click “Household Projection Tables” at the bottom of the page for the original Excel file. Also imported into this Google Sheet.
Home Sales and Spending
New Single-Family Home Sales
1978-2012 – chart with line only, no numeric figures for individual years
[NAHB-NewSFHSales-1978-2011.jpg]
src:
“New Home Sales”
NAHB, Accessed May 16, 2016
Annual Numeric values for 2011-2015 available here
src:
“New and Existing Home Sales, U.S.”
NAHB, April 25, 2016
US Census Bureau – New Residential Sales, Historical Data
linking out to…
Houses Sold by Region – Annual Data, 1963-2015
Includes US total for each year
src:
US Census Bureau
Houses for Sale by Region, 1963-2015
Median and Average Sales Prices of New Homes Sold in United States, 1963-2015
Houses Sold by Type of Financing, 1988-2015
Private Residential Construction Spending Index, 2000-2016
line chart with lines for
single-family
multifamily
improvements
Index, with 1/1/2000 as the base
Chart shows multifamily housing with the strongest growth in the last two years, improvements as the most stable over the whole period.
src:
Na Zhao. May 2, 2016. “Multifamily Spending Continues Record Breaking Pace.” NAHB Eye on Housing.
