

Media/Internet Time Allotment
Overall Media Allotment
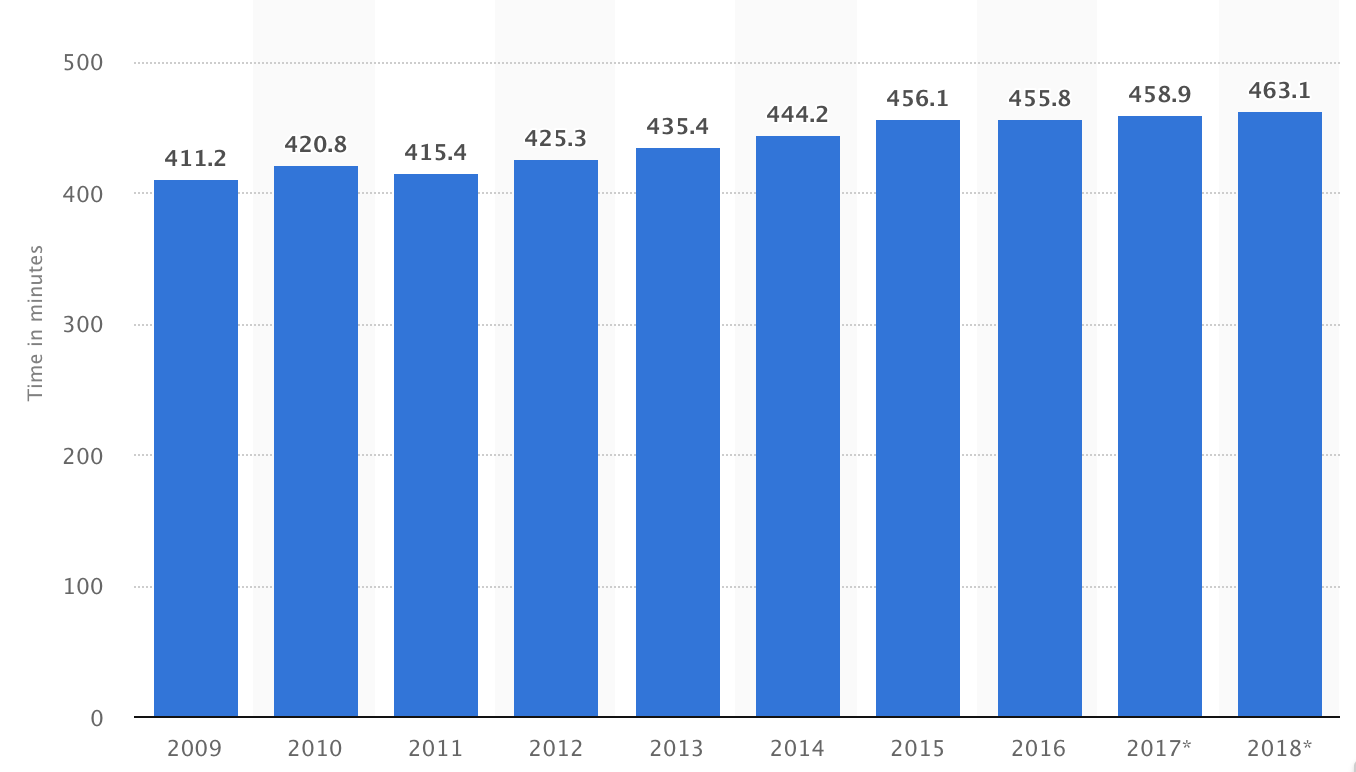
src:
Statista, accessed May 2018
citing: info not available (likely eMarketer)
*
CC’s Note: eMarketer tracks the way people spend their time with media, showing comparison between desk/laptops, mobiles, non-streaming TV, radio, print
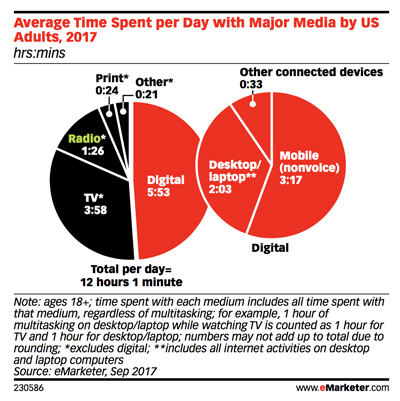
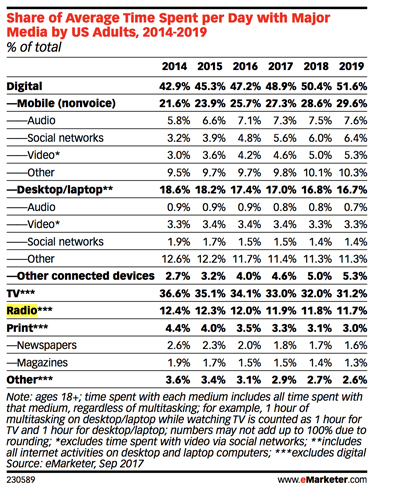
src: eMarketer, Sep 2017
via InsideRadio, Oct 2017
“EMarketer: Adults Spend Half Of Daily Media Usage On Digital”
*
UK Adults’ media time has plateaued
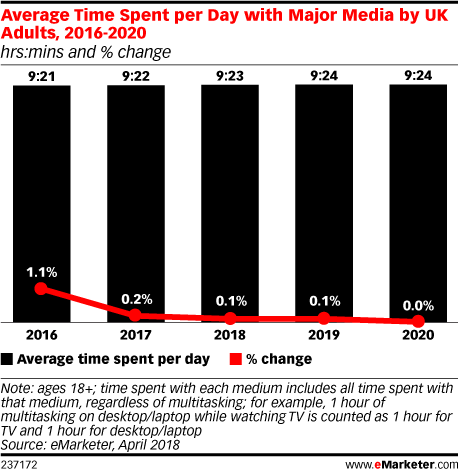
“The way that people consume media will continue to change,” said eMarketer’s UK analyst, Bill Fisher. “Many traditional habits are simply transitioning over to digital devices and platforms, while digital-only habits continue to proliferate. However, what’s apparent from this forecast is that UK adults have reached a plateau. While the media mix may ebb and flow, and it will increasingly flow toward mobile, adults’ media consumption capacity has reached its peak.”
*
src: eMarketer
small thumbnails retrieved 5/14/18
permalinks (data restricted by paywall)
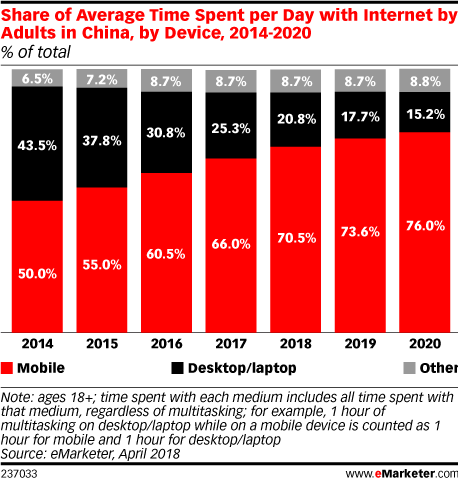
Average time spent per day with internet by adults in China by Device 2014-2020
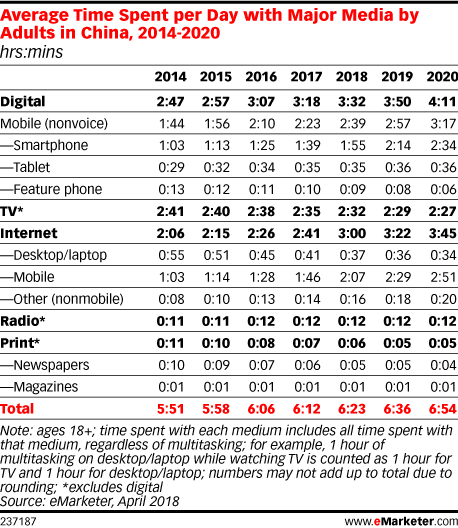
Average time spent per day with major media by adults in China 2014-2020
*
In 2017, daily time spent with digital media among adults will top 3 hours in Japan (3 hours 5 minutes) and South Korea (3 hours 26 minutes). Those in India will average less than half that time (1 hour 18 minutes), with digital accounting for just under one-third of total daily time spent with media.
src:
eMarketer, June 2017
*
Daily time spent on social networking by internet users worldwide from 2012 to 2017 (in minutes)
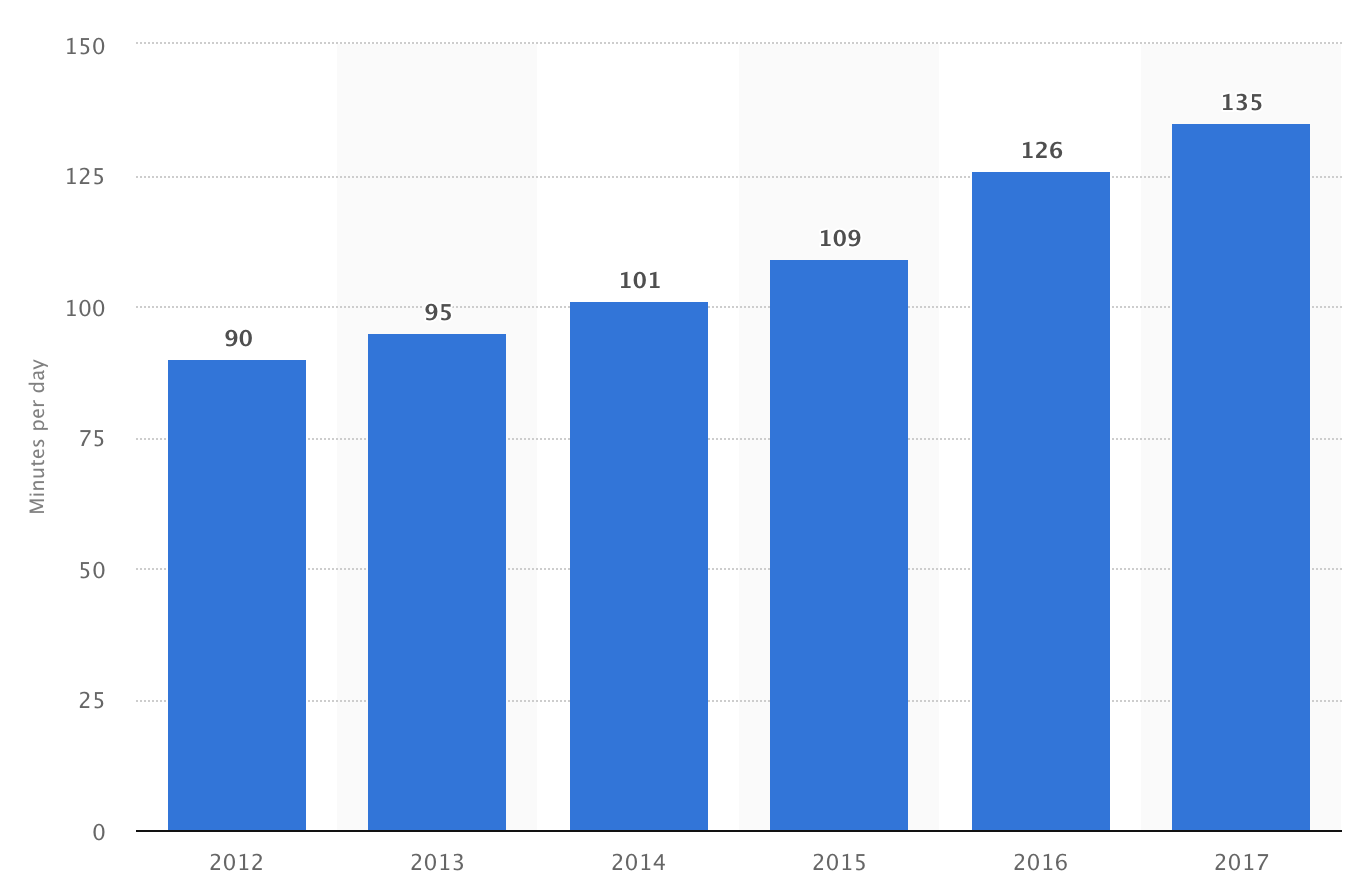
src:
Statista, accessed May 2018
citing: untracked
*******
Mobile Time Allotment
FIGURE A3.1
Traffic Daily Profiles of the Five Major mobile Applications in North America (2020)
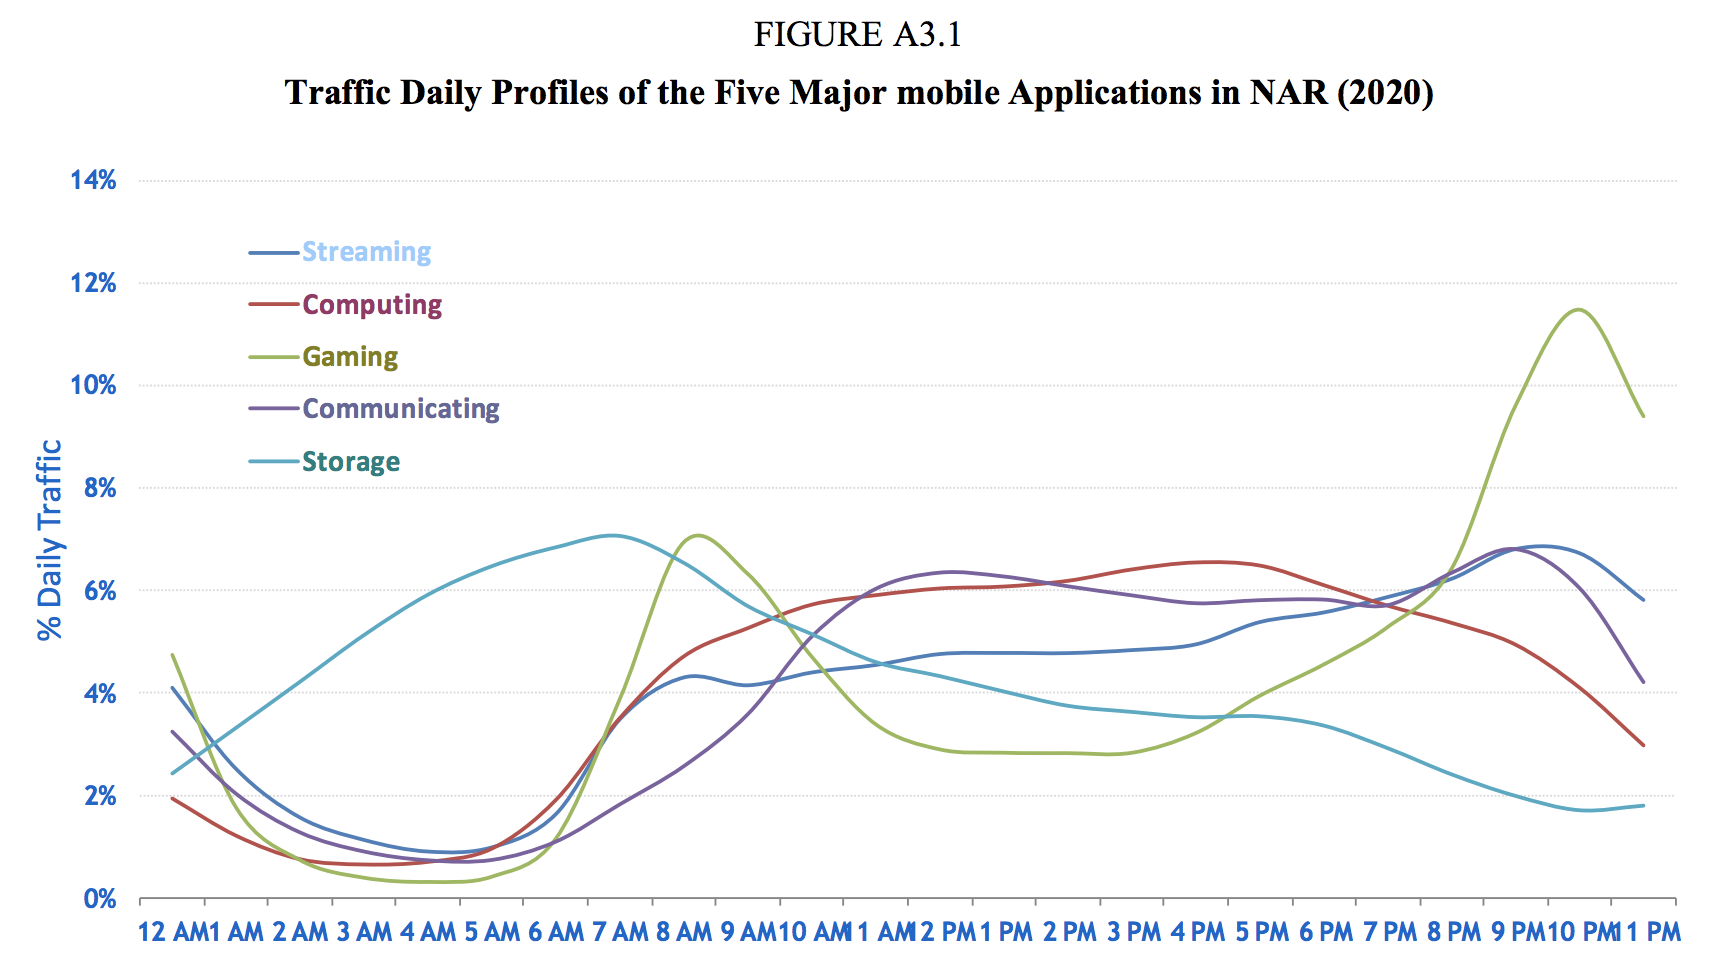
Figure A3.1 shows the daily profiles of the five major mobile applications in North American Region (NAR), namely, streaming (audio and video), computing (cloud processing, office productivity, other mobile applications), storage (media sharing, backup and device synchronisation), gaming (casual, interactive or emerging applications), and communicating (voice, video, e-mail and M2M). All these represent human behaviours and they are similar across geographies.
src:
International Telecommunication Union, July 2015
“Rep. ITU-R M.2370-0: IMT traffic estimates for the years 2020 to 2030”
P.40-41
citing:
Source: Bell-Labs, Alcatel-Lucent, 2015.
[CC’s note: Haven’t been able to track this down]
*
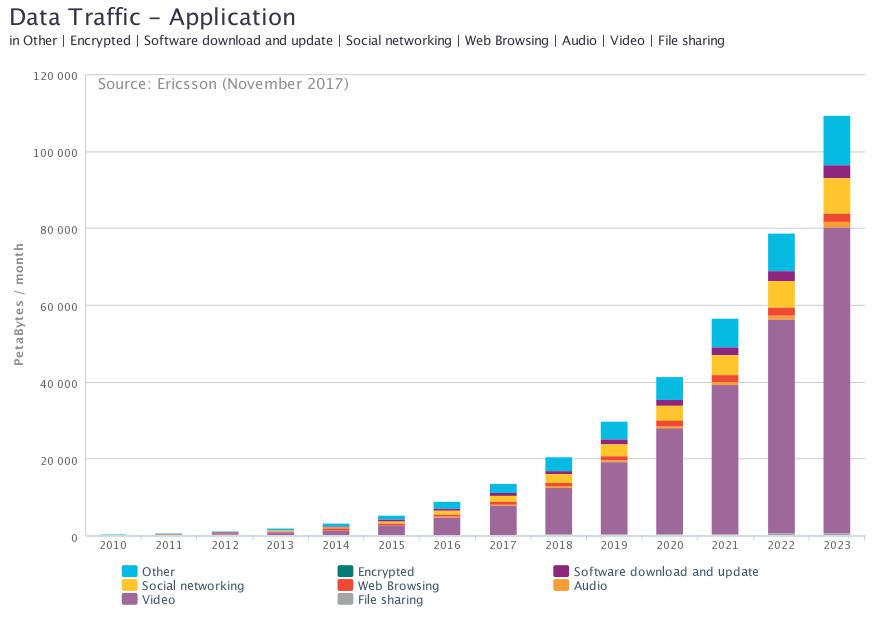
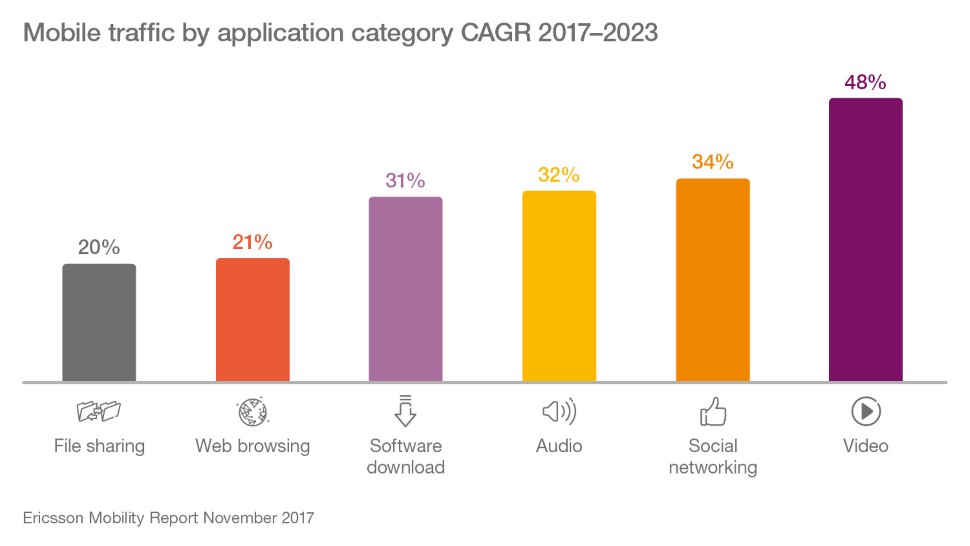
Mobile traffic distribution over different applications
Contrast with voice usage
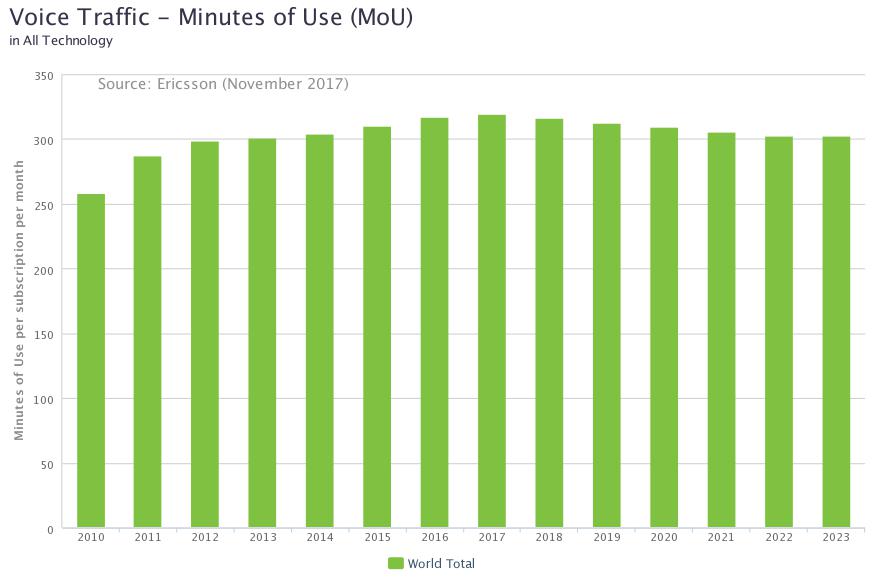
[Data here: Ericsson-Minutes-of-voice-monthly-2010-2023.xls]
src:
Ericsson, Accessed May 2018
Traffic Exploration [interactive data tool]
*
Sandvine, a Canadian network intelligence firm, tracks traffic composition. They’ve published a few reports with the current and previous year’s data, but I haven’t found anything more longitudinal. The reports describe peak period traffic composition across the following categories: real-time entertainment, marketplaces, storage, filesharing, web browsing, gaming, social networking, communications, and other. There are separate charts for mobile and fixed access.
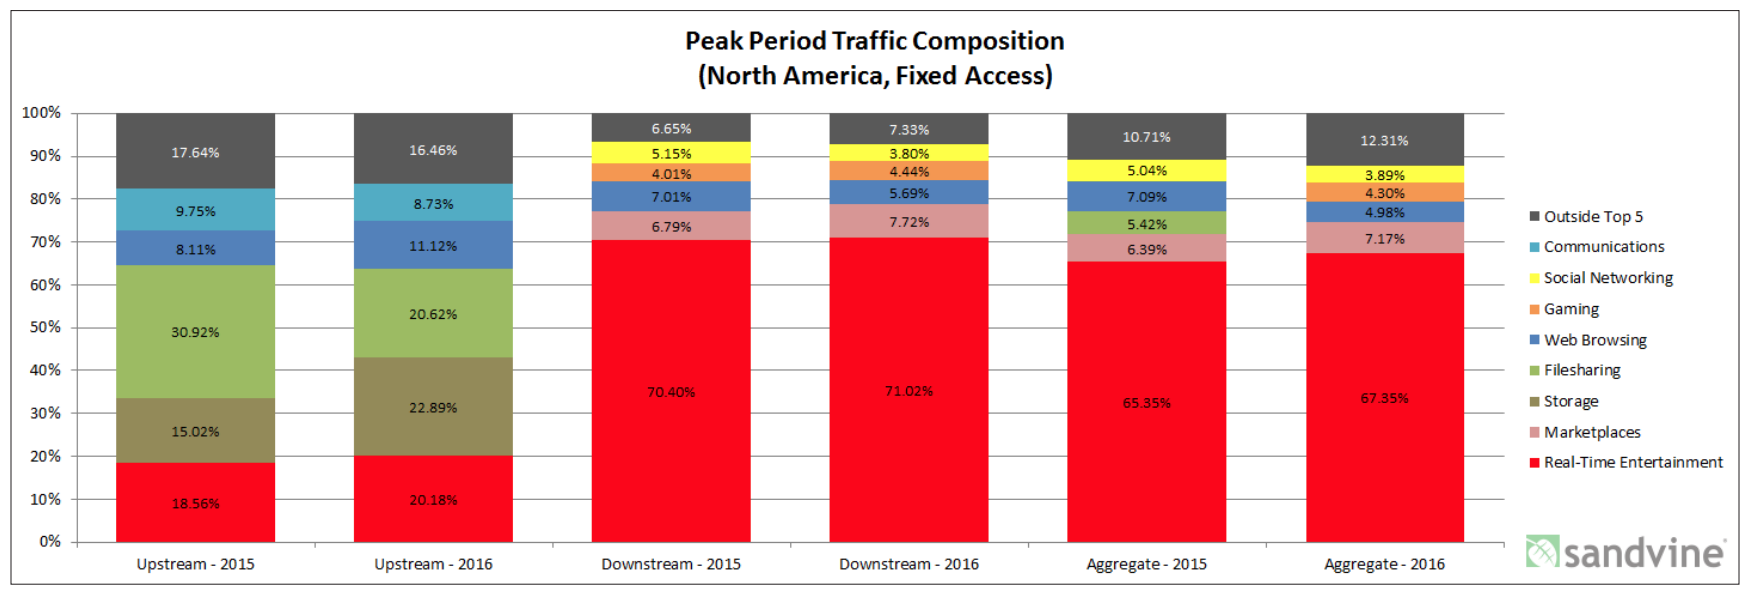
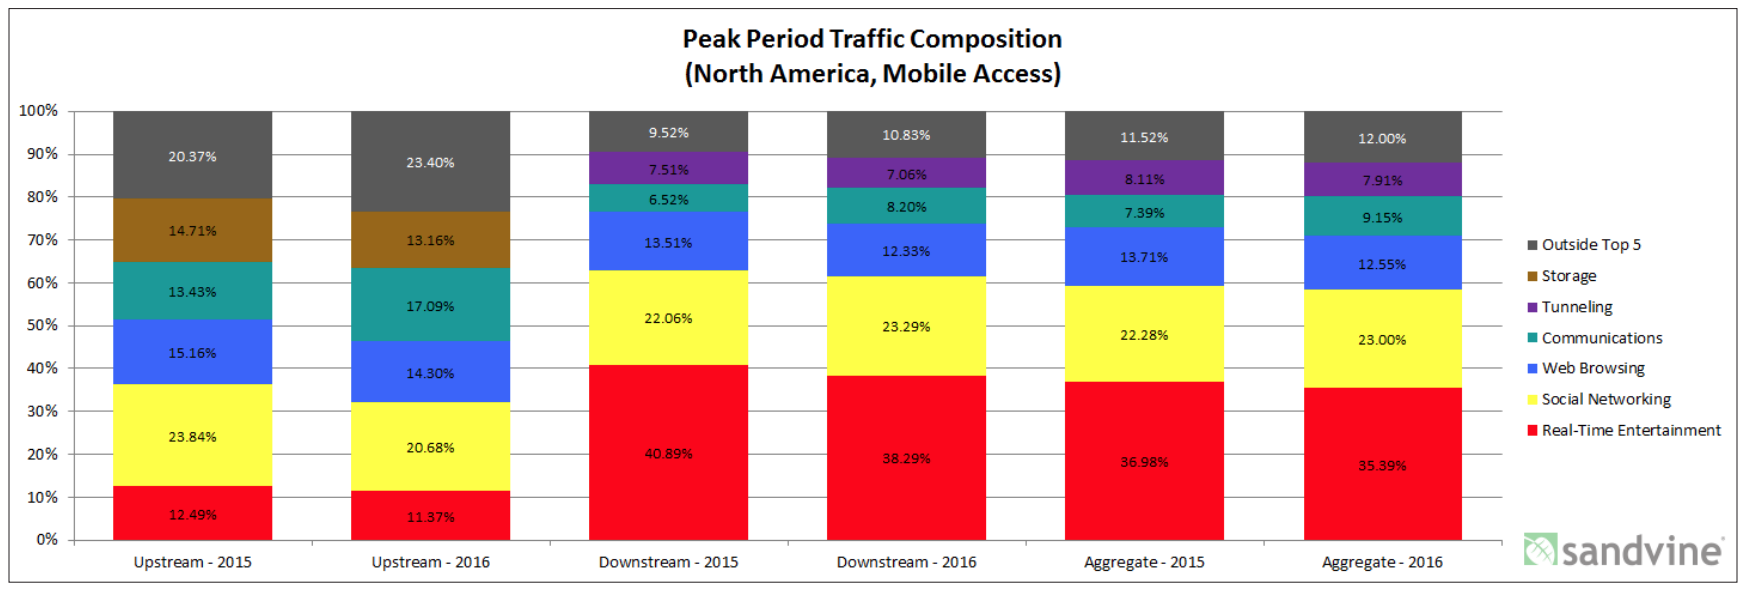
from
“2016 Global Internet Phenomena: Latin America and North America”
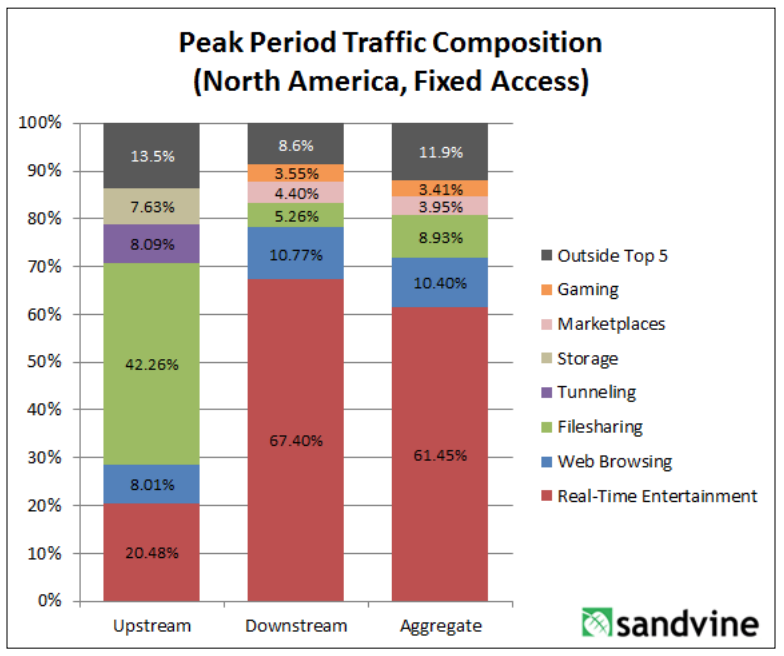
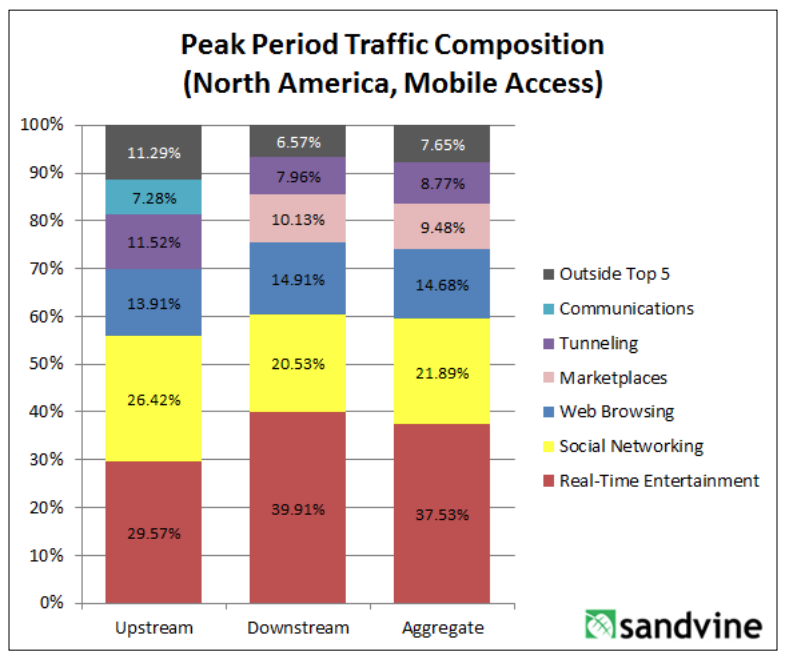
from
“Global Internet Phenomena Report: 2H 2013”
CC’s Note: I’ve not been able to find a more recent version of the report. Sandvine was acquired recently, although the report author is still with the company. Could contact him to ask. Dan Deeth: ddeeth@sandvine.com
*
Comscore is tracking differences between desktop and mobile internet usage.
CC’s note: Not sure if historic data are aggregated, but here’s a sample of recent statistics (covering US, Canada, France, Germany, Italy, Spain, UK, Argentina, Brazil, Mexico, India, Indonesia and Malaysia)
Smartphones are the dominant platform in terms of total digital minutes, in every region Comscore examined.
Most pronounced in India – 89% total minutes
Least noticeable in Canada – 43% of total minutes (42% desktop, 15% tablet)
US: 60% (30% desktop, 10% tablet)
Mobile minutes are overwhelmingly spent with apps – over 80%
Top apps (everywhere, in various rankings) include:
Google Search, Whats App, Facebook, YouTube, Google Play, FB Messenger
Three largest categories where digital time is spent:
Multimedia (includes several large video streaming services), Social Networking, Instant Messengers
Looking specifically at mobile digital time, the top four categories are:
Entertainment, Social Media, Instant Messaging, and Games
On average, Social Media has the largest average share of mobile minutes, but Entertainment is larger in the US and Canada.
Among Social Media apps, Facebook, totally dominates, followed by Instagram, then Snapchat, then Twitter (Twitter’s share is tiny).
Among Messaging apps, WhatsApp totally dominates, then Facebook Messenger (less than half), then WeChat (very small share).
The report includes visualization of platform preferences for certain categories. Business/Finance (which includes banking) shows the most even split between mobile and desktop reach. In the majority of markets, retail is heavily biased toward mobile. News/Information is overwhelmingly biased toward mobile.
(shown for UK and India – both show a fairly even split between desktop and mobile for banking minutes).
The report also includes visualization of subtle seasonality in certain categories of content (shown for UK and Brazil).
src:
Comscore, 2018
“Global Digital Future in Focus”
