

Whole-Day Time Allotment
ASK: Historic trends in time allotment? Global data?
SUMMARY
The Bureau of Labor Statistics has conducted the American Time Use Survey (ATUS) annually since 2003. This is the first federally funded, rigorous time use survey, although other large scale surveys have been conducted in the mid 20th century. Smaller scale time-use diaries were also collected going back to the early 19th century. Much of this data is US-specific, but the UN has aggregated time-use surveys into regional categories.
FINDINGS
Wall Street Journal, in 2016, created some nice, interactive graphics illustrating the changes reflected in the ATUS from 2003 through 2015.
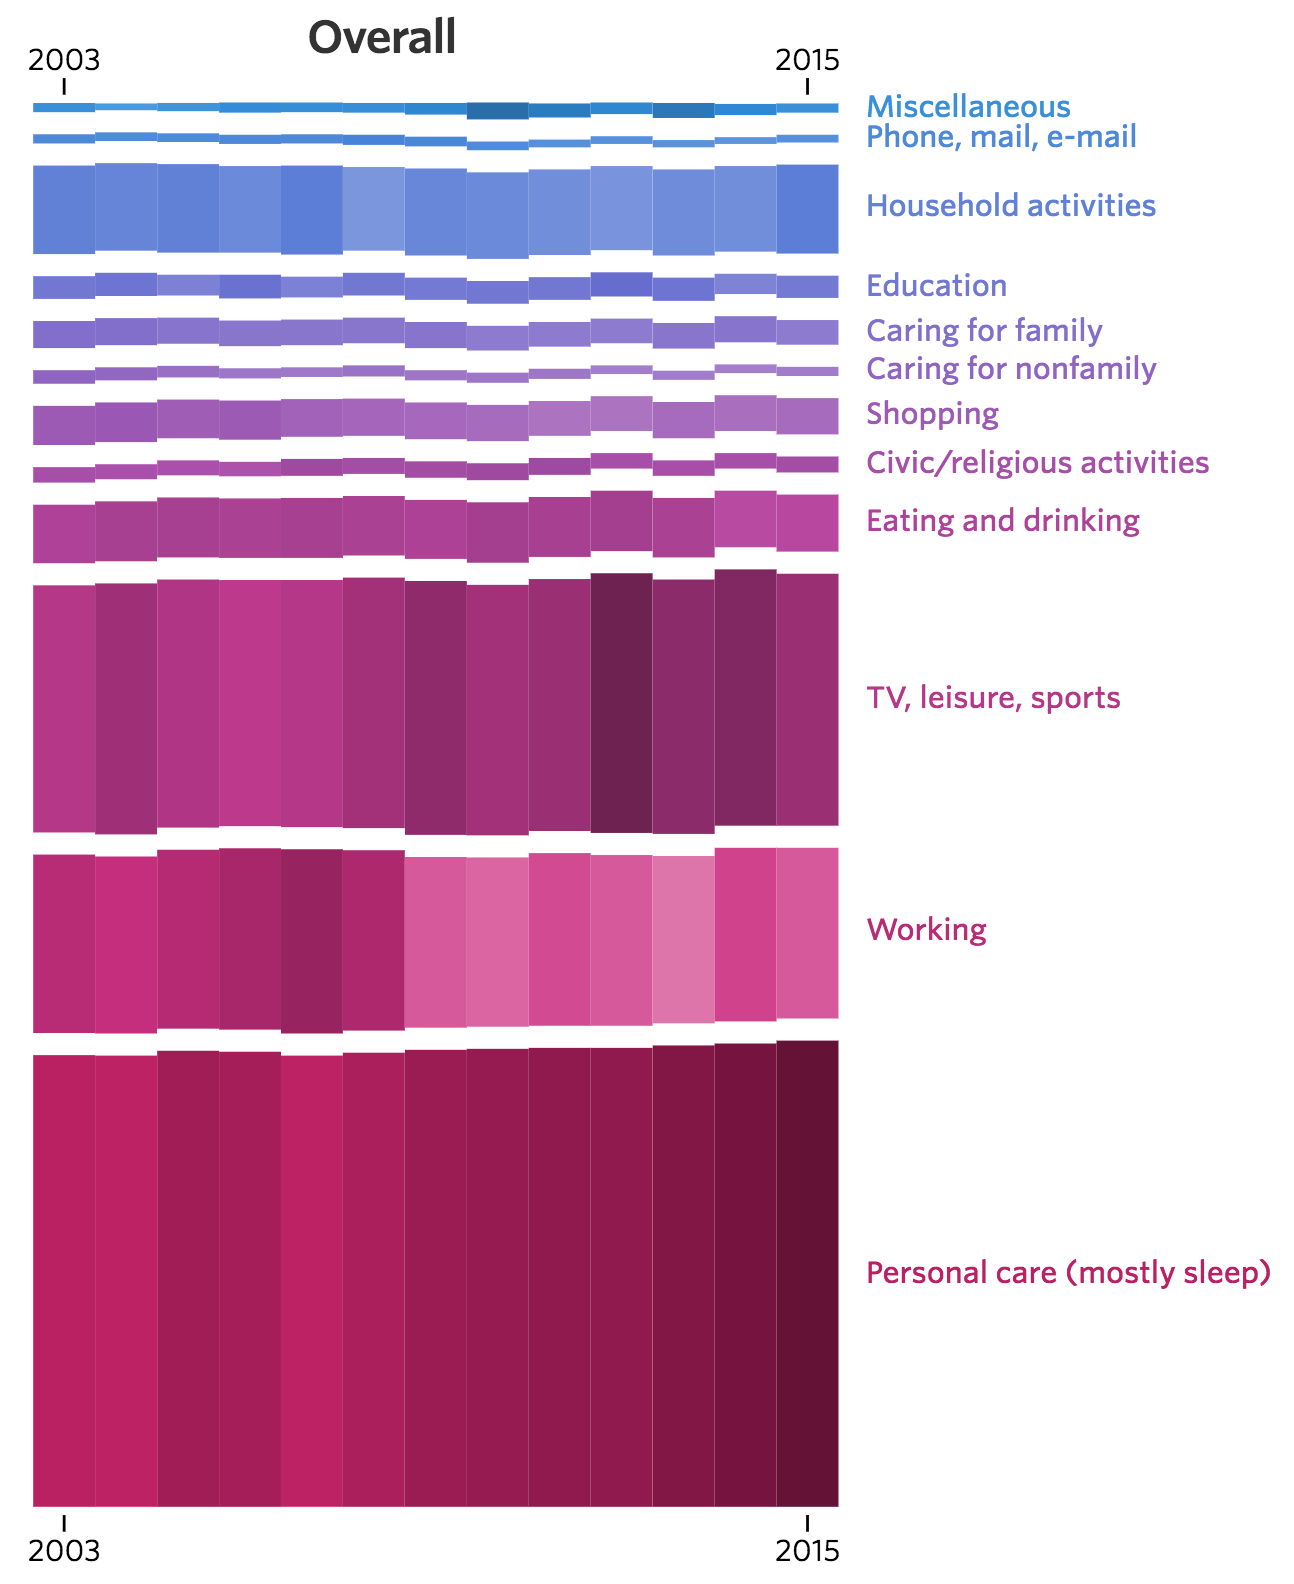
[Click for larger. Visit source for interactive version]
Excerpt:
Americans overall are working less and sleeping more than they were a decade ago, trends that point to an aging population and fewer people in the workforce. But among those who have a job, people are working more. And in general, men spend more time than women on leisure activities, while women sleep about a half-hour more each day.
Additional charts at WSJ show breakdown by sex, employment status, age, and whether children are in the home.
src:
Wall Street Journal, June 2016
“Changing Times: How Americans spend their day reflects a shifting economy and population.”
*
Here are links to the historic BLS time-use data
Data for 2003
See Tables 1 & 2 (pp.9, 10)
src:
BLS, Sep 2004
“Time-Use Survey— First Results Announced By BLS”
Historic tables all linked here
*
Diary data collection in the US dates back to the early part of the 19th century. The first large-scale national sample time use survey was conducted in 1965/1966. Data from this study, and others through 1981, are available via University of Michigan’s Institute for Social Research (ICPSR)
Americans’ Use of Time Series, ICPSR
*
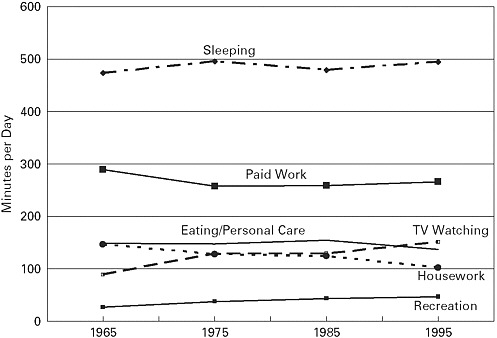
Trends in earlier Americans’ Use of Time Project surveys, 1965-1995
src:
John Robinson, Geoffrey Godbey, 1997
Time for Life: The Surprising Ways Americans Use Their Time
Excerpts:
Distribution of Time in Productive Activities by Gender in Fourteen Countries
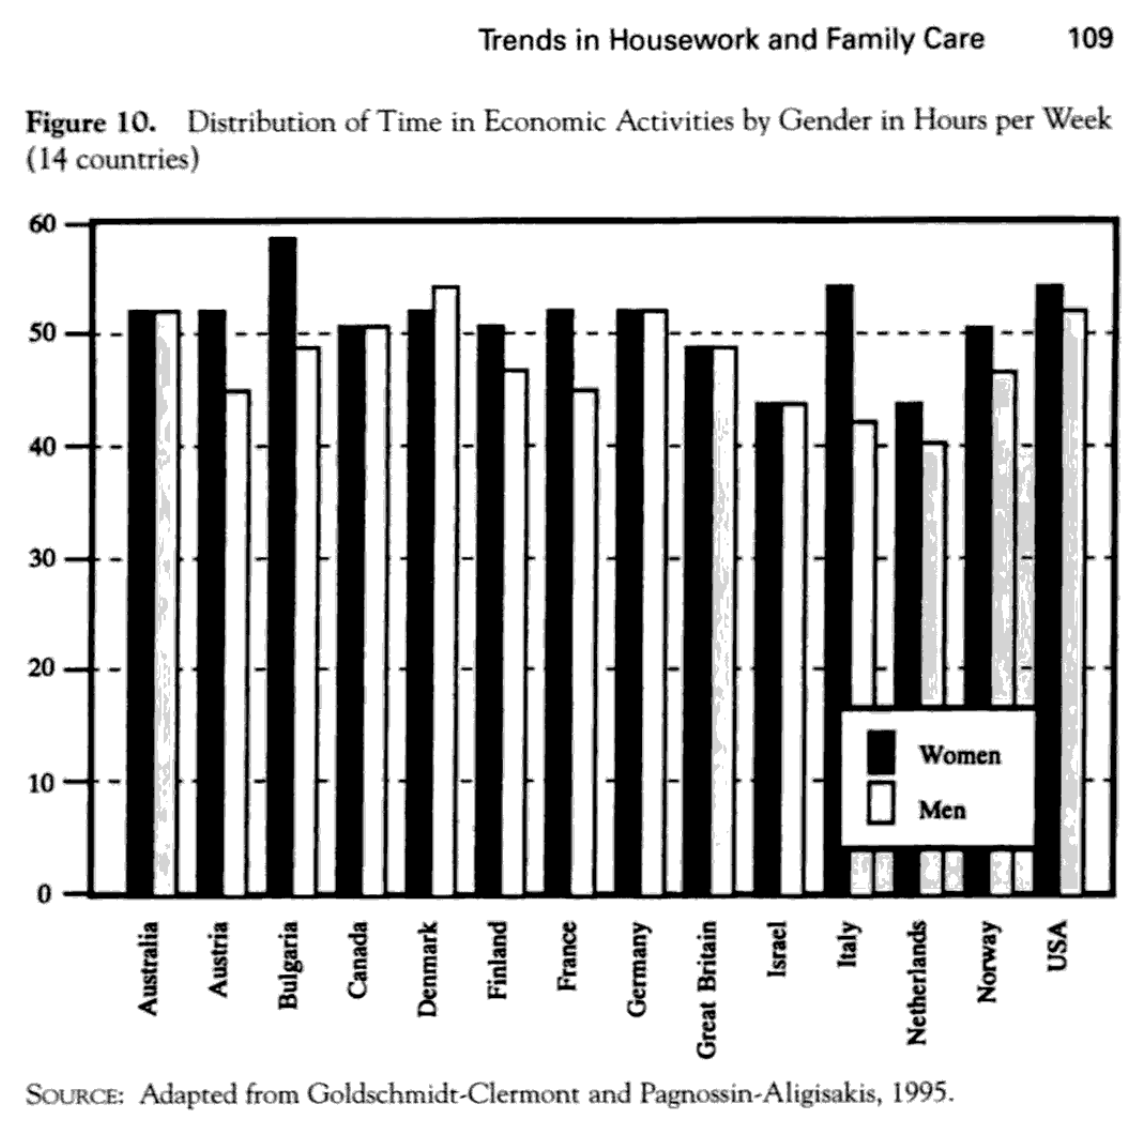
(p.109)
Trends in Free Time and Its Components, 1965-1995 (341)

(p.126)

(p.145)
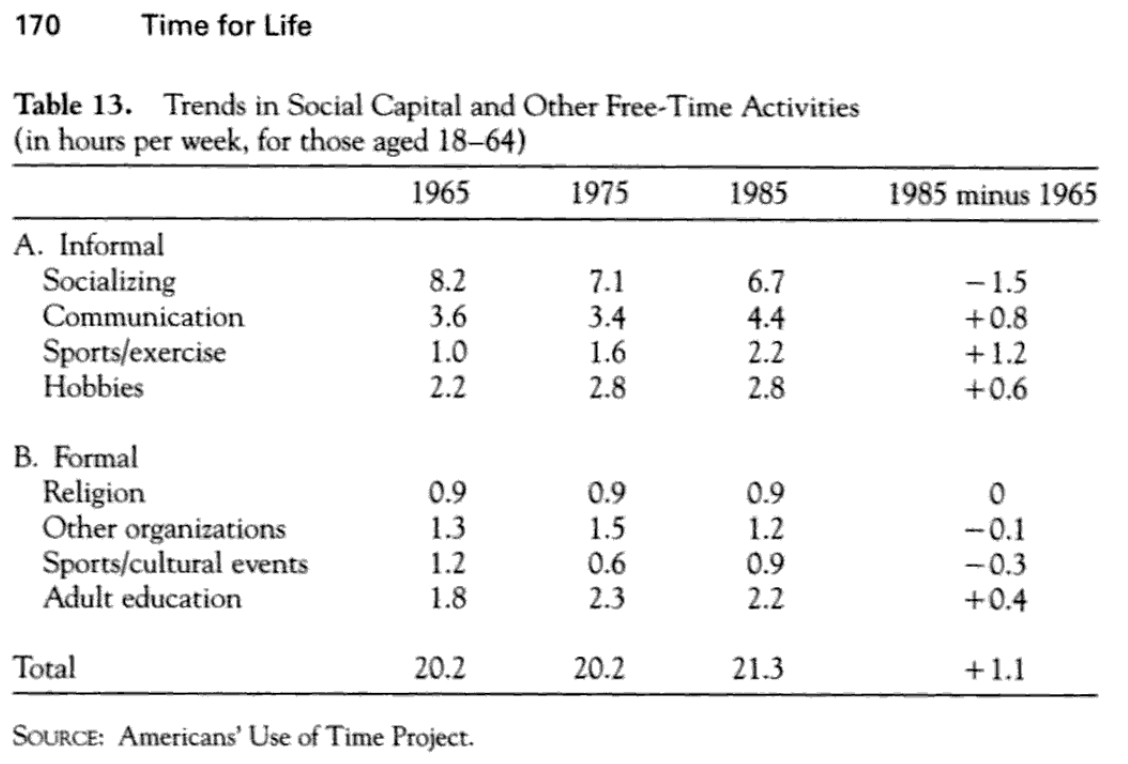
(p.170)
Trends in Different Types of Time for Women and Men, 1965-1995 (348)
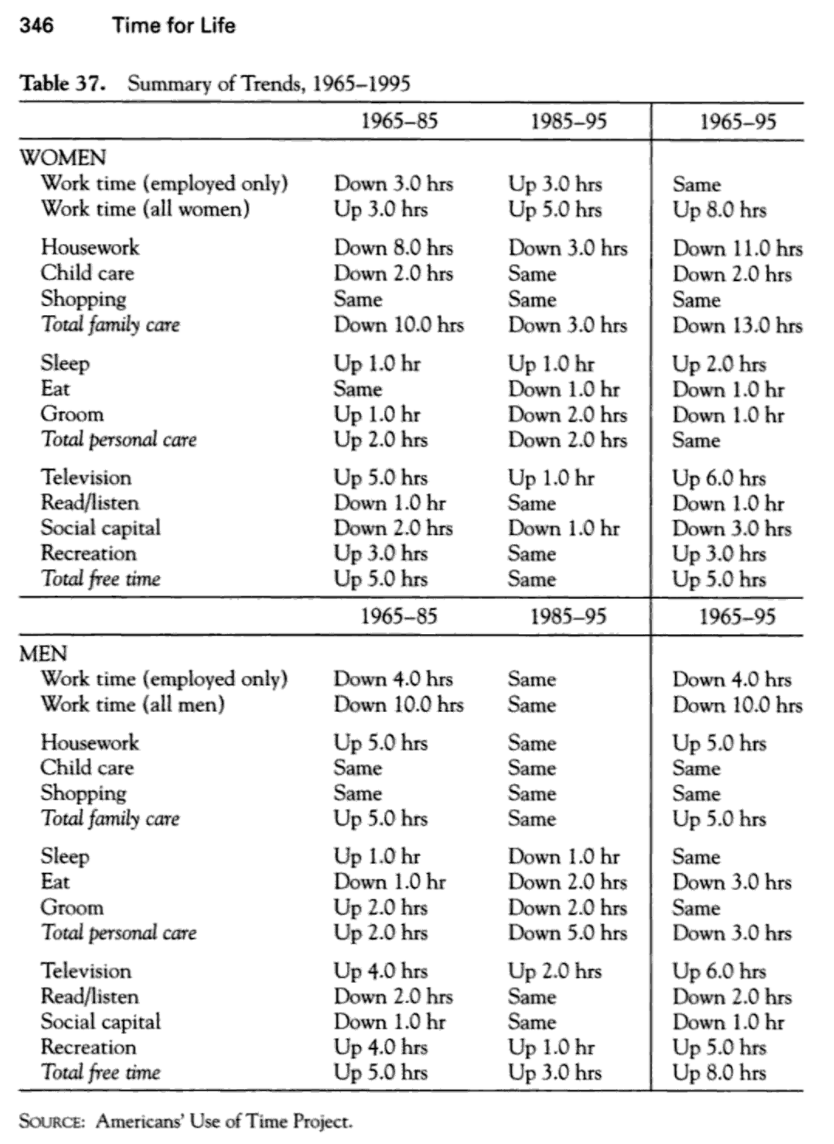
(p.346)
src:
Transportation Research Board and Institute of Medicine, 2005
“Does the Built Environment Influence Physical Activity?: Examining the Evidence — Special Report 282”
p.78, Figure 3-8 Time use, 1965–1995 (ages 18–64).
(data from Robinson & Godbey, above, although the preview of that info is not available in Google)
*
Global aggregation of time-use surveys
United Nations Development Programme, 2015
“Time Use Across the World: Findings of a World Compilation of Time Use Surveys”
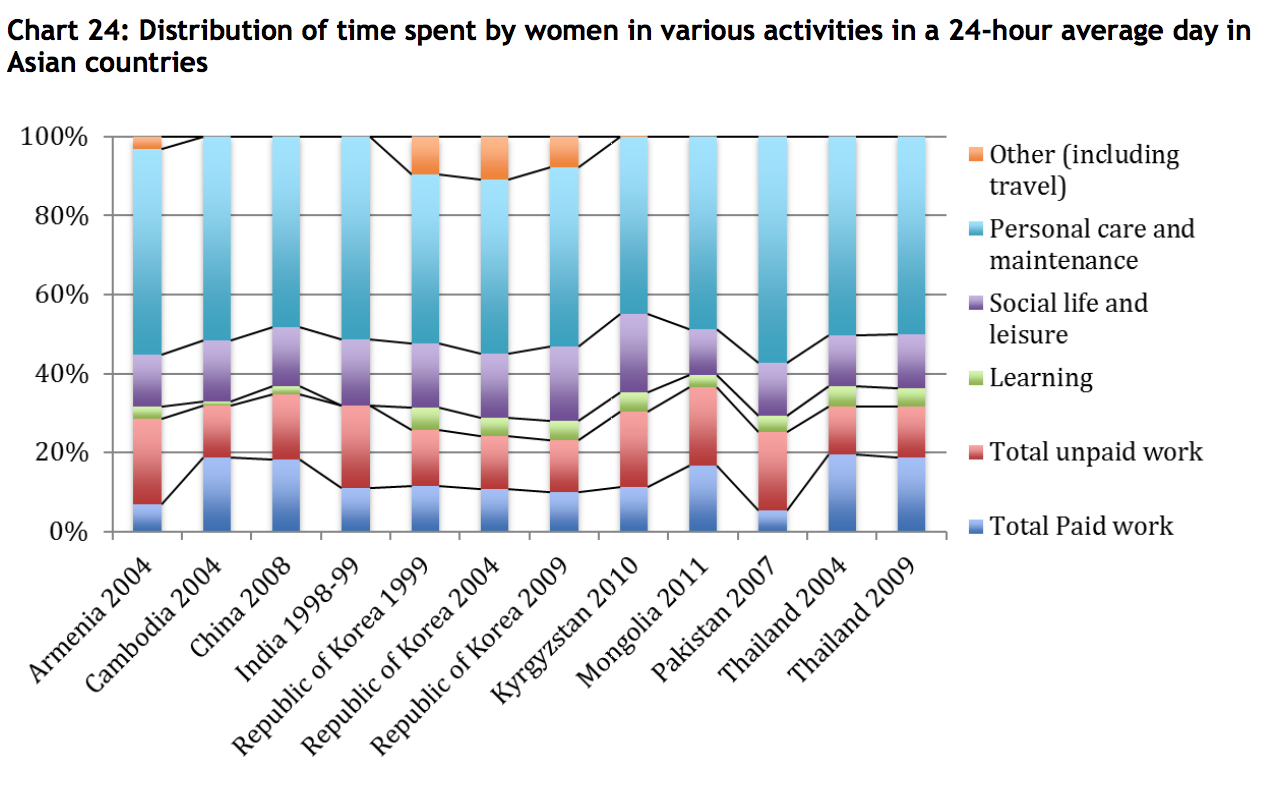
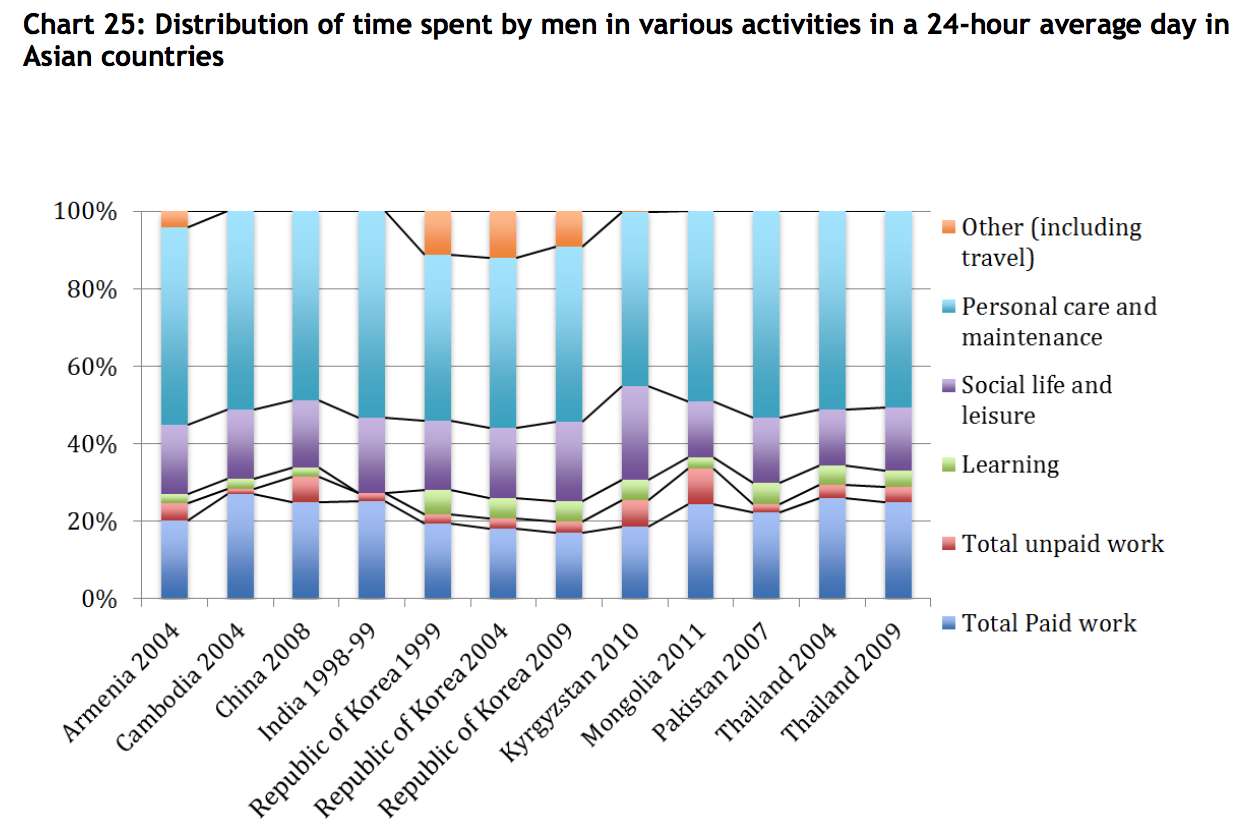
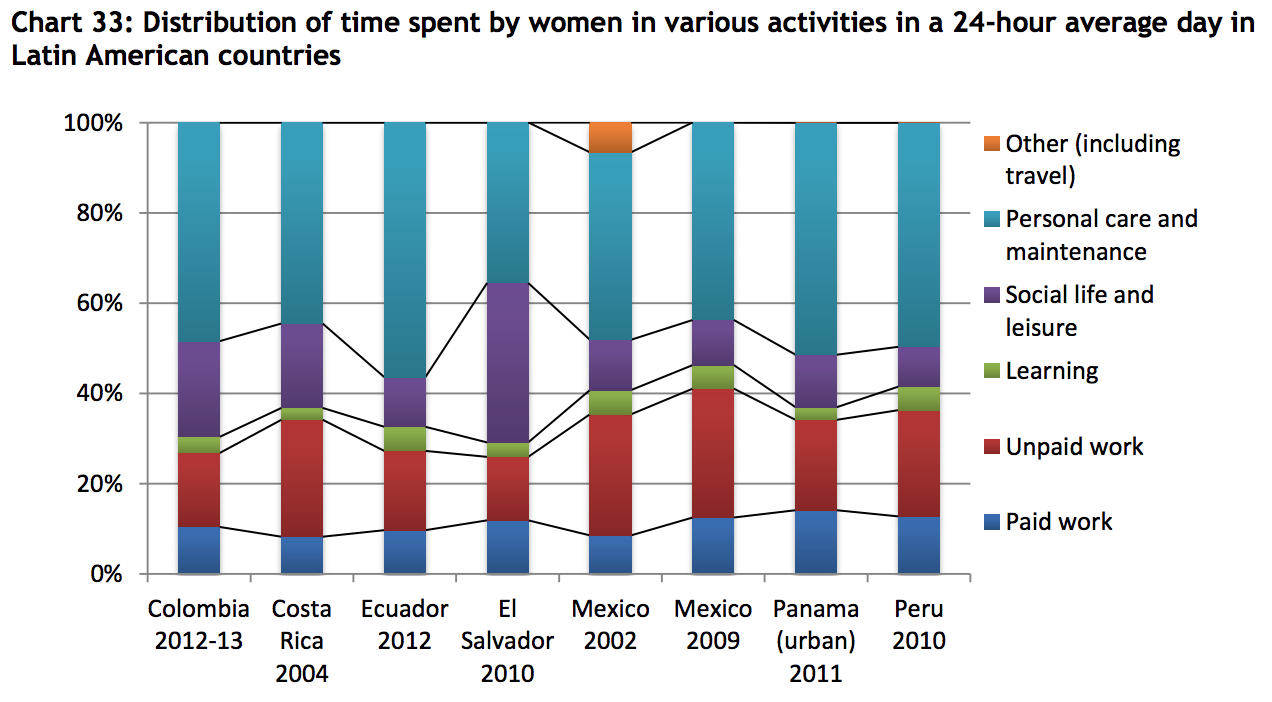
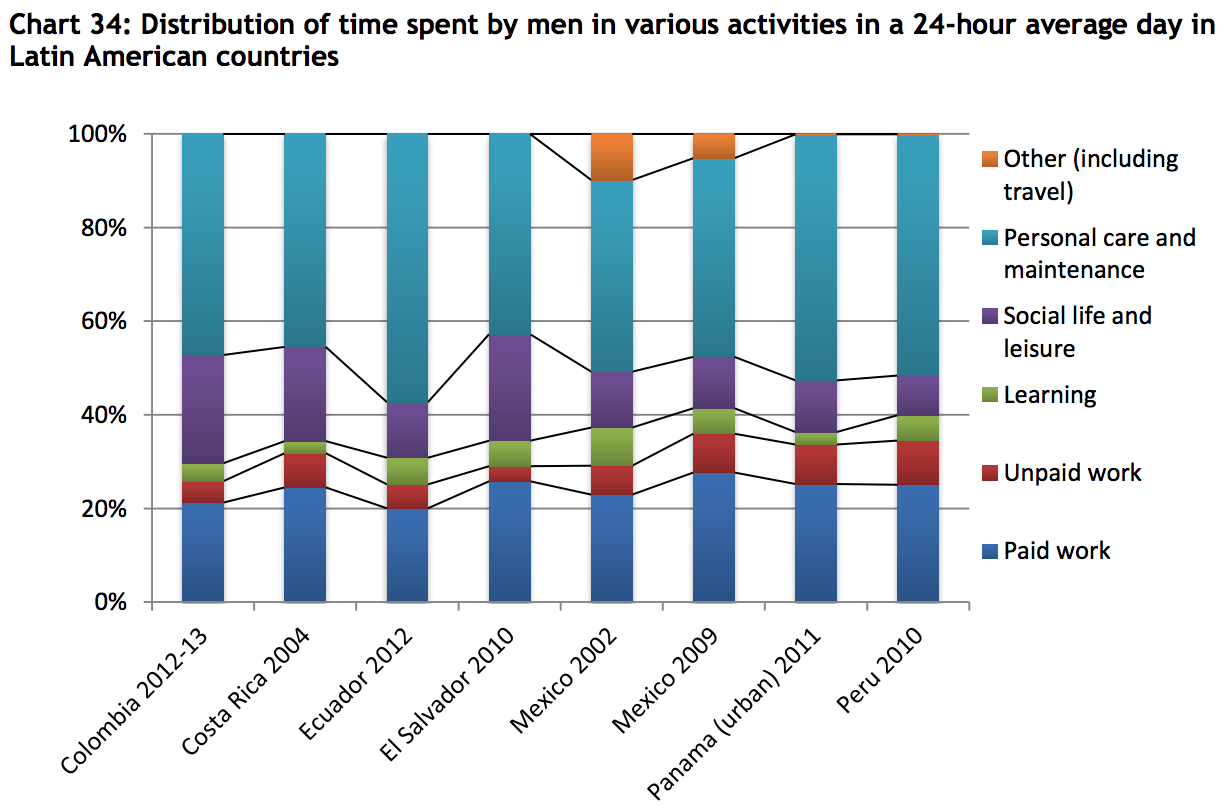
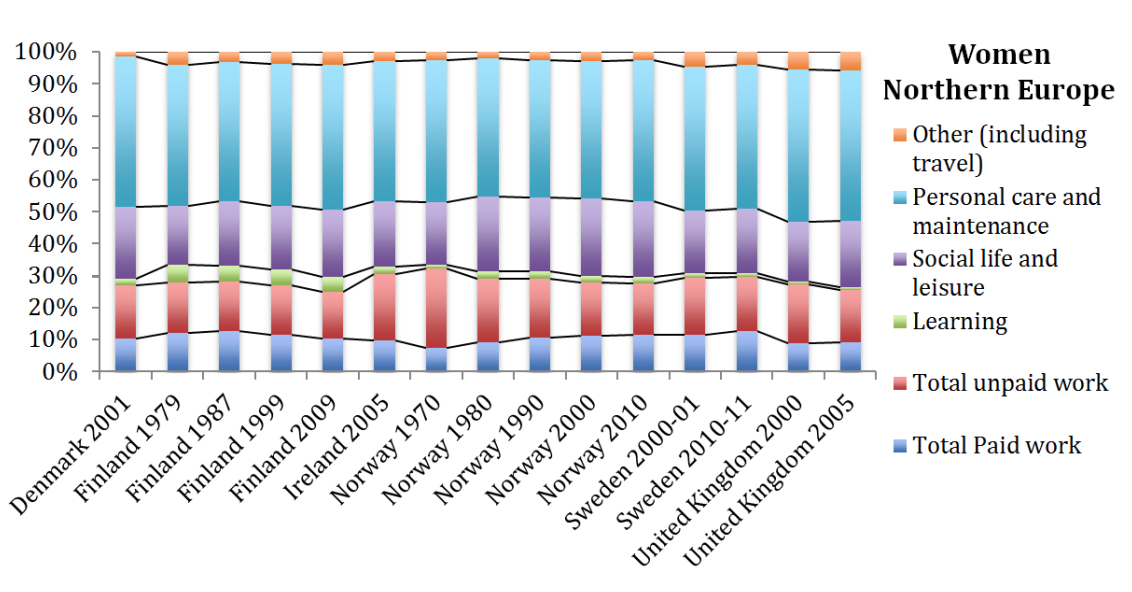
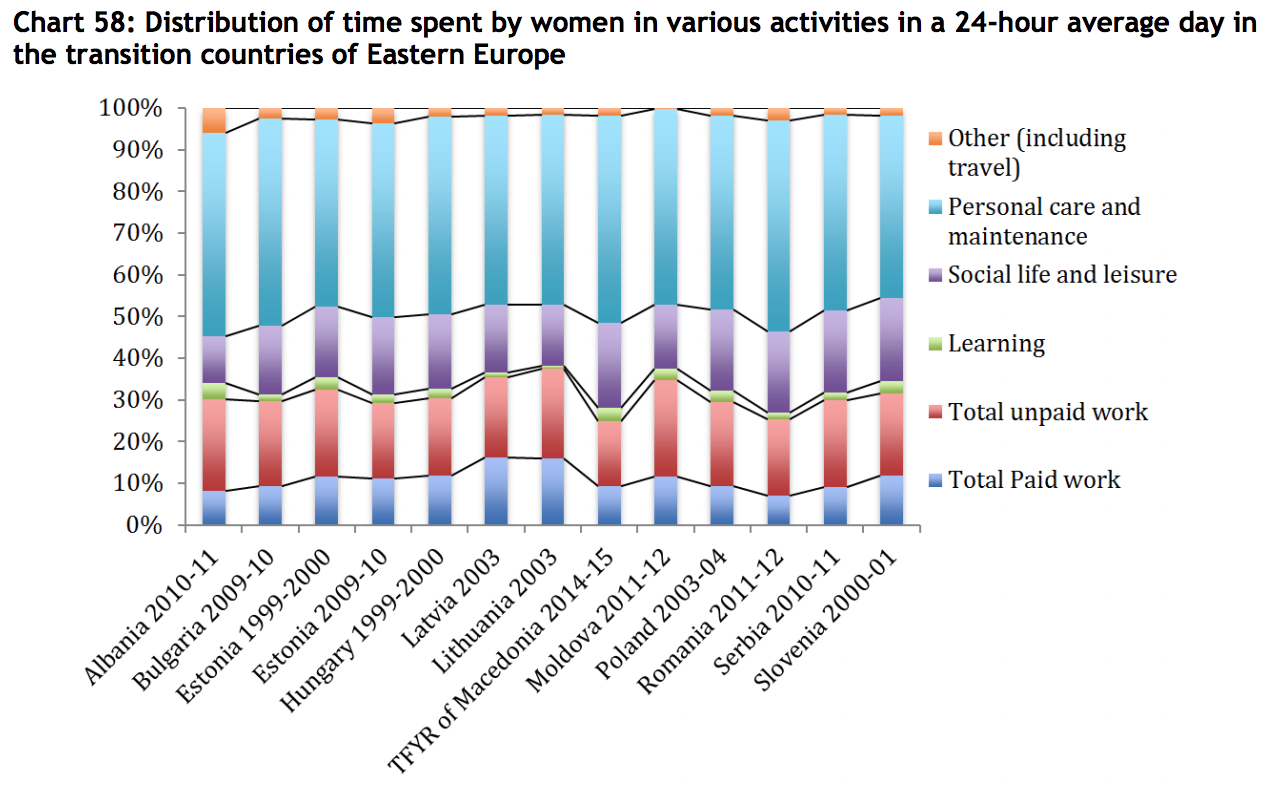
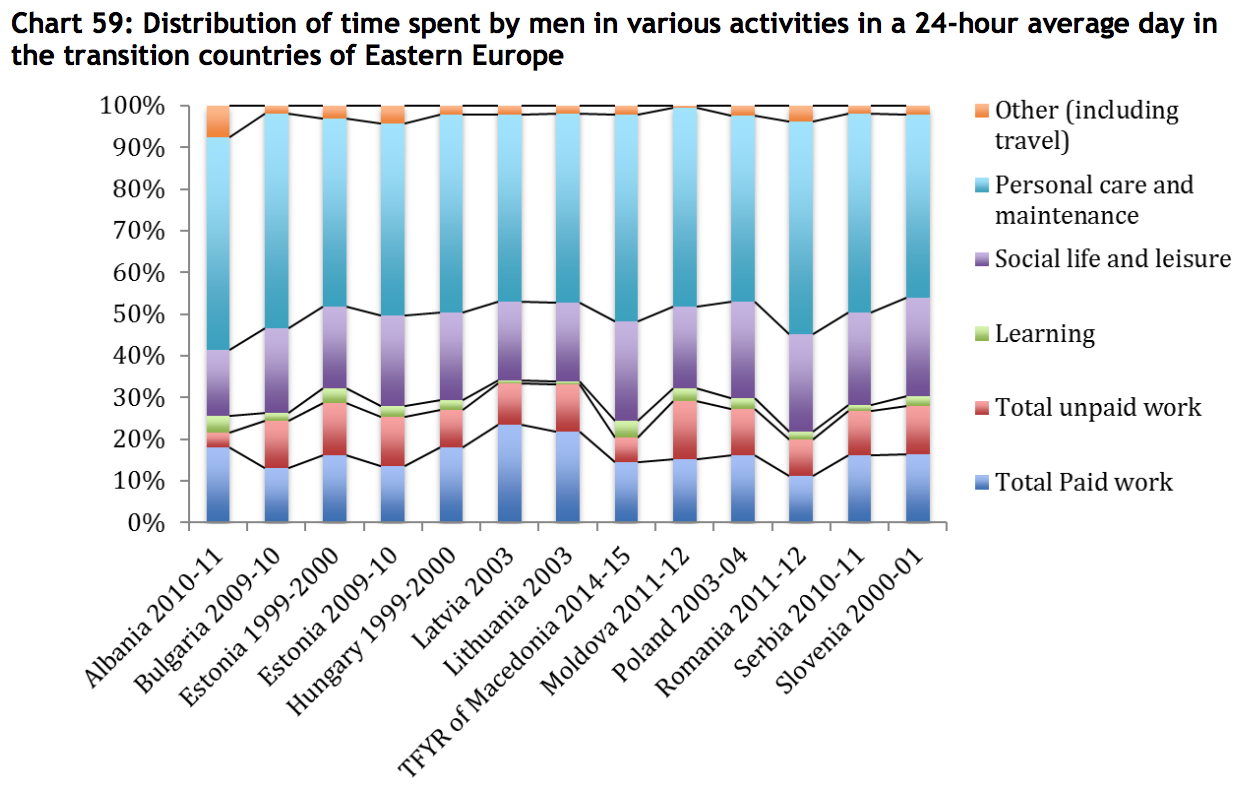
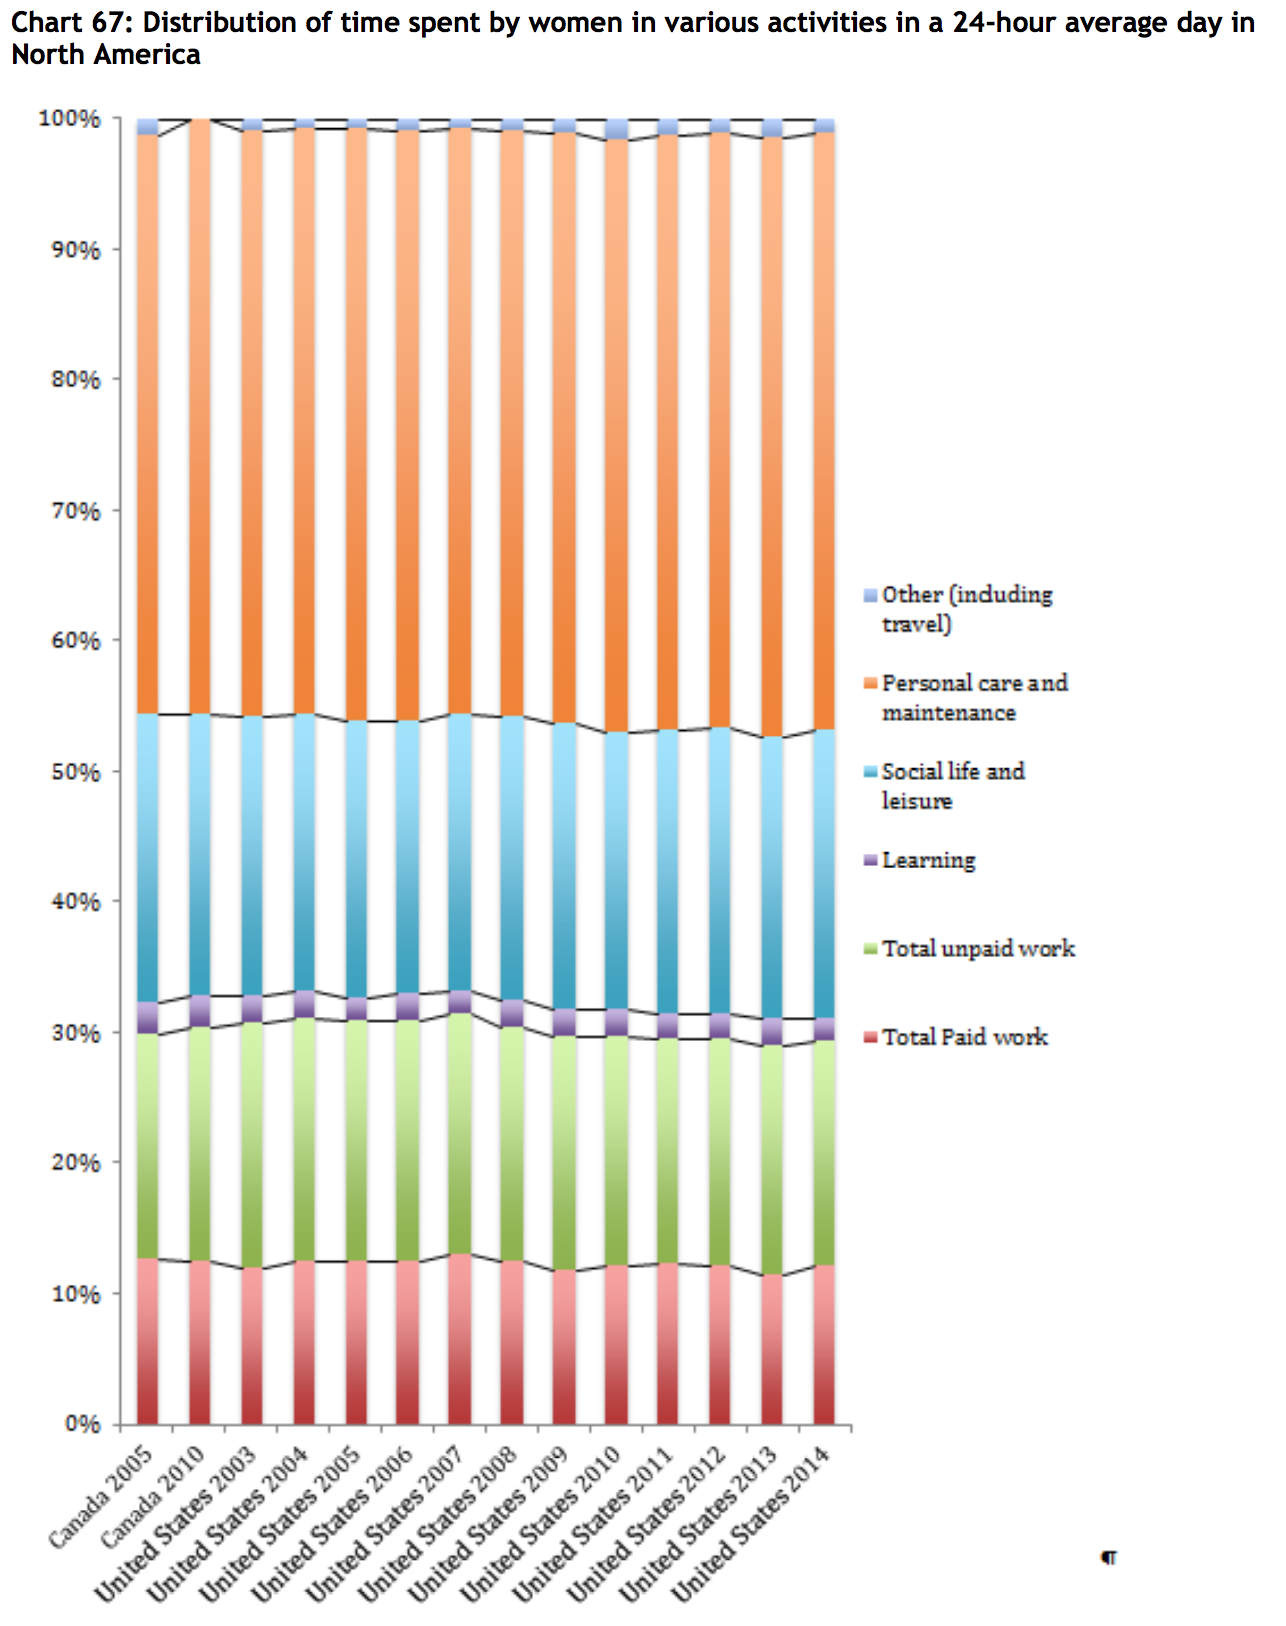
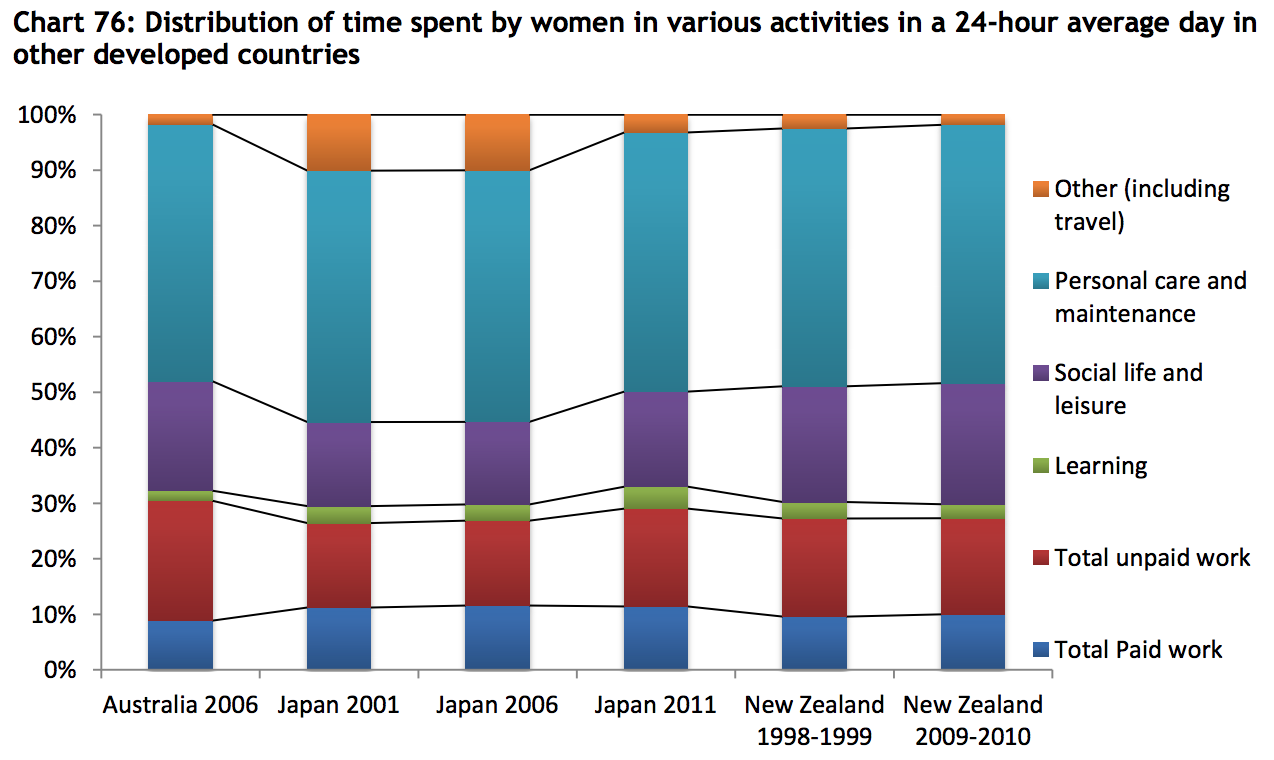
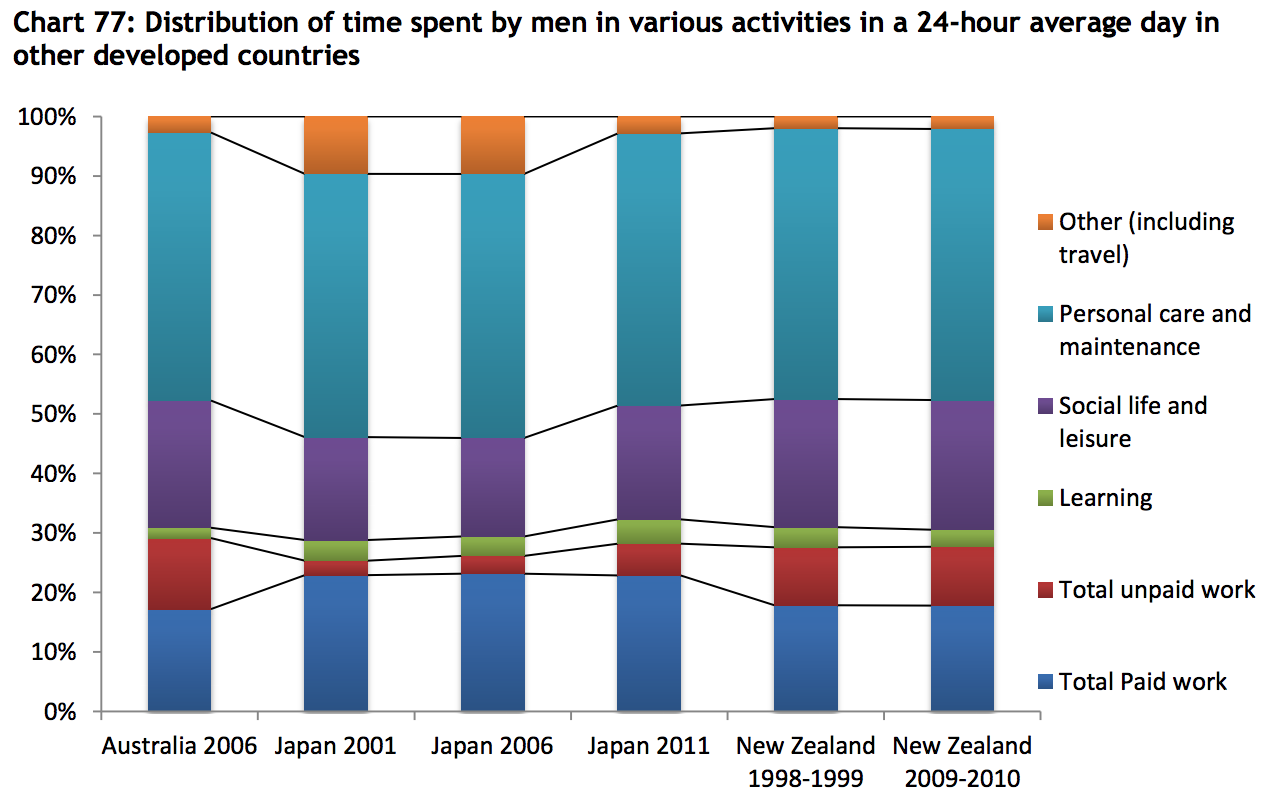
Paper is based on 102 time use surveys carried out in 65 countries. It gathers as many time use survey data and metadata as possible, and builds synthetic indicators on time use across the world, based on this data set. One of the main goals of the paper is to highlight time-use differences between men and women, particularly the inequities between paid work and unpaid work. To that end, most of the charts are divided by gender, with only a single chart showing gender-neutral time-use averages (that one chart is for the Mid East and Northern Africa region). In the case of Europe, the charts are further segmented by west, north, and southern Europe.
Survey data are aggregated into the following broad regions:
Middle East and North Africa (9 countries, 10 surveys)
sub-Saharan Africa (8 countries, 10 surveys)
Asia (9 countries, 13 surveys)
Latin America (7 countries, 8 surveys)
Europe (15 countries, 29 surveys)
Transition [Eastern European countries with Soviet history] (12 countries, 12 surveys)
North America (2 countries, 14 surveys)
Other developed countries (3 countries, 6 surveys)
The following chart shows which countries are included in those categories, and highlights which countries have conducted repeated surveys.
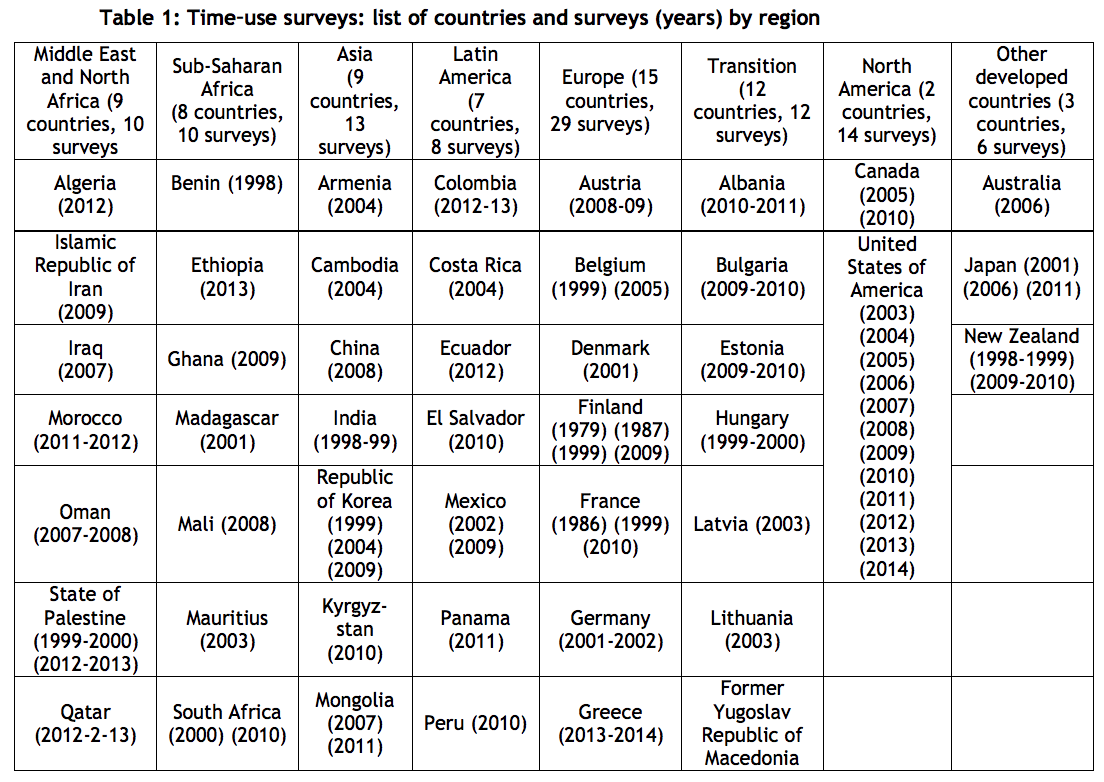
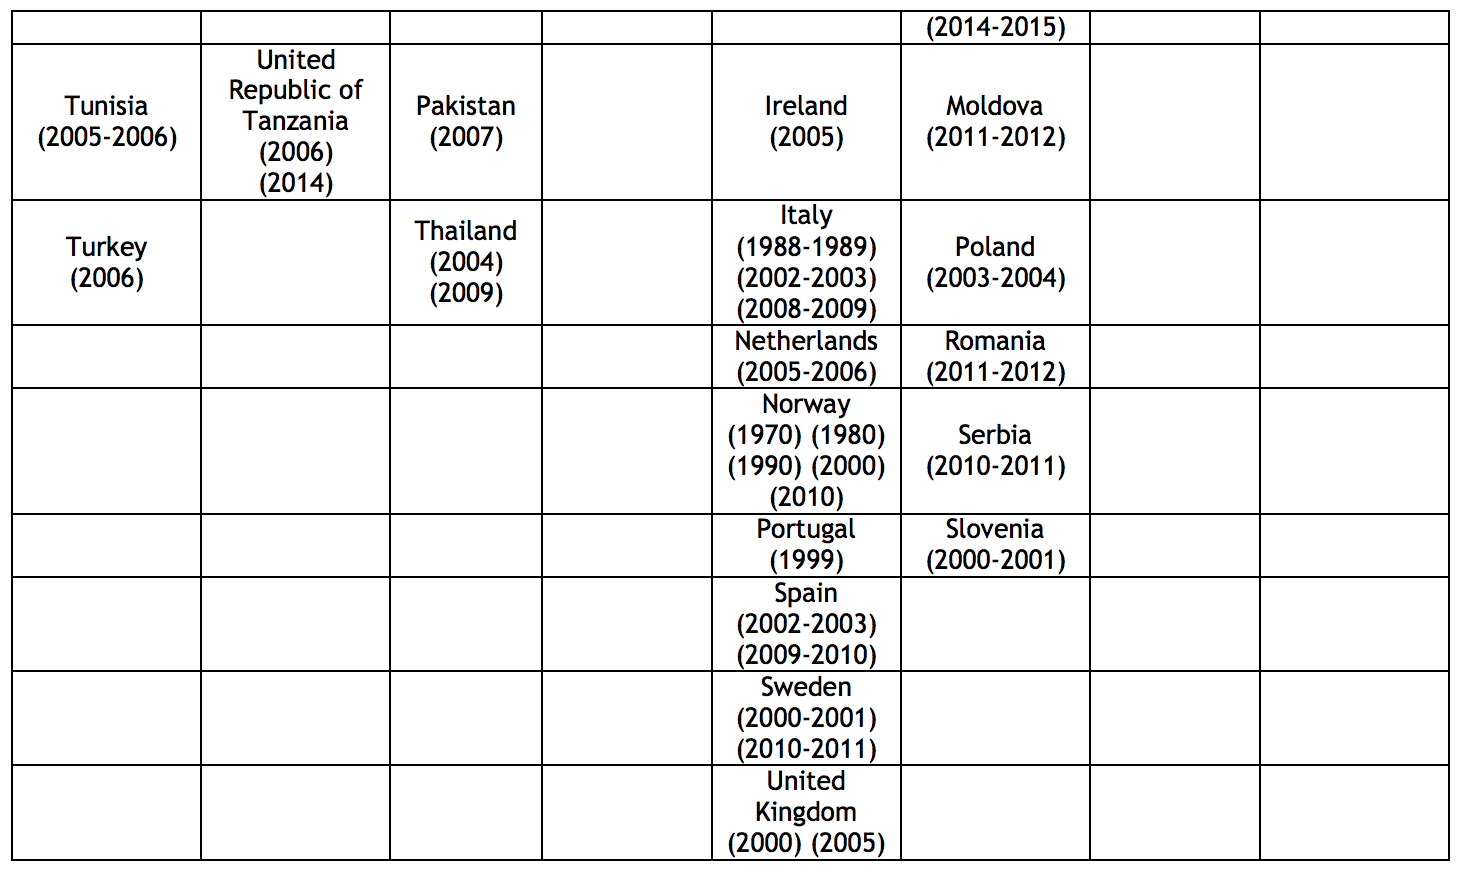
p.5,6
Here are the overall time-use charts from the report:
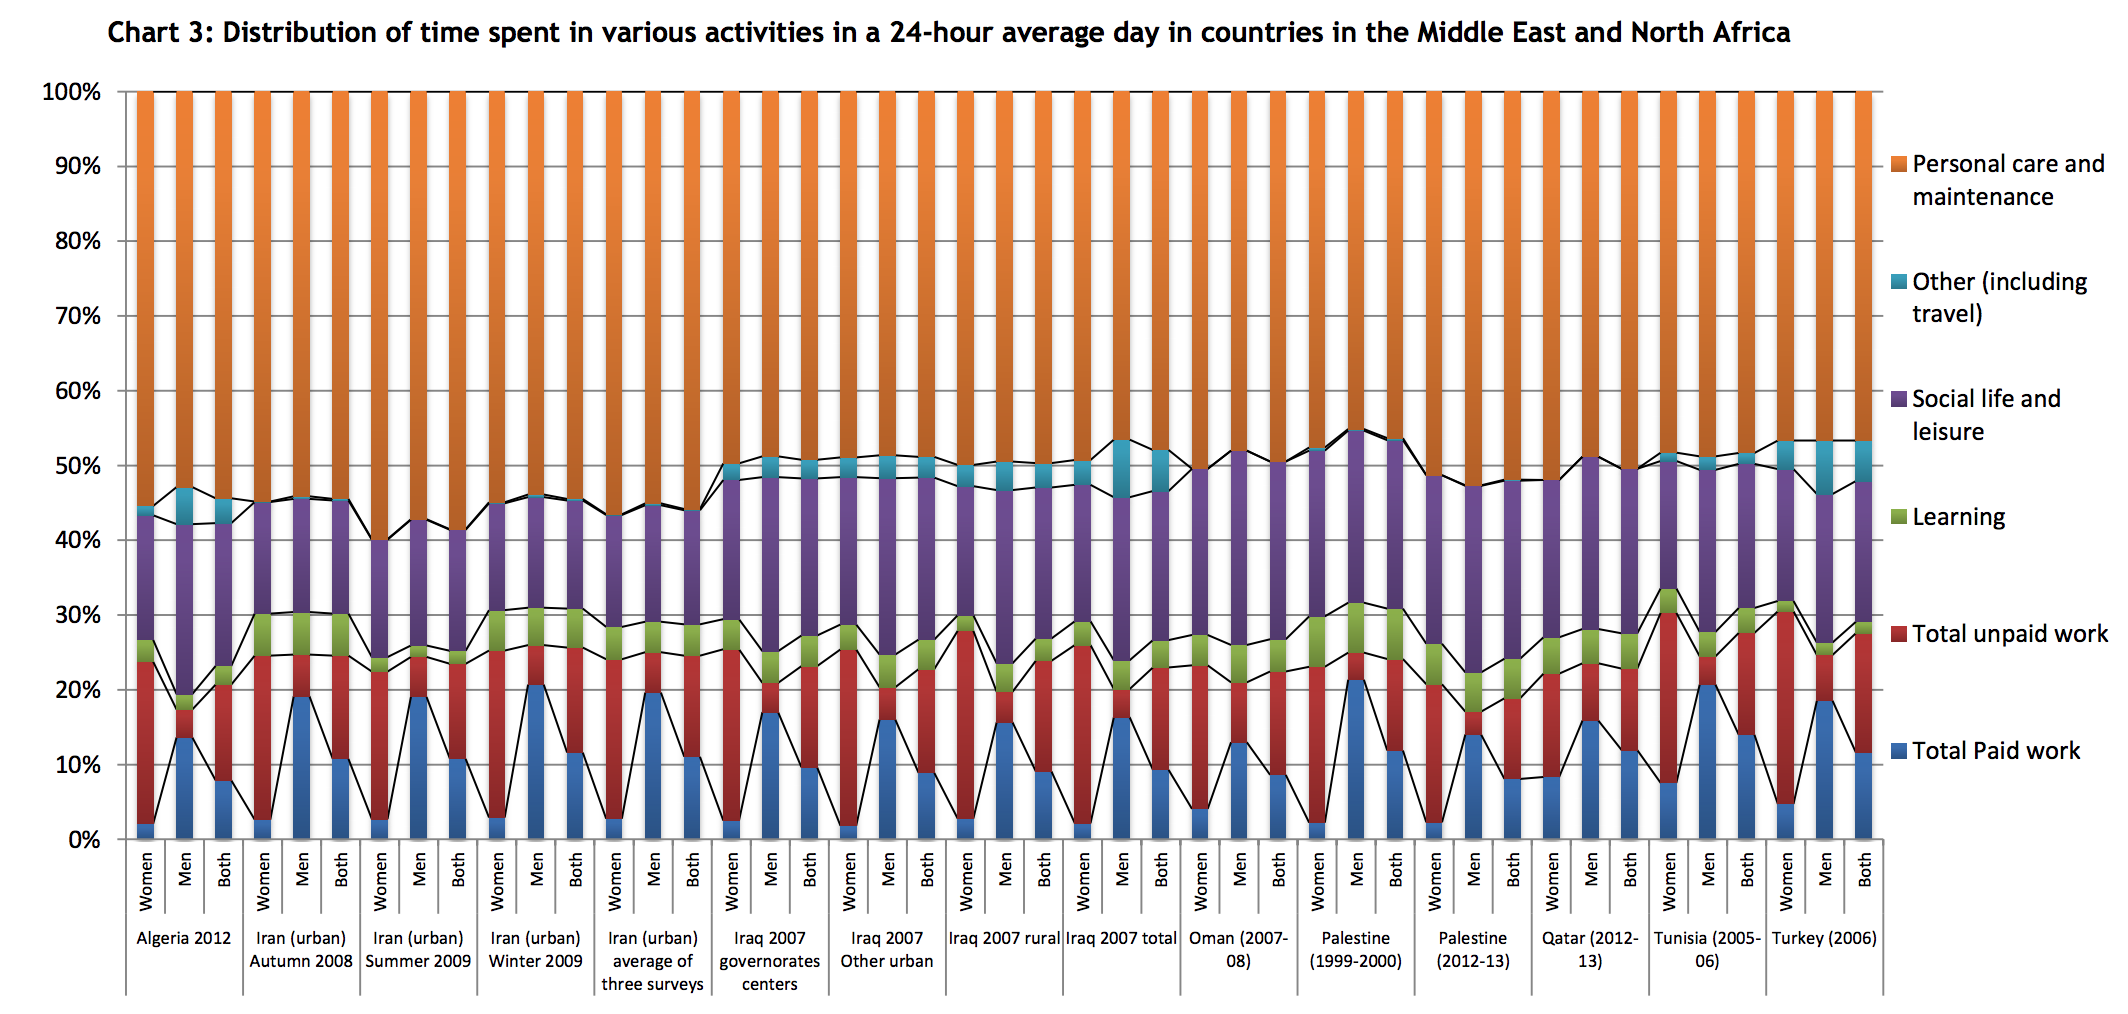
p.19

p.29

p.30
p.42
p.43
p.50
p.51
p.66
See the report for western and southern Europe segments. I’ve excerpted the northern Europe segment because it reflects a broad time series, with many repeated surveys in Finland and Norway.
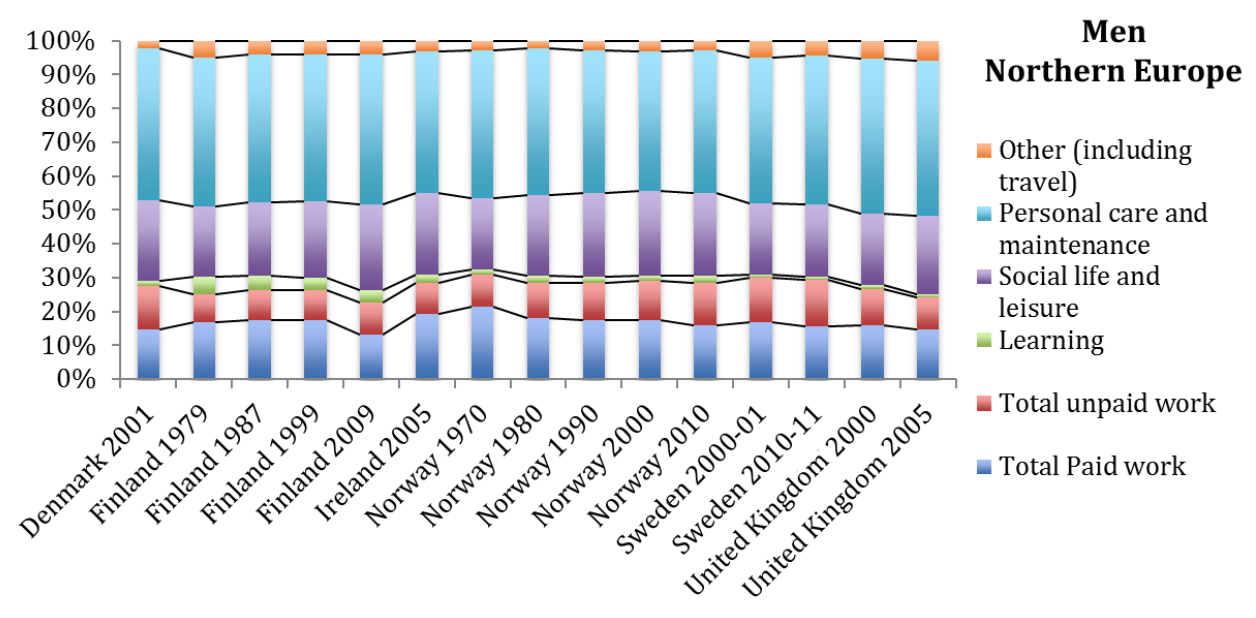
p.67
See the report for western and southern Europe segments.
p.73
p.73
p.78

p.79
p.84
p.84
***
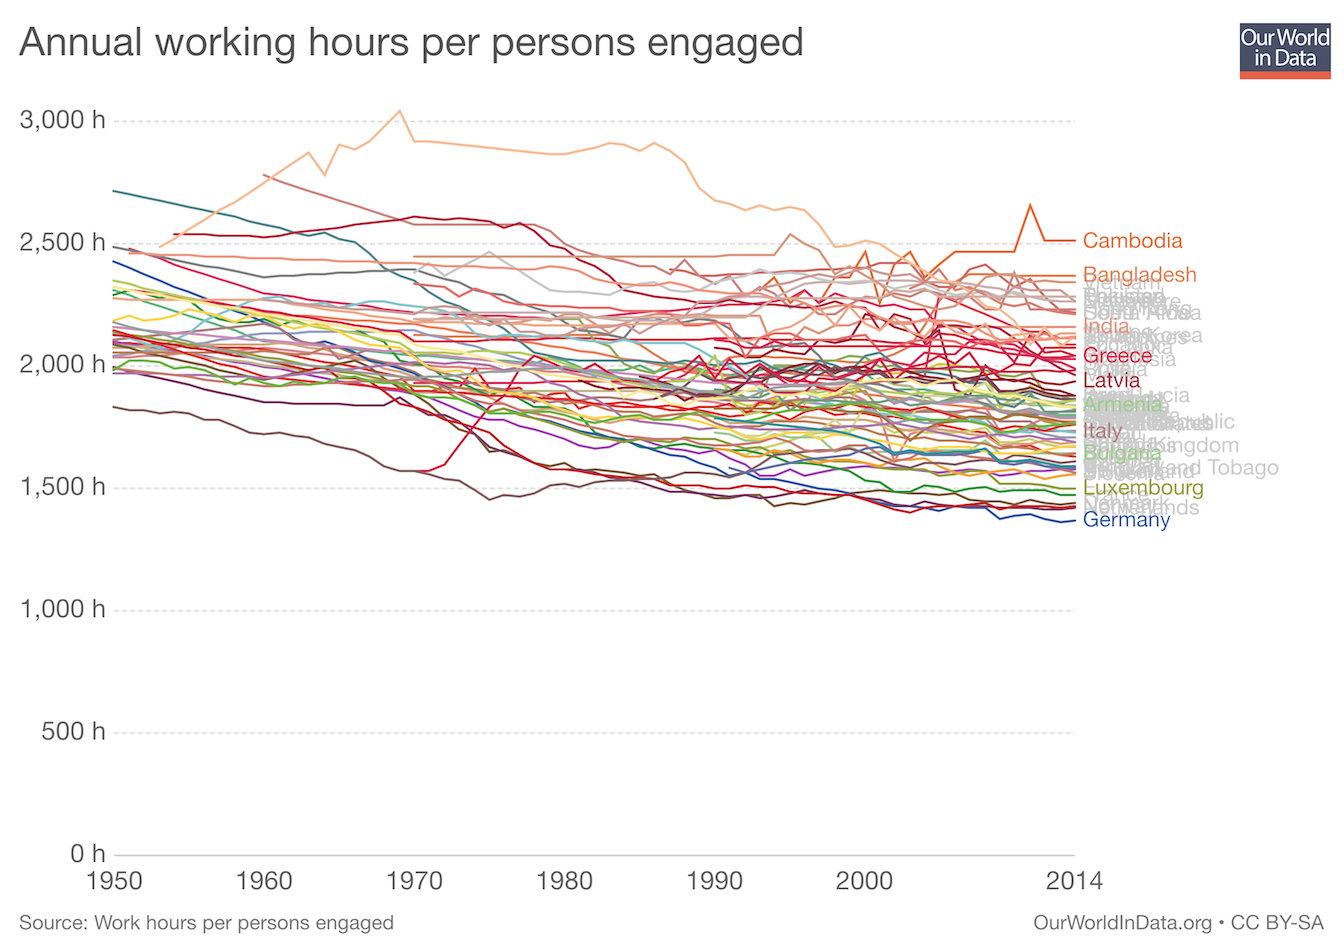
Annual Working Hours 1950-2014
worldwide
Reflects the trend of people in richer countries working less.
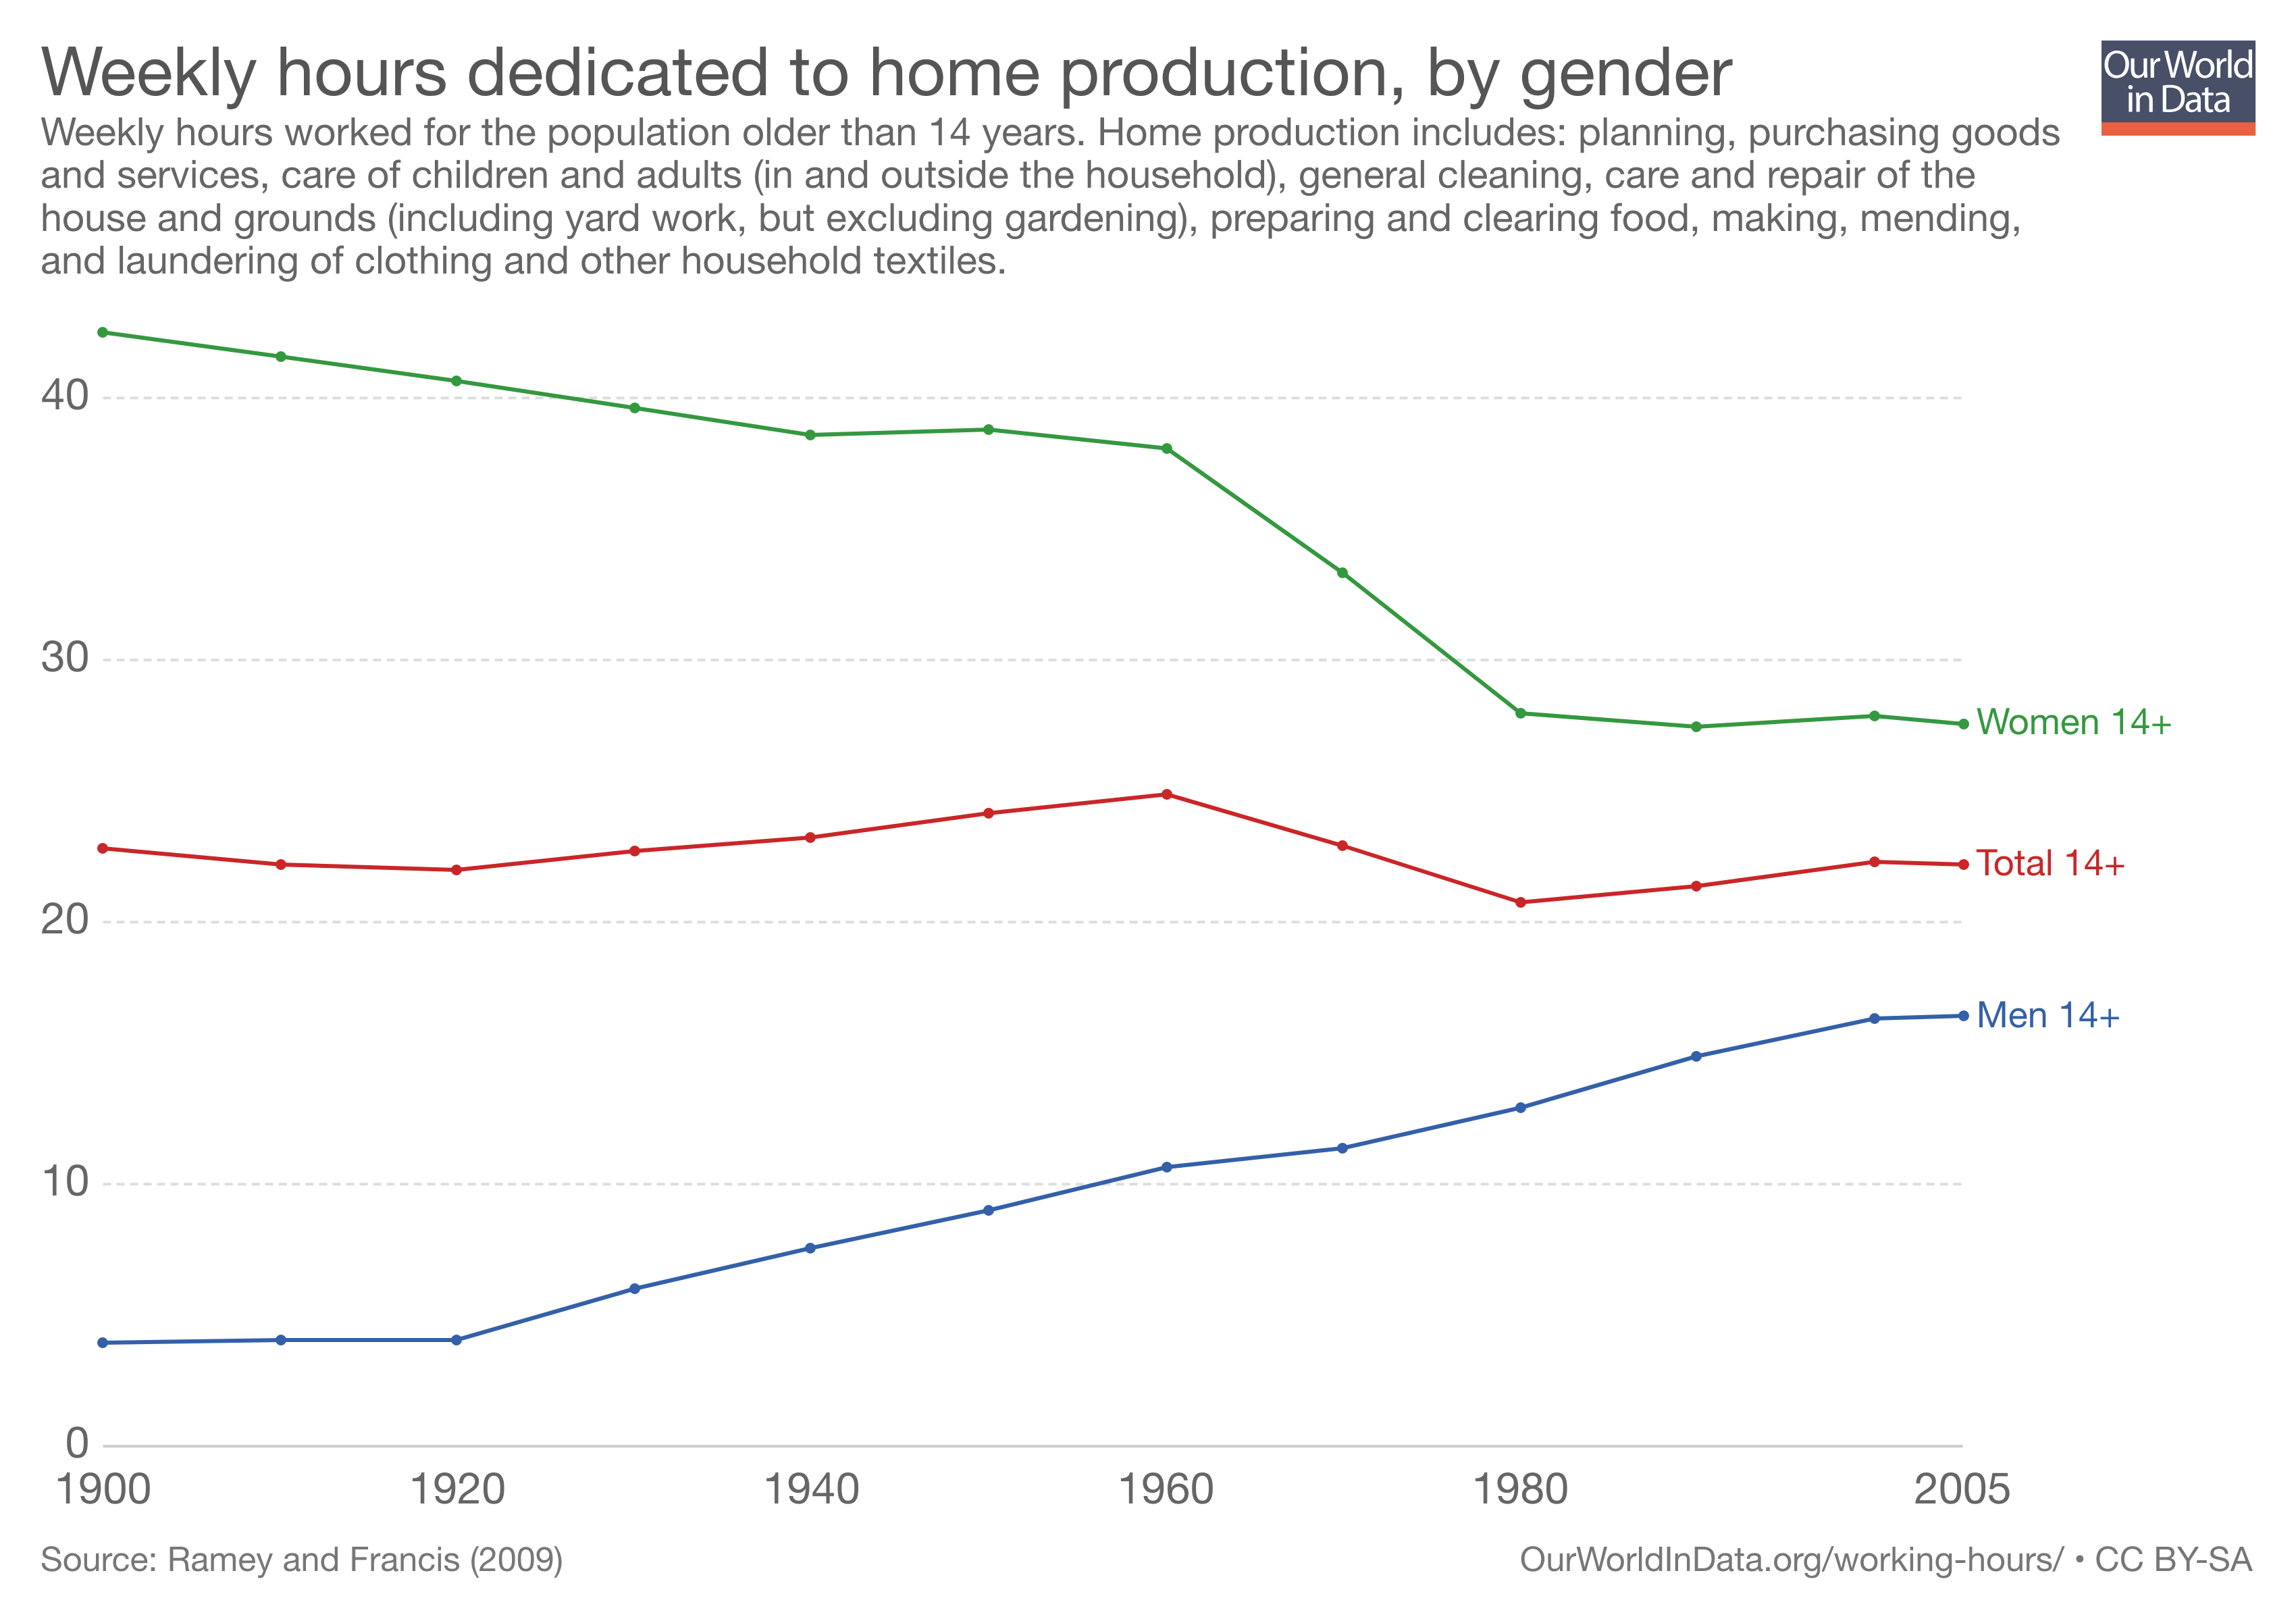
Working Hours in the Household 1900-2005
US
Marked decline for women and increase for men, across all age groups.
Includes planning, purchasing goods and services, care of children and adults, general cleaning, care and repair of the house and ground, preparing and clearing food, making, mending, and laundering clothing and other household textiles.
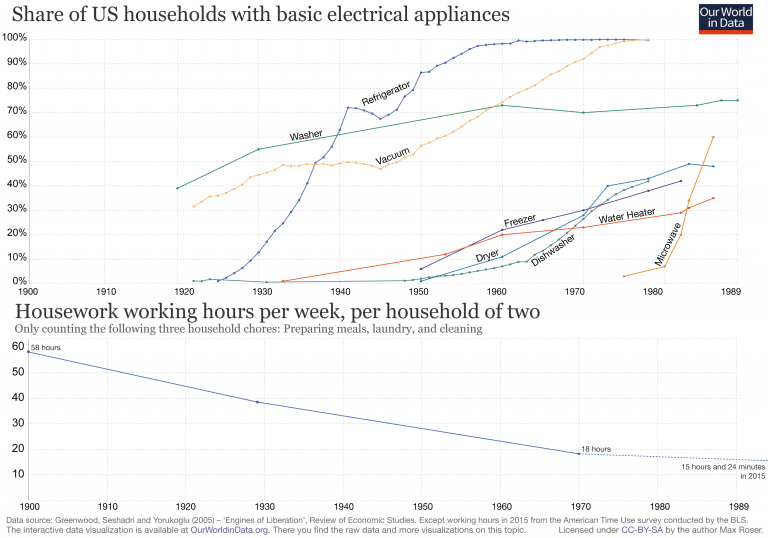
Hours per week on chores have decreased as electrical appliances have proliferated 1900-1989
US
Comparing share of households with basic electrical appliances to hours spent preparing meals, doing laundry and cleaning.
src:
Max Roser, 2018
“Working Hours” – Our World In Data
Social Media Users
Hootsuite and We Are Social publish an annual report detailing internet use and social media growth. In their 2018 report, they list the most active social platforms (slide 59), led by Facebook (2,167B MAUs), with WeChat at #5 (980M MAUs). Because Facebook is still not used in China (not broadly), we have added the Facebook and WeChat user figures to roughly approximate the number of people using social media. At 3.147B, this comes very close to the report’s estimate of active social media users (3.196B).
src:
We Are Social/Hootsuite, Jan 2018
“2018 Global Digital”
full set of slides
I tallied historic MAU data from Facebook (Q3 2008 – Q4 2017) and WeChat (Q2 2011 – Q2 2017)
src:
Facebook via Statista, Jan 2018
“Number of monthly active Facebook users worldwide as of 4th quarter 2017 (in millions)”
src:
Tencent via Statista, Aug 2017
“Number of monthly active WeChat users from 2nd quarter 2010 to 2nd quarter 2017 (in millions)”
I calculated this tally as a percentage of global population, to be compared against the percent of global internet users (reported by the Internet Telecommunications Union).
global population src:
United Nations, Department of Economic and Social Affairs, Population Division. World Population Prospects: The 2017 Revision. (Medium-fertility variant).
via Worldometers
I used Excel to create trend lines (2deg polynomial) showing when each set (internet users and social media users) might reach 100% saturation.
The data are collected in the following Excel file:
global-internet-users-ITU-2001-2017-extrap-to-2030
And a simplified Google Drawing is here:
https://docs.google.com/drawings/d/1qbYyLORAMPYAtwZkrZxN0-VTfjUpPLoZL-SV-z-IB9E/edit?usp=sharing
Other bits of interest:
Dragon Social, Oct 2017
“10 Most Popular Social Media Sites in China”
eMarketer, June 2017
“Percent of Internet users who use a social network at least 1x/month”
2016-2021
Business Insider, Sep 2016
“Messaging apps are now bigger than social networks”
[crossing chart]
2011-2017
Size of Homes, Global
Ask
What’s the size of average homes around the world?
Results
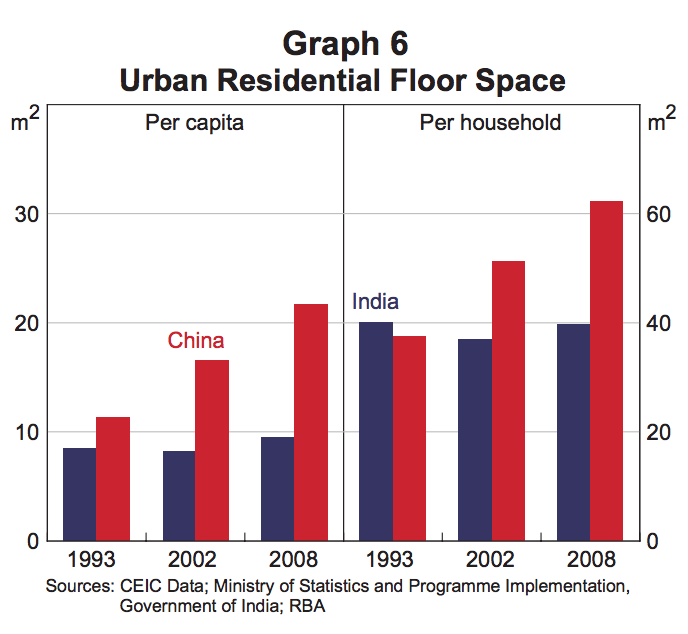
China & India Urban Residential Floor Space in 1993, 2002, 2008
Excerpt:
Average income growth has been a key reason behind these different trends in the quality of the housing stock. The urbanisation process in China has transferred large numbers of workers from relatively low productivity jobs in the rural sector to higher productivity jobs in urban areas. This movement has been a driver of the rapid growth in incomes in China over the past three decades, which has far exceeded the growth in incomes in India (Graph 7). Over time, Chinese households have chosen to spend their higher income on higher quality dwellings and dwellings with larger floor space and, as a consequence, the share of concrete dwellings and residential floor space per capita has increased.
src:
Reserve Bank of Australia, March 2014
“Housing Trends in China and India”
p.66
*
Europe Compared with US Home Sizes, 1950, 1984, 2005, 2015
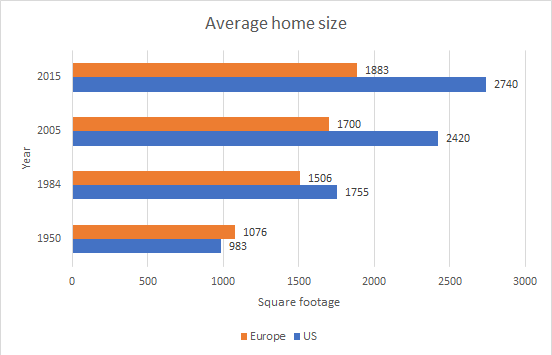
Note: This graphic is a very rough assembly of data reported in mass media publications (not well-cited).
src:
Reddit user chyken
“Comparing average house size in US to Europe, 1950-2015 [OC]”
citing US Census, Elle Decor, Apartment Therapy, Not Buying Anything
*
Europe Home Sizes (all vs. newly built)
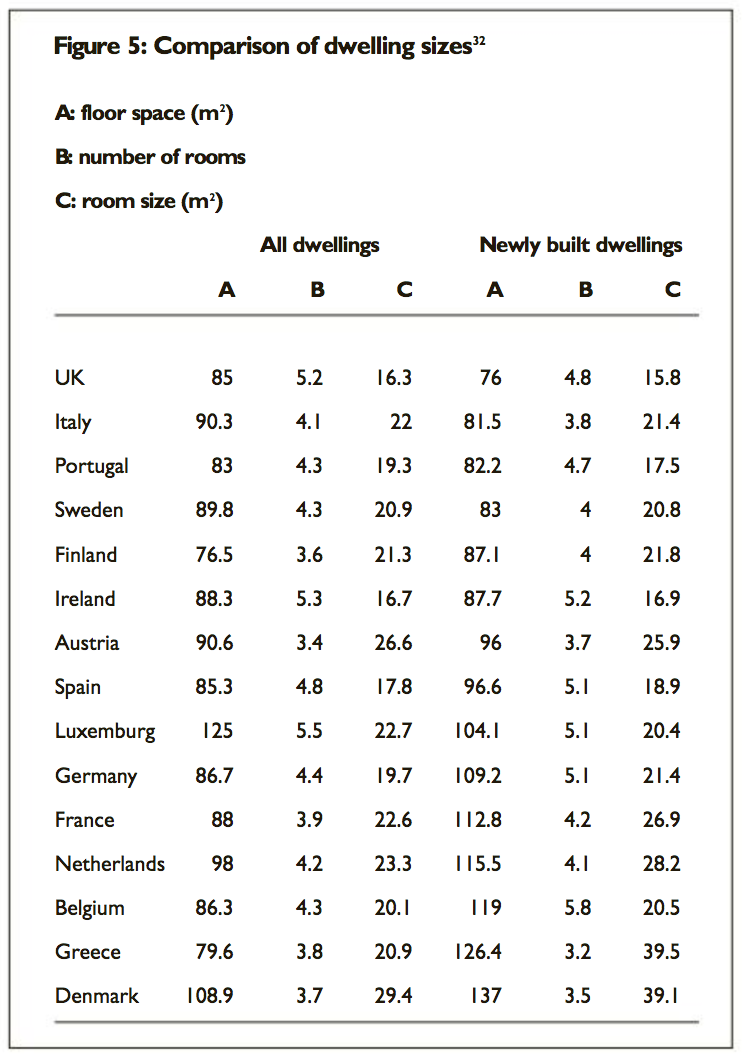
src:
Evans & Hartwich, 2005
“Unaffordable housing: Fables and myths”
p. 41
*
Europe, Australia, Canada, US, Japan (single year)
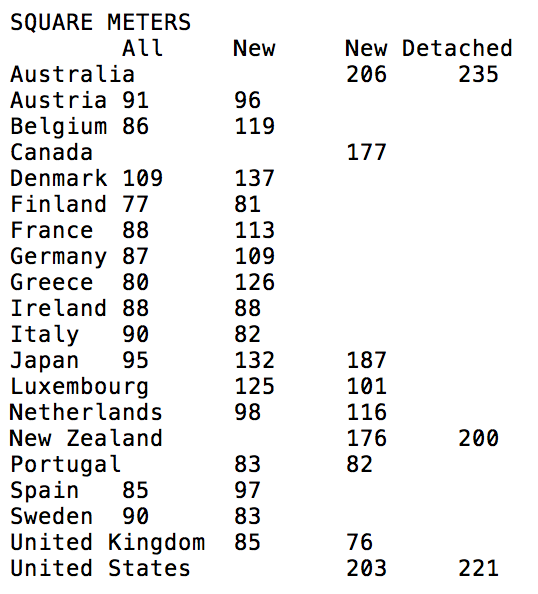
src:
Demographia (Wendell Cox), 2006 (data via IA)
“International House Sizes”
citing Japan Statistical Yearbook, European Housing 2002, Australian Bureau of Statistics, Canadian Home Builders Association, Infometrics.
*
Home Sizes: Select Europe, US, Canada, China, Australia, Japan (single year)
Note: Lots of overlap with Demographia set, above, but some additional countries
src:
Shrink That Footprint, 2013 (date via IA)
“How big is a house? Average house size by country”
Global Mall Development Trends
Ask
Update on mall building rates? US? Globally? Developing world?
Trends in mall development
Results
Global Mall Construction Rates
In 2016, global shopping center completions were up 11.4% over 2015 levels, despite having slowed over the past few years.
However, the pace of development continues to slow, with the number of shopping centers under construction down 22%
The majority of added shopping center space came to market in Asia, but The Americas registered the strongest growth, with completion levels up 43.6%, fueled by construction growth in Mexico.
Src:
CBRE via Malls.com, May 2017
*
In 2016:
17% of retailers planned to open more than 40 stores
67% planned to open no more than 20
Most popular formats for expansion
76% street shops
72% regional shopping malls
45% open air shopping malls
20% transport hubs (airport, railway terminals)
18% outlets
18% retail park
15% concession counters in department stores
8% duty free
src:
CBRE Research, April 2016
“How Active Are Retailers Globally?”
*
Global shopping centre completions started to slow (in 2015) as parts of the global retail market witness the effects of an imbalance between significant supply and demand.
Despite this, there continues to be exceptional levels of construction, particularly in Asia. Globally, 10.7 million sq m of new space opened in 2015 in the 168 cities we surveyed; this is down on 2014, where 12.1 million sq m of space were completed; and a further 41.9 million sq m is under construction, up from 39 million in 2014.
src:
CBRE, April 2016
Global Retail ViewPoint – Shopping Centre Development April 2016
[full report here]
Discussion of the above CBRE report is available here.
*
Global Retail Development Index
Shows where retail investment has been most attractive (ranks top 30 countries). These are the top 10 countries in 2017
India 71.7
growing middle class, rapidly increasing consumer spending, overtakes China
China 70.4
market is maturing, still leading in e-commerce
Malaysia 60.9
good long-term prospects bc of tourists, higher disposable income, govt investments
Turkey 59.8
moved up two places
United Arab Emirates 59.4
most attractive market in the region
Vietnam 56.1
moves ahead, important market for retail expansion with its liberalized investment laws
Morocco 56.1
continues to rise in rankings, govt efforts to attract foreign investment
Indonesia 55.9
continued liberalization and infrastructure investments
Peru 54
outperforms other regional economies, two decades of solid growth
Colombia 53.6
despite lower than expected GDP growth, still attractive for retailers
src:
ATKearney, 2017
The 2017 Global Retail Development Index™
CC’s note: These rankings are available back to 2004. Could aggregate, if this were of interest to KK. (Started to aggregate a couple years’ of data, but stopped bc I wasn’t sure if it was of interest.)
Relig-Shop-Dev-Homes-Extrapolations.xlsx
GRDI tab
European Mall Construction Rates
In 2016, European shopping center construction was down 6% overall compared with 2015. Western Europe saw an increase of 15% in new shopping center completions, but this was outweighed by a 17% decline in the UK, as well as a 17% decline in Central and Eastern Europe (which also dropped 11% in 2015). Further declines are expected in 2017.
src:
Cushman & Wakefield, May 2017
“European Shopping Centers: The Development Story”
[full report behind paywall]
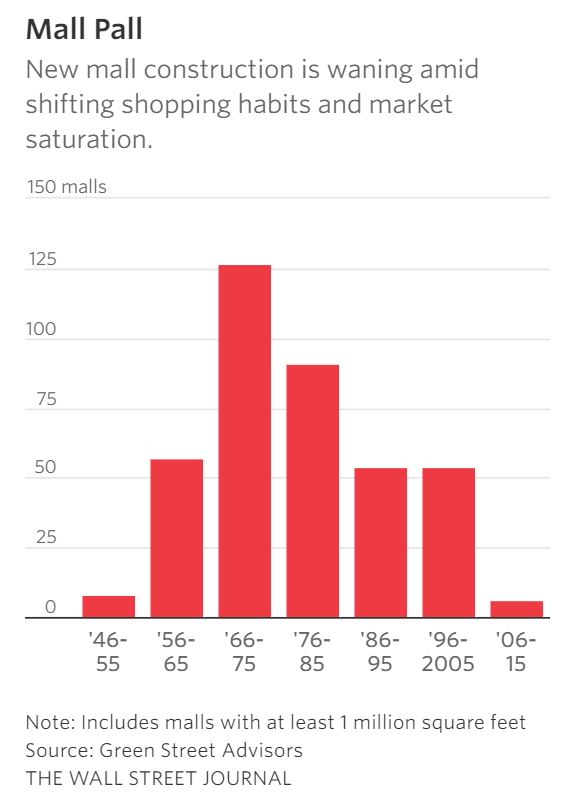
US Mall Construction Rates
U.S. mall development peaked in the 1970s and has steadily declined. Just six large malls were built between 2006 and 2015, compared with 54 during the previous decade, according to Green Street.
src:
Wall Street Journal, Oct 2017
“Big Mall Operator Does the Unthinkable—Builds a Mall”
paywall, these excerpts via Zerohedge
“With Malls In Full Meltdown Mode, GGP Goes All-In With $525MM Connecticut Mega-Mall”
*
Retail Availability Rates, US, 2016
2005 7.4%
2006 8.1%
2007 9.0%
2008 10.8%
2009 12.6%
2010 12.9%
2011 12.9%
2012 12.5%
2013 11.7%
2014 11.0%
2015 10.7%
2016 10.2%
2017p 10.1%
2018p 10.0%
2019p 10.1%
Excerpts:
The oft-reported demise of the retail sector was another topic tackled by the panelists. But they were not ready to sign on to the prevailing attitude that retail is in steep decline. “Store growth continues on a net basis,” Ludgin said.
The forecast found economists equally optimistic about the retail sector. Vacancy rates (see above) are expected to hold steady at about 10 percent for the next two years, while rental rate growth will decline from 2.7 percent to 2.0 percent in 2018—still above historic averages, the economists predict.
Though the panelists agreed that many elements of the retail sector will continue to struggle—in particular, certain suburban malls—others will see an uptick, especially as the link grows between retail and distribution space. Retail space can play a key role in solving the “last mile” issue.
“The store is just a way to deliver goods to people,” Ludgin said. “You may not need the same square footage, but the store is not dead. . . . It’s performing a somewhat different function than in the past.”
Retail space linked to services and entertainment space is still performing well, Conway said. “What we’re not seeing is addition of shop space,” he said. Suburban malls will have to deal with obsolete space, but many retail spaces will evolve, as we “see the convergence of retail and industrial into one,” he said.
Many online retailers, including Amazon, are starting to invest in brick-and-mortar space, Ludgin noted. And discount department stores “remain extremely viable and are still opening stores,” including chains like T.J. Maxx and Nordstrom Rack, which offer a value proposition. “As a nation, we still like department stores, and we still shop in them. It’s just that they are less in regional malls and more in open-air centers,” Ludgin said.
Centers focused on local interests and artisan wares are also performing well, Reagen added. “There is a huge shift in people wanting something different,” she said. “These are centers that will remain viable.”
SRC:
Urbal Land Institute, citing CBRE, April 2017
“ULI Forecast Calls for Moderate Growth for Most U.S. Real Estate Sectors”
*
2015 Summary from research firm CBRE:
Across major U.S. metropolitan areas, completions of new shopping centre space increased in 2015 and the pipeline of new projects grew. In 2015, 13 significant centres were delivered in the cohort of major metropolitan areas, compared to only six in 2014. Lifestyle centres comprised the majority of deliveries, both in terms of the number of centres and their area; the largest of these was the Village at Westfield Topanga (54,812 sq m) in the San Fernando Valley of Los Angeles. The greatest numbers of new shopping centres were delivered in Texas, with three in Houston and two in Fort Worth. [p.6]…
Within the U.S. there are now 15 major projects under construction up from nine in 2014. The most activity remains concentrated in the New York City metropolitan area, fuelled by the massive American Dream at Meadowlands, which is being developed by the owners of the largest mall in the United States – Mall of the Americas in Minnesota; the centre includes an indoor ski slope, among other attractions. Other projects in the city are smaller, but have a very high profile: The World Trade Center shopping centre in downtown Manhattan, operated by Westfield, and The Shops and Restaurants at the Hudson Yards, a huge new mixed use project developed by Related and Oxford on the West side of Manhattan, and City Point, a mixed use development in downtown Brooklyn (Acadia). Houston has four significant projects under construction, totalling 143,943 sq m. The 15 shopping centres under construction are broadly diversified among new lifestyle centres, super-regional and regional malls and power centres. Generally centres in the U.S. are opening with upwards of 90% occupancy rates. [p.10]
src:
CBRE, Q2 2016
“Global Shopping Centre pipeline rises while overall completion levels start to slow”
*
US Shopping Center Rates of Growth, 2013-2017

src:
CC’s calculation of growth based on ICSC data. See OF-charts.xls, “Shopping-Centers” tab.
2017 data:
ICSC, Jan 2017
“U.S. Shopping-Center Classification and Characteristics”
2016 data: 2016 Internet Archive version of above
2015 data: 2015 Internet Archive version
2014 data: 2014 IA version
2013 data: ICSC, 2014 Economic Impact of Shopping Centers
2012 data: ICSC, 2013 Economic Impact of Shopping Centers
Definitions
GLA: gross leasable area
square footage and industry share data below refer to January 2017
Super-Regional Mall
Similar in concept to regional malls, but offering more variety and assortment.
Avg size: 1,255,382 sq ft
% Share of Industry GLA: 10.2%
Regional Mall
General merchandise or fashion-oriented offerings. Typically, enclosed with inward-facing stores connected by a common walkway. Parking surrounds the outside perimeter.
Avg size: 589,659 sq ft
% Share of Industry GLA: 4.7% (Jan 2017)
Community Center (“Large Neighborhood Center”)
General merchandise or convenience- oriented offerings. Wider range of apparel and other soft goods offerings than neighborhood centers. The center is usually configured in a straight line as a strip, or may be laid out in an L or U shape, depending on the site and design.
Avg size: 197,509 sq ft
% Share of Industry GLA: 25.4%
Neighborhood Center
Convenience oriented.
Avg size: 71,827 sq ft
% Share of Industry GLA: 30.8%
Strip/Convenience
Attached row of stores or service outlets managed as a coherent retail entity, with on-site parking usually located in front of the stores. Open canopies may connect the store fronts, but a strip center does not have enclosed walkways linking the stores. A strip center may be configured in a straight line, or have an “L” or “U” shape. A convenience center is among the smallest of the centers, whose tenants provide a narrow mix of goods and personal services to a very limited trade area.
Avg size: 13,218 sq ft
% Share of Industry GLA: 12.0%
Power Center
Category-dominant anchors, including discount department stores, off-price stores, wholesale clubs, with only a few small tenants.
Avg size: 438,626 sq ft
% Share of Industry GLA: 13.0%
Lifestyle
Upscale national-chain specialty stores with dining and entertainment in an outdoor setting.
Avg size: 335,852 sq ft
% Share of Industry GLA: 2.2%
Factory Outlet
Manufacturers’ and retailers’ outlet stores selling brandname goods at a discount.
Avg size: 238,060 sq ft
% Share of Industry GLA: 1.2%
Theme/Festival
Leisure, tourist, retail and service-oriented offerings with entertainment as a unifying theme. Often located in urban areas, they may be adapted from older–sometimes historic–buildings and can be part of a mixed-use project.
Avg size: 147,791 sq ft
% Share of Industry GLA: 0.3%
Airport Retail
Consolidation of retail stores located within a commercial
airport
Avg size: 249,240
% Share of Industry GLA: 0.2%
src:
ICSC (International Council of Shopping Centers), January 2017
“U.S. Shopping-Center Classification and Characteristics”
***
Trends in Chinese Mall Offerings
Wall Street Journal, Jan 2017
“China Has Too Many Shopping Malls”
CC’s summary:
In 2015, 3.7 million square meters of shopping space was under construction in Chongqing — more than anywhere else in the world (and 10x the retail construction in New York). It’s also a much greater shopping stock than what’s found in China’s four first-tier cities (eg: Beijing, Shanghai) — more than 2 square meters per urban consumer, compared with 0.5sq.m in the first-tier cities. This is a problem because new demand has not been as strong as anticipated (as shoppers leapfrog stores and go directly online). The retail vacancy rate has been rising in many Chinese cities. Some department stores are reporting sharp losses, with some closing in the past year. Some retail developers are including entertainment (hotels, aquariums, sports hubs with rock-climbing, ziplines, indoor surfing, ski slopes) as well as shopping in hopes of staying ahead.
*
Financial Times, November 2017
“China’s high street finds growth alongside ecommerce”
Excerpts:
[Chinese] ]Mall operators have responded to the ecommerce onslaught by reducing space devoted to retail and increasing allocations for restaurants, cinemas and outlets offering extracurricular classes for children. Electronics retailers have added in-store experiences and reallocated floorspace for ecommerce distribution.
In 2016, Shanghai’s Joy City mall installed a gigantic Ferris wheel on its top floor to attract customers.
Gome, an electronics store which is Chinas second largest brick-and-mortar retailer by sales, has added experience-enhancing elements in stores, such as virtual reality zones. It’s offline sales grew 10.5% in the first half of the year.
*
KK: HERE IS A BIG RESEARCH REPORT ON WHAT’S NEW IN CHINESE RETAIL. YOU MIGHT LIKE TO SKIM. THINGS THAT CAUGHT MY EYE:
“NEW RETAIL”
buzz phrase in China’s retail sector, refers to retailers with large physical stores reinventing and transforming their business models and formats. Leveraging Internet, VR, AR etc to offer experience- and lifestyle-driven opportunities.
“CEWEBRITY ECONOMY”
Cewebrities are people who become famous on the Internet. Leveraging the power of their fans and social media, many cewebrities, especially fashion cewebrities, have set up online stores to sell fashion items. Some have even launched their own brands.
RURAL E-COMMERCE
The rural online retail market has become a new growth engine with the near saturation of the urban online market. Rural consumers prefer shopping online because of the less developed retail infrastructure in rural areas. … Recognizing the ample growth potential of the rural e-commerce market, increasing numbers of leading retailers and e-commerce players have adopted various “going rural” strategies. For instance, Alibaba has introduced a partnership program in rural areas. Some 20,000 partners were recruited to teach and help rural residents buy online. At the same time, JD.com has made substantial investment in rural areas to expand “last-mile” delivery capabilities; for example, it has tested drone delivery services in some remote rural areas
src:
Fung Business Intelligence, March 2017
“Spotlight on China Retail”
Pharmaceutical Sales Through 2020
EvaluatePharma (life science market research firm) releases an annual report of current pharmaceutical sales figures with forecasts looking 5 years out.
According to the 2015 report, Novartis was the number one pharmaceutical company in 2014 and is forecast to maintain its position in 2020
Other indicators reported:
worldwide prescription drug sales (2006-2020)
regional prescription drug sales
Top 20 Companies by Rx sales in 2020
worldwide R&D spending by company
worldwide Rx drug & OTC sales by therapy area in 2020
Src: “World Preview 2015, Outlook to 2020.” 2015. Evaluate.
They also track sales volume and pricing including cost and volume per patient for the U.S. and other regions. Not available in the free report – contact them.
Media Contacts:
Evaluate and EP Vantage (for general questions)
Christine Lindgren
+1 617-866-3906
christine.lindgren@evaluategroup.com
Chempetitive Group (for U.S. media)
Rachel Wallace
+1 781-775-3640
rwallace@chempetitive.com
