

work
Occupations
Summary
This collection of data includes the following indicators, dates, and sources:
unemployment rate, 2010-2060, OECD
white collar jobs growth, 1900-2000, AFL-CIO
occupations with most job growth (by number and percent), 2014/2024, BLS
occupations with the largest job declines (by number and percent), 2014/2024, BLS
In addition to these datasets, I’ve noted a couple jobs projections by futurist Thomas Frey, and a study estimating the impacts of future technology on jobs in the next couple decades.
Findings
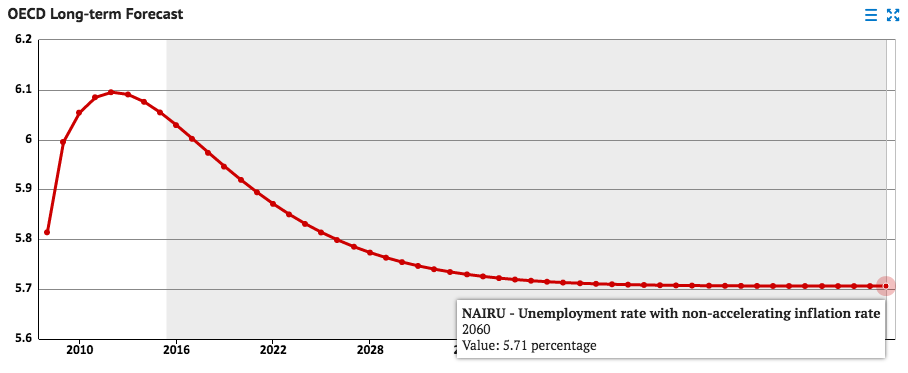
Unemployment Rate
Src:
Knoema
Citing:
OECD. May 2014.
OECD Long Term Baseline
[data below]
*
NAIRU unemployment rate with non-accelerating inflation rate, 2010-2060
Src:
OECD. May 2014.
“Economic Outlook No 95: Long-term baseline projections”
Variable: NAIRU unemployment rate with non-accelerating inflation rate
Country: United States
***
White Collar Jobs Growth
White collar occupations as a percent of total US Workforce
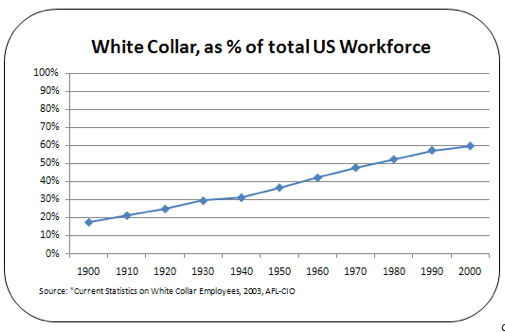
Src:
Marc Cenedella. January 2010.
“Great News! We’ve Become A White-Collar Nation.”
Business Insider.
Citing:
AFL-CIO. 2003.
“Current Statistics on White Collar Employees.”
***
Fastest Growing and Declining Occupations
Table 1.4 Occupations with the most job growth (raw numbers), 2014 and projected 2024
(Numbers in thousands)
Src:
Bureau of Labor Statistics. April 2016.
“Table 1.4 Occupations with the most job growth, 2014 and projected 2024
(Numbers in thousands).”
Employment Projections.
Table 1.4 Occupations with the most job growth (percent increase), 2014 and projected 2024
(Numbers in thousands)
Src:
Bureau of Labor Statistics. April 2016.
“Table 1.4 Occupations with the most job growth, 2014 and projected 2024
(Numbers in thousands).”
Employment Projections.
Table 1.6 Occupations with the largest job declines (raw numbers), 2014 and projected 2024
(Numbers in thousands)
Src:
Bureau of Labor Statistics. April 2016.
“Table 1.6 Occupations with the largest job declines, 2014 and projected 2024”
(Numbers in thousands).
Employment Projections.
Table 1.5 Fastest declining occupations, 2014 and projected 2024
(Numbers in thousands)
Src:
Bureau of Labor Statistics. April 2016.
“Table 1.5 Fastest declining occupations (percent), 2014 and projected 2024
(Numbers in thousands).”
Employment Projections.
***
General Predictions
“162 Future Jobs: Preparing for Jobs that Don’t Yet Exist.”
Thomas Frey. March 2014.
*
“101 Endangered Jobs by 2030.”
Thomas Frey. November 2014.
*
“The Future Of Employment: How Susceptible Are Jobs To Computerisation?”
Carl Benedikt Frey and Michael A. Osborne. September 2013.
Oxford University.
Abstract:
We examine how susceptible jobs are to computerisation. To assess this, we begin by implementing a novel methodology to estimate the probability of computerisation for 702 detailed occupations, using a Gaussian process classifier. Based on these estimates, we examine expected impacts of future computerisation on US labour market outcomes, with the primary objective of analysing the number of jobs at risk and the relationship between an occupation’s probability of computerisation, wages and educational attainment. According to our estimates, about 47 percent of total US employment is at risk. We further provide evidence that wages and educational attainment exhibit a strong negative relationship with an occupation’s probability of computerisation.
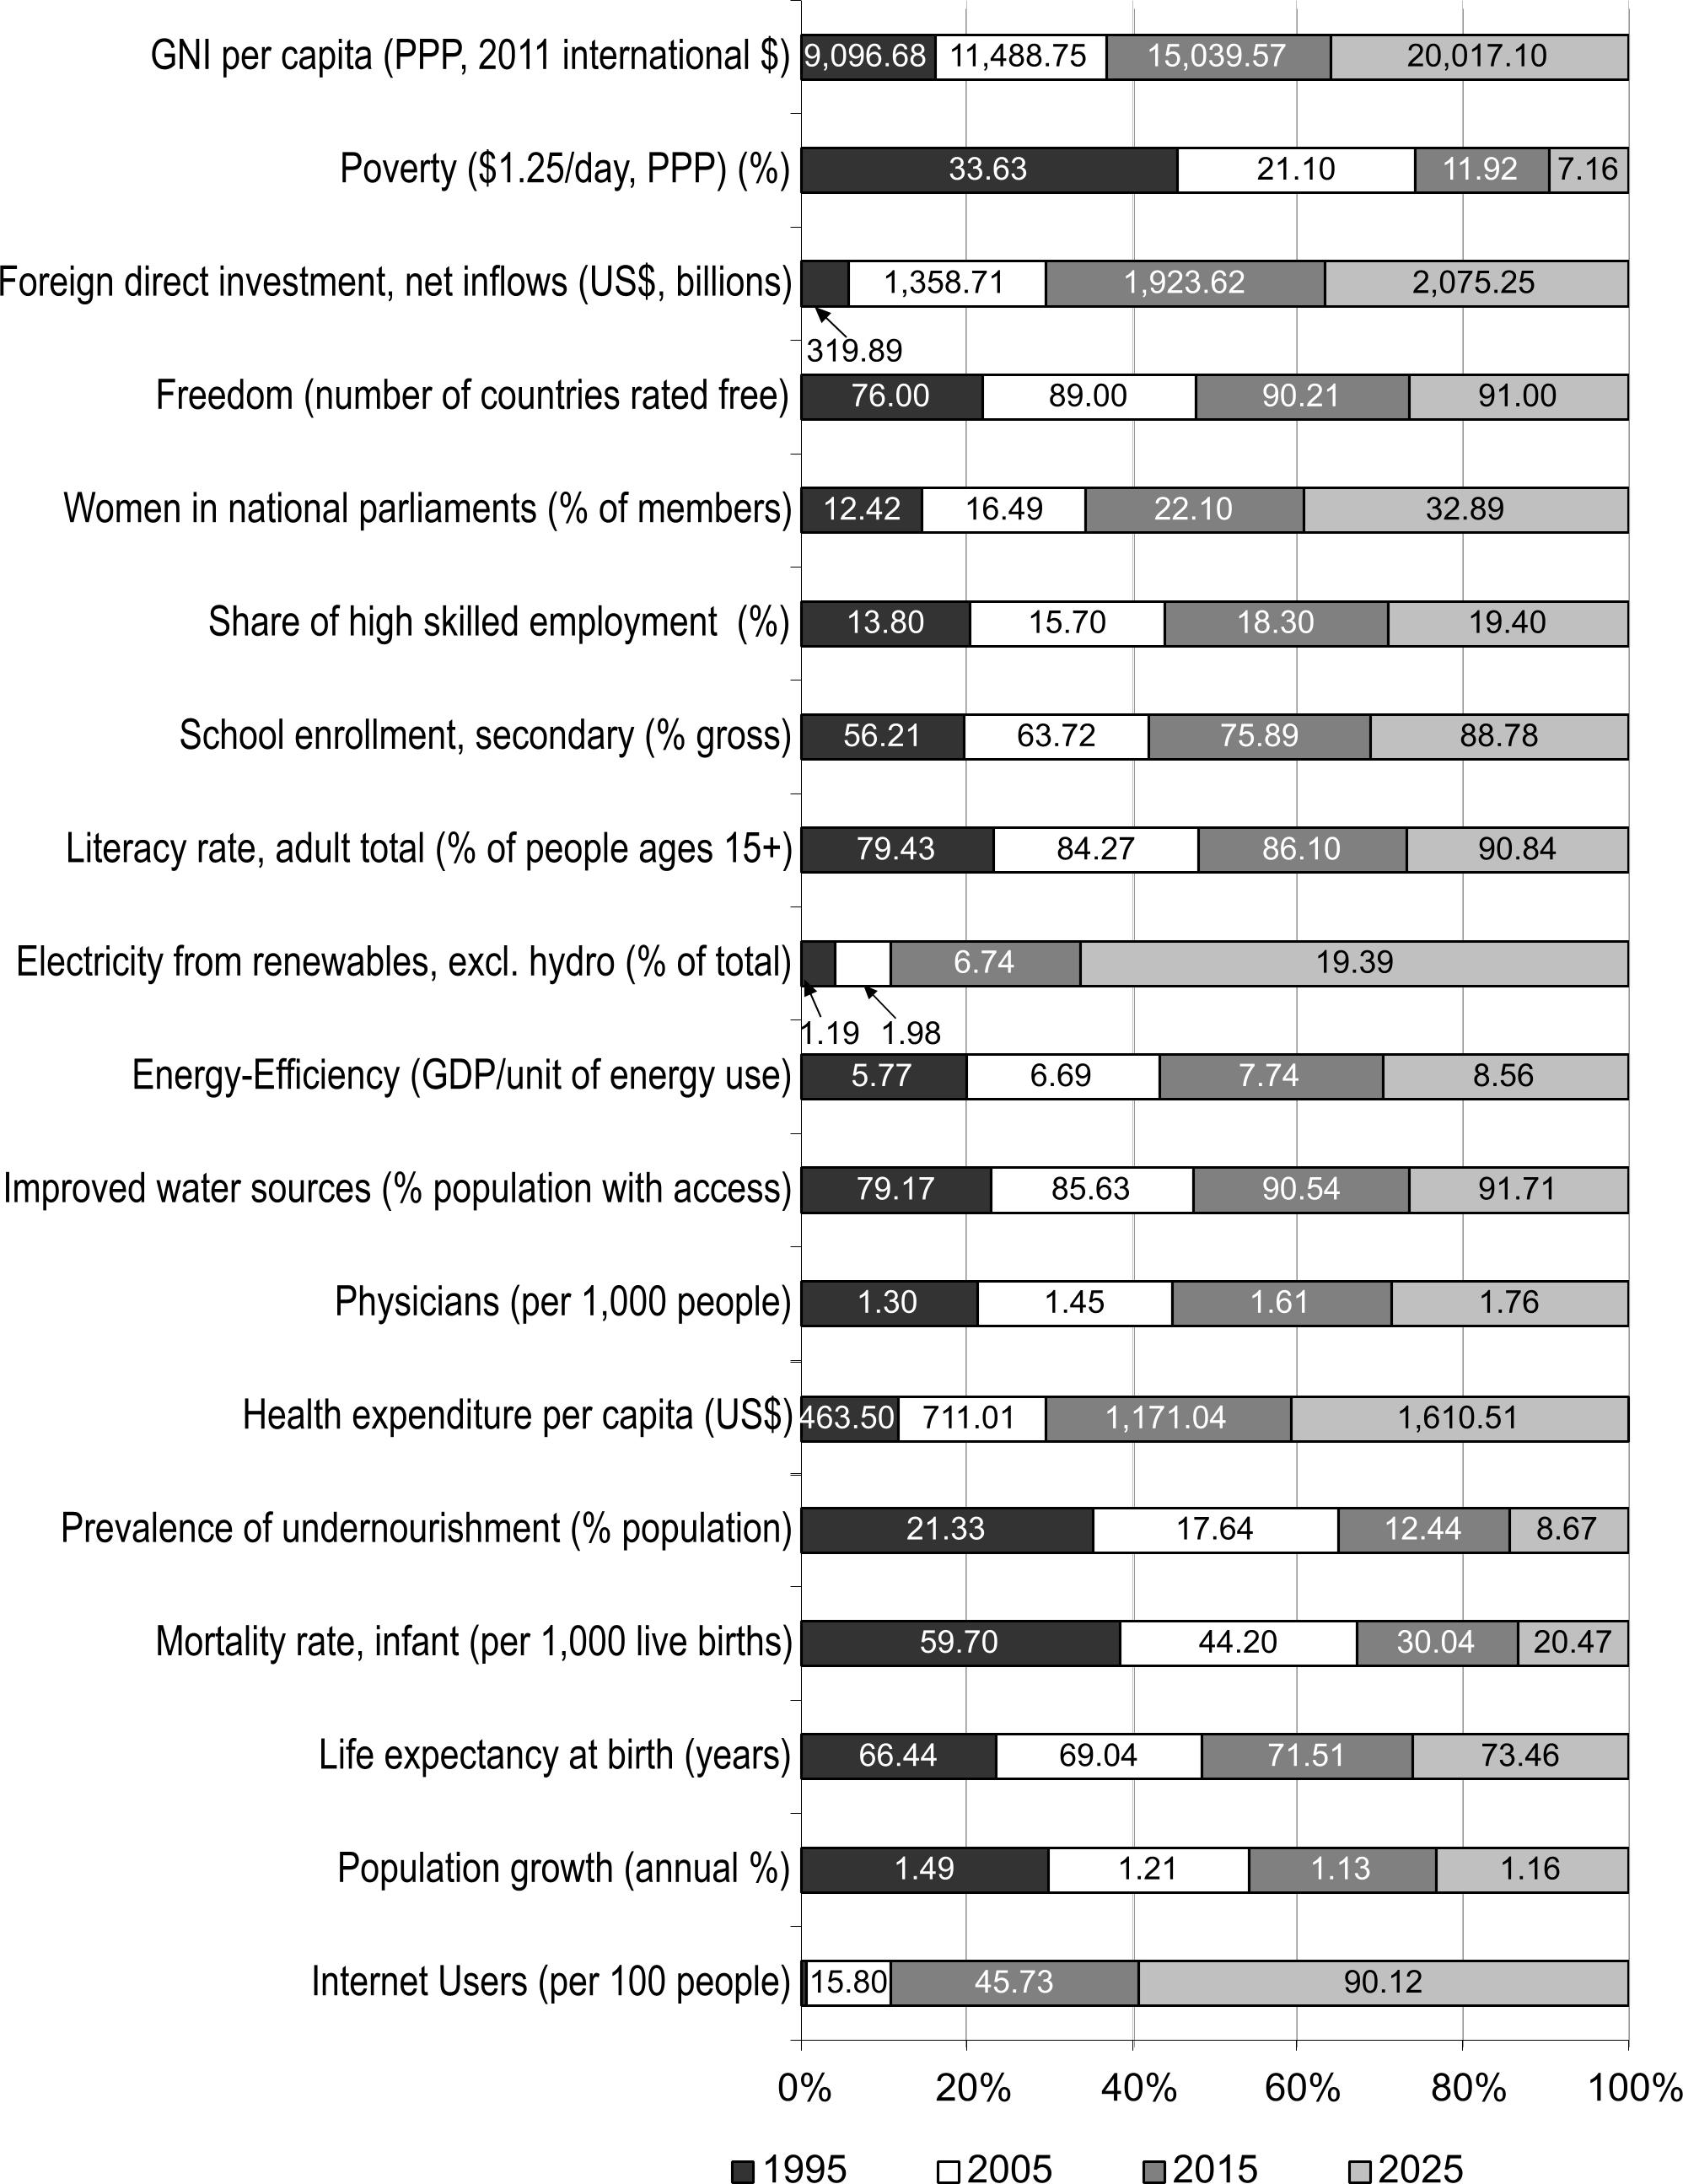
State of the Future Index (28 variables)
Every year, The Millennium Project (MP) computes a “State of the Future Index” looking 10 years into the future, based on data from the previous 20 or more years. The index calculation is based on values for multiple, individually-forecast key variables (28 in 2015). The index is calculated globally, as well as for individual countries. The overall index is intended to show the direction of things to come.
For our purposes the forecasts for the 28 individual variables are of most interest. MP breaks the variables into two groups: those showing improvement, and those showing decline. The values for the individual variables (previous actual, and forecast) are displayed within the shaded area of the charts.
Areas showing improvement in 2015:
Areas showing decline in 2015:
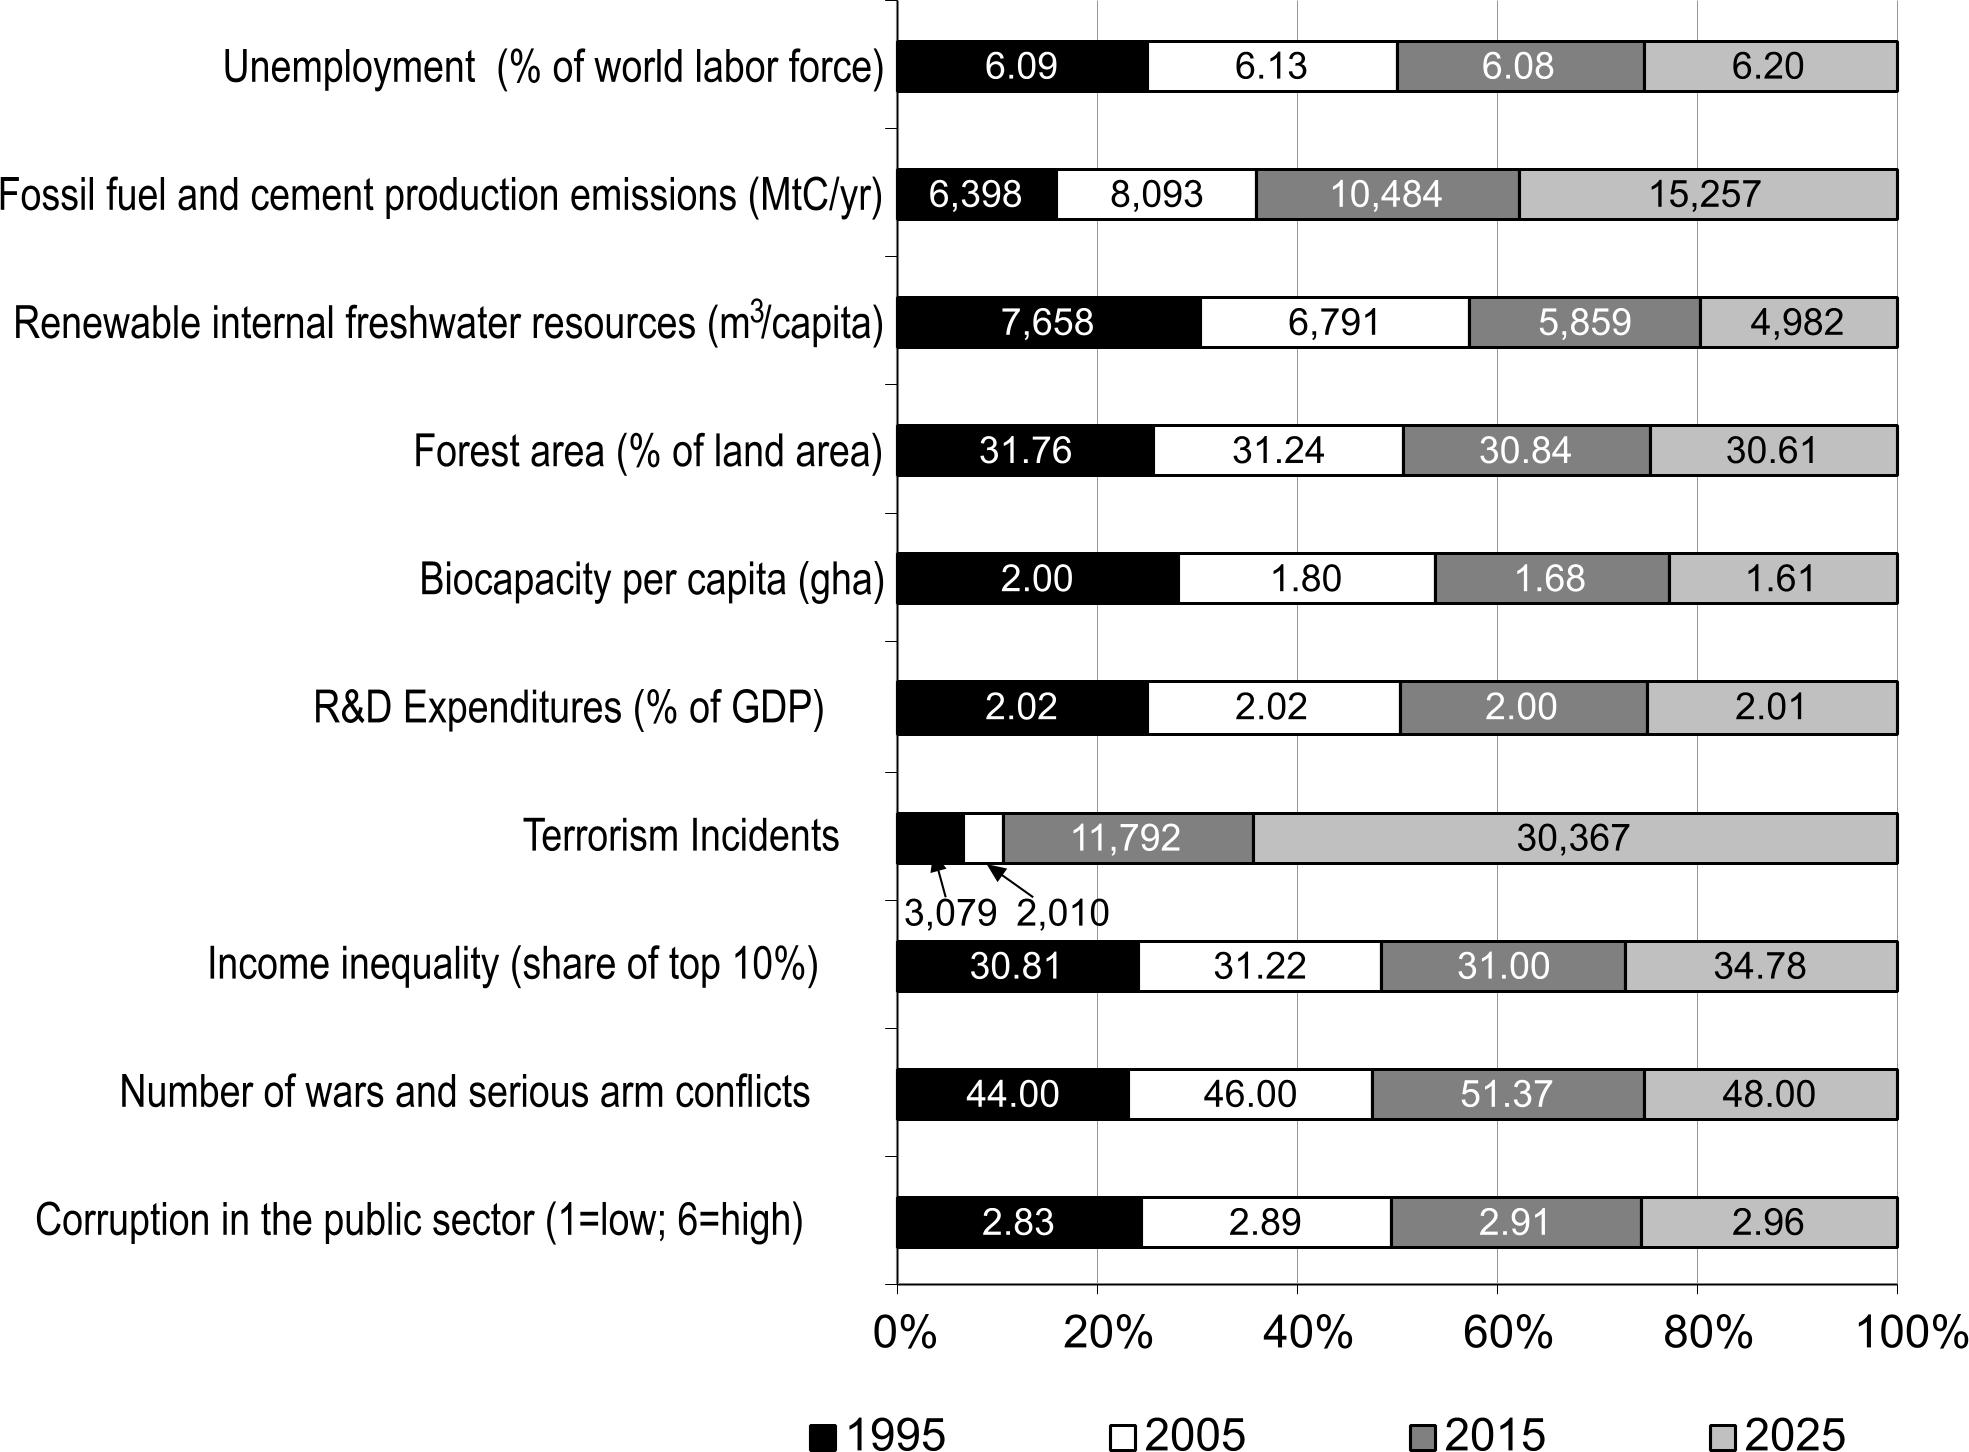
In 2015, the calculated Index looks like this:
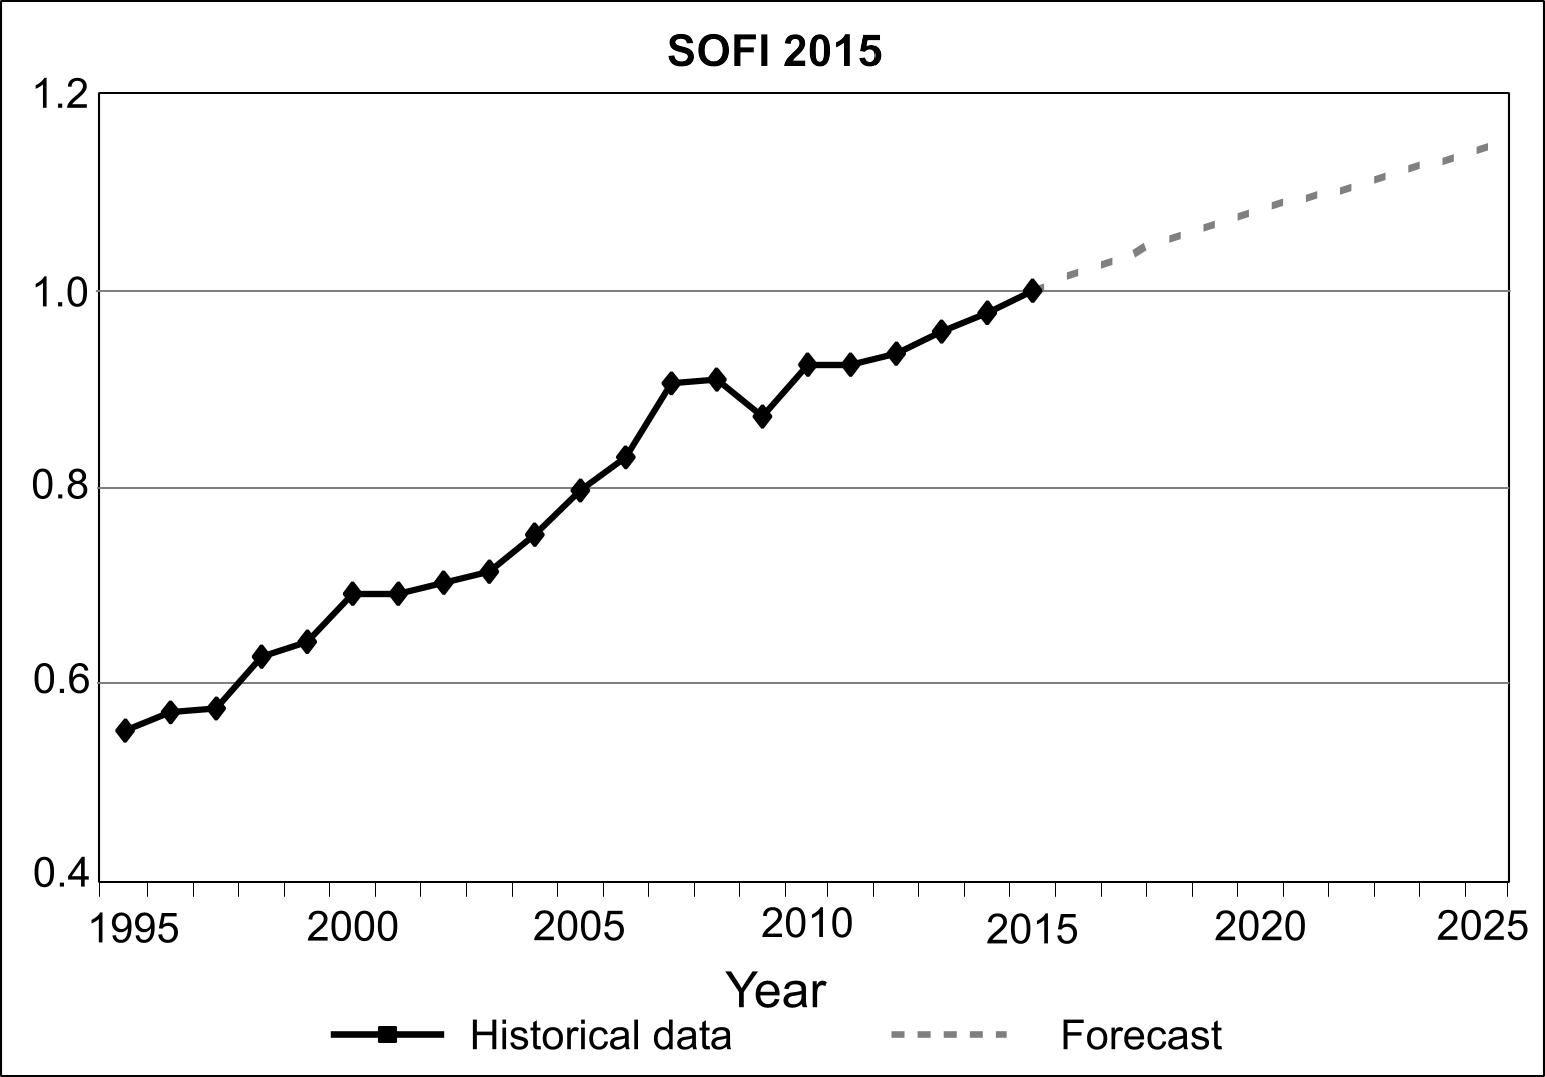
Src: Gordon, Theodore J. 2015. “2015 State of the Future Index.” The Millennium Project.
Charts for each indicator, and a brief indication of the source for the data are in this PDF.
The Millennium Project is an independent non-profit global participatory futures research think tank of futurists, scholars, business planners, and policy makers who work for international organizations, governments, corporations, NGOs, and universities. Their annual report collects and assesses judgments from over 3,000 people selected by its 56 nodes around the world.
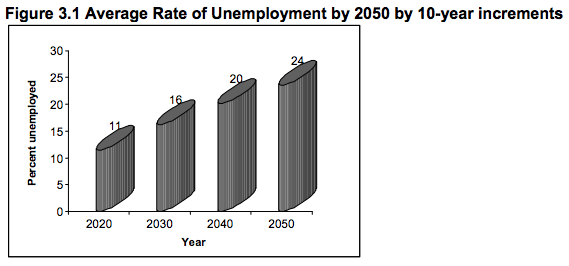
Unemployment Rates to 2050
As part of their 2015-16 State of the Future report (the 18th edition), The Millennium Project conducted a Future Work/Technology 2050 study. Using a Real-Time Delphi survey, the Project asked a panel of 300 experts the following question:
If socio-political-economic systems stay the same around the world, and if technological acceleration, integration, and globalization continue, what percent of the world do you estimate could be unemployed—as we understand being employed today—during each of the following years: 2020; 2030; 2040; 2050?
Their response:
The full chapter (including the responses to 9 other questions also asked of the expert panel) are available here:
Jerome C. Glenn, Elizabeth Florescu, et al. 2015. “Future Work/Technology 2050” in 2015-16 State of the Future.
The Executive Summary for the 2015-16 “State of the Future” report is here:
Jerome C. Glenn, Elizabeth Florescu, et al. 2015. “Executive Summary” in 2015-16 State of the Future.
