

Social Media Consumption: Extrapolations
ASK
Extrapolate to 2050:
Individual daily consumption of all media (web-based and traditional)
Individual daily consumption of social media
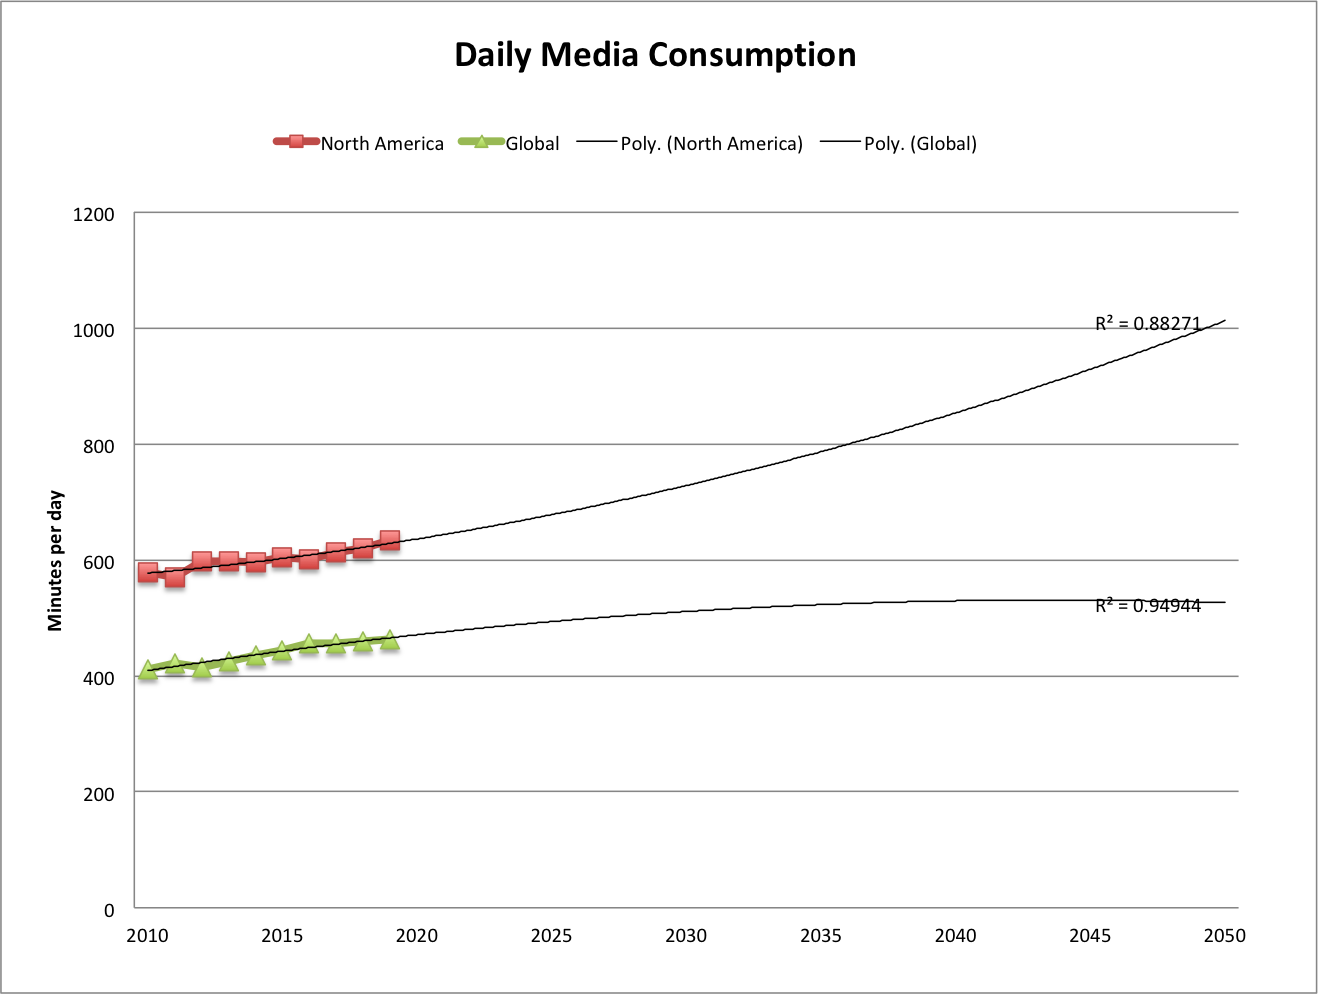
All Media
Zenith (a media agency) tracks this info on a global scale (I’ve not found other sources). They’ve only been publishing reports for the last four years, but I found a Recode article that interviews the head of forecasting at Zenith (Jonathan Barnard). This article provides historic data back to 2010, and forecasts to 2019, contrasting North America with the global average. The article was published in May 2017, and Zenith published a new report in 2018 with slightly different data for the last few years and looking forward, but the most recent report does not provide the context of the previous 10 years. For consistency of methodology, I’ve just used the data quoted by Recode for the following extrapolation.
[Excerpts from all four published Zenith reports are below, showing the yearly revision to their data. In summary, the estimates become more conservative with each subsequent report up until the latest report, which shows a jump again.]
[This and all extrapolations in this post in my file media-consump-forecast.xlsx]
src:
Recode, May 2017
“People consumed more media than ever last year — but growth is slowing”
figure: Average individual daily media consumption in minutes
citing Zenith (appears to be from their 2017 report, including historic data available not freely accessible).
*
Here are excerpts from the press releases for the annual “Media Consumption Forecasts” by Zenith.
From the 2018 Report:
2018: 479 minutes per day consuming media
12% more than in 2011
2020: 492 min/day
From the 2017 report:
2019: less than 1% growth
2017: same as 2016
2016: 456 min/day
2010: 411 min/day
From the 2016 report:
2018F:448 min/day
2015: 435 min/day
2010: 403 min/day
From the 2015 report:
2017F:506 min/day
2015: 492 min/day
2014: 485.3 min/day
2010: 461.8 min/day
***
Social Media
eMarketer and Statista both provide estimates of daily social media consumption. The eMarketer figures cover the US, and the Statista figures are global.
Upon first inspection of the data, the Statista figures seem to be roughly 3X higher than eMarketer’s figures, a disparity that does not agree with my understanding of the variation by country (see We Are Social chart below). I’m quite confident that Statista’s data actually comes from marketing firm Global Web Index, and their recent report (which does not include all the historic info available at Statista) makes frequent passing reference to the increasing amount of time users are watching video on social platforms. In reading various qualitative discussions of social media use, I find many sources group YouTube and Facebook minutes of use together under the social category.
When eMarketer’s social and video minutes are combined, they come in closer range to Statista’s figures, so I believe this is a good rough approximation.
Here’s the extrapolation for both eMarketer (combined social and video) and Statista:
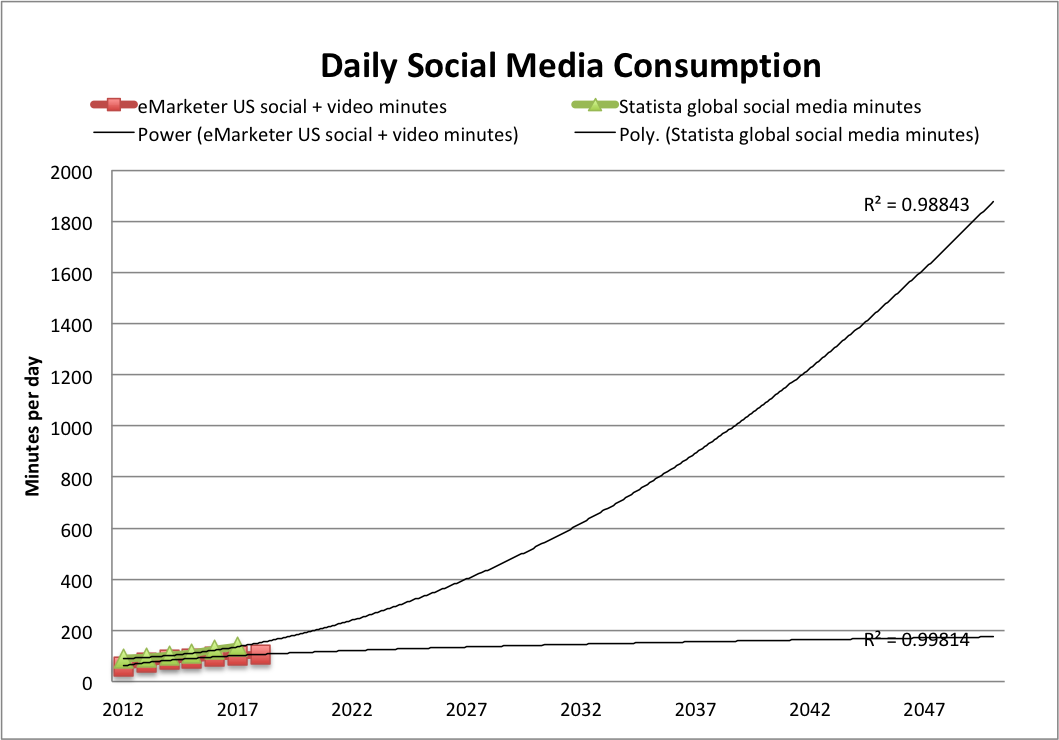
Note: The trendline of best fit for most of our extrapolations doesn’t fit the eMarketer data very well, so instead I’ve used a power trendline. The polynomial(2) trendline we often use does fit the Statista data pretty well, however. (You see both in the figure above)
I also noticed in reading qualitative discussions that Facebook and YouTube’s average daily minutes are very similar, with video getting a bit more time, and this is also the shown in eMarketer’s data, with the gap slowly widening in video’s favor. I’ve extrapolated eMarketer’s social and video figures separately to show how that divergence might take shape (again, the power trendline seemed to fit best).
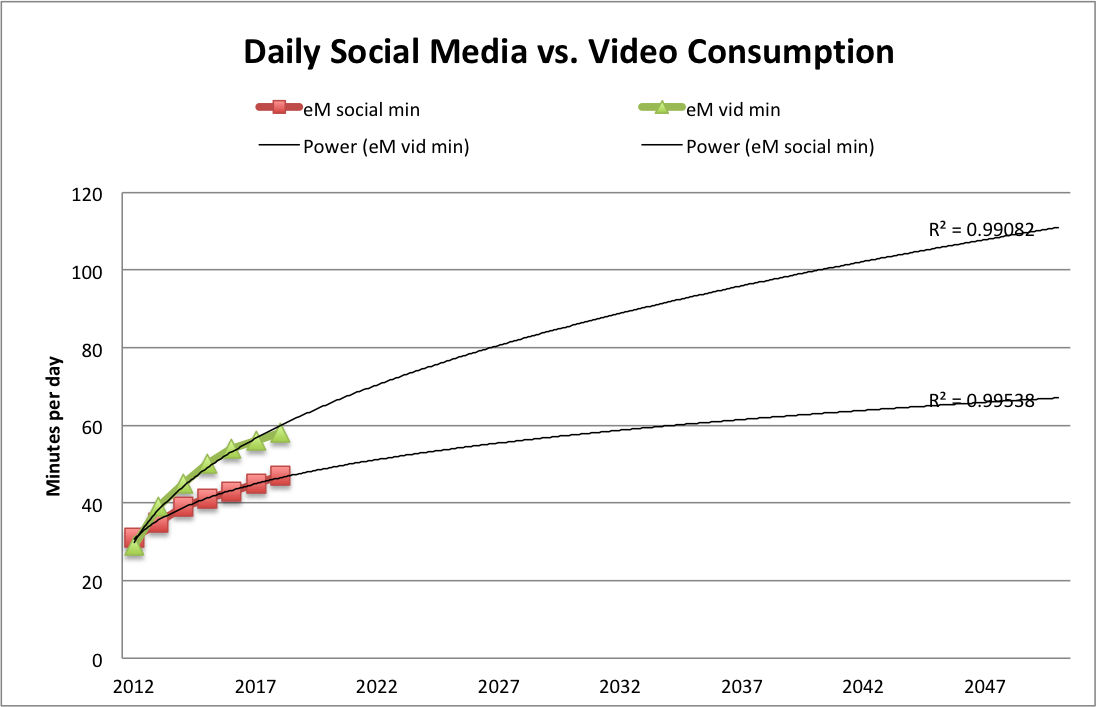
No surprise to see video pulling ahead of social, and I’m certain that marketing research focused on the growth of online video would suggest a much steeper curve.
Meanwhile, and also no surprise, here’s a chart (from Recode, citing Zenith) showing that Internet consumption is overtaking traditional TV consumption (from the same source as the Global/N.American overall media consumption figures above).
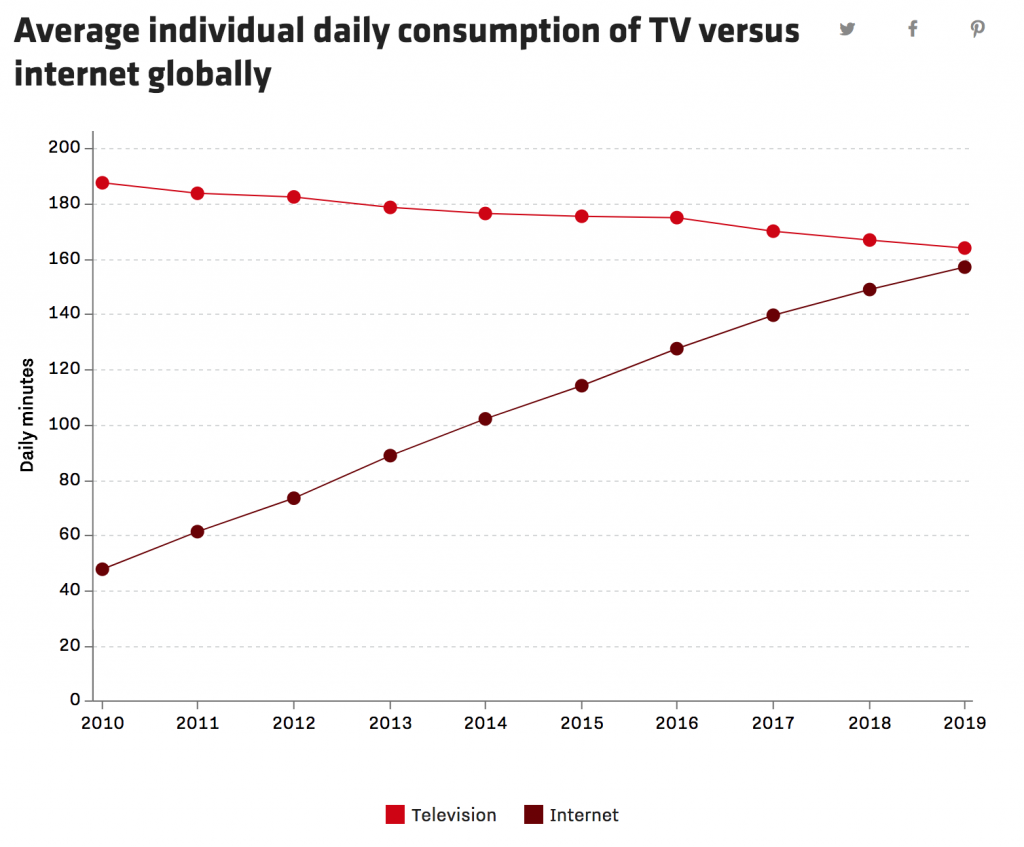
[Click through to the great interactive version at Recode.]
Another ad media firm, GroupM, also predicts online time overtaking traditional TV this year.
In line with that, this year (2018), globally, advertisers are expected to spend more online than on television for the first time. Interestingly, social media ad spending is expected to rise 21% to $58 billion while video ad spending is rising 19% to $32. (Recode citing Zenith)
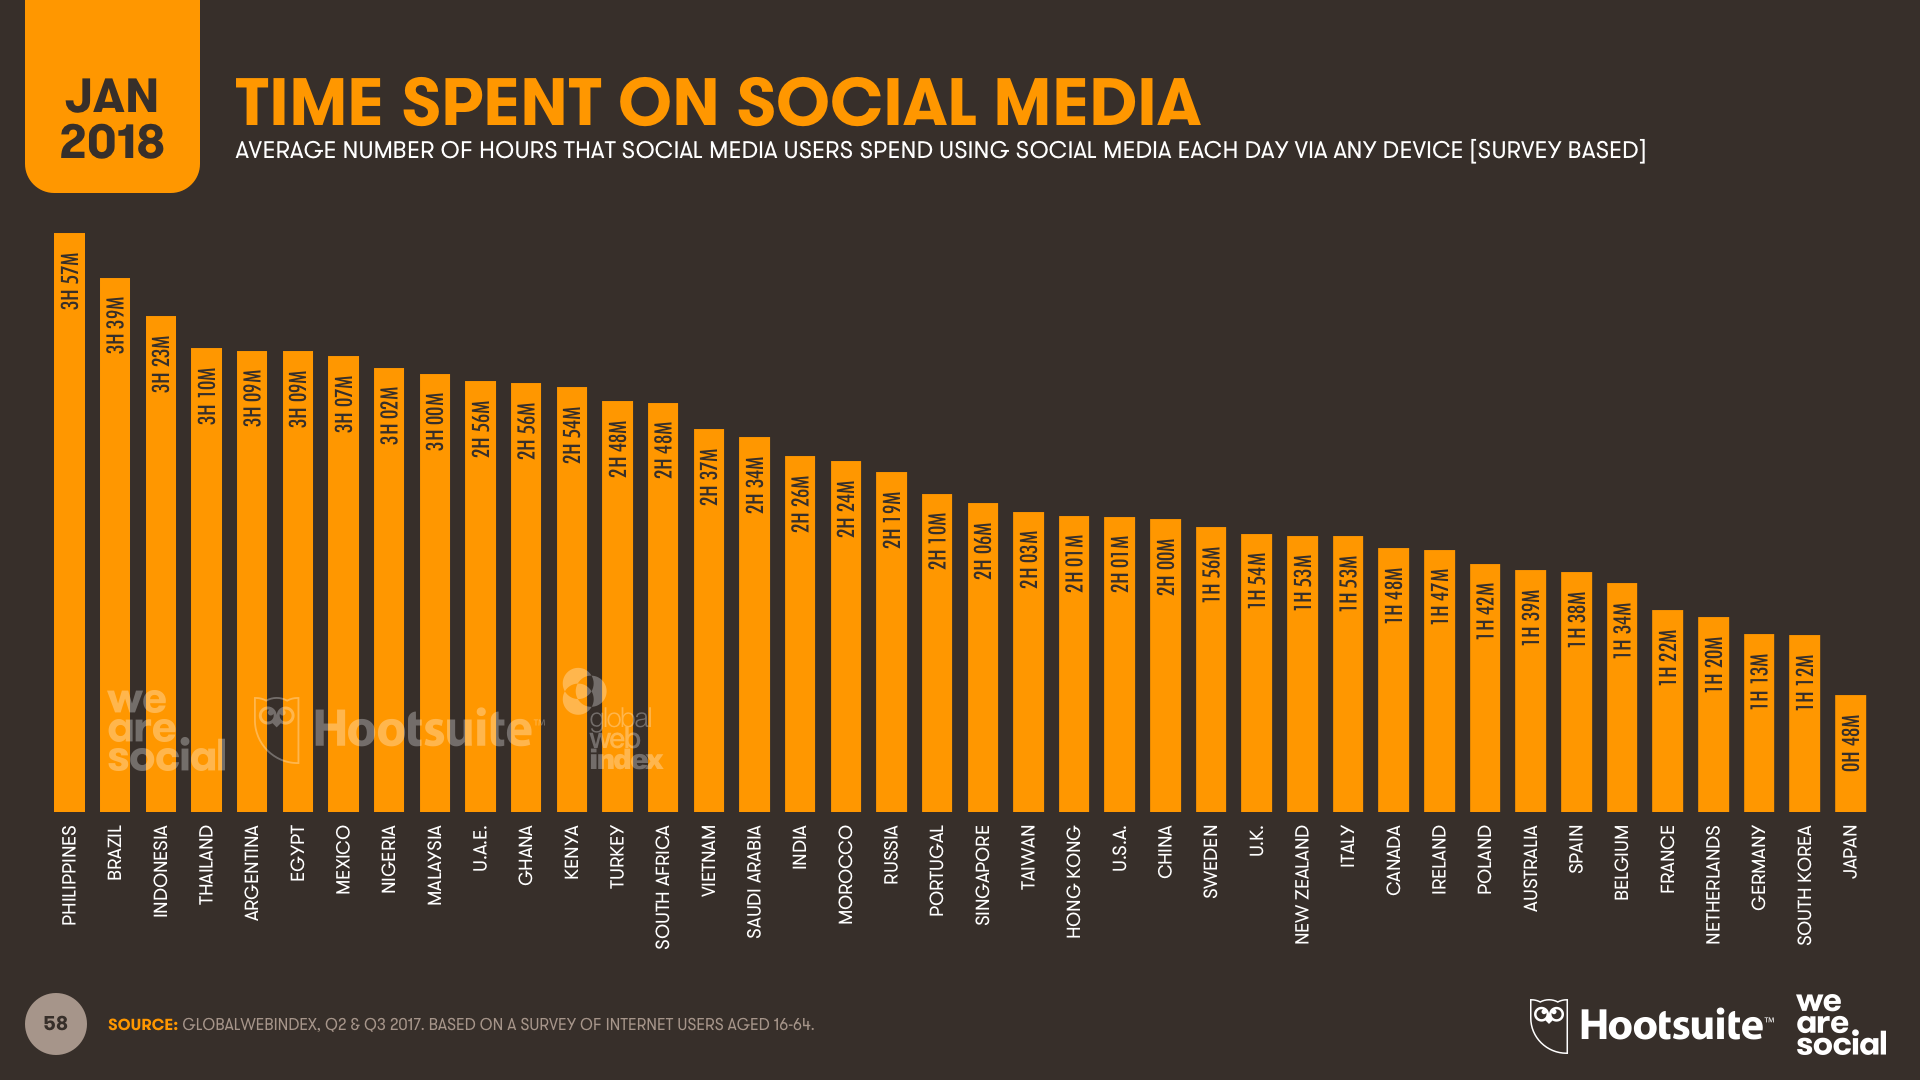
Here’s a snapshot from We Are Social showing how social media consumption varies from one country to another in 2017.
srcs:
eMarketer, June 2016
“Growth in Time Spent with Media Is Slowing”
Note:
eMarketer aggregates data from various research firms and they don’t offer much detail (at least, not to unpaid customers). I don’t know if these figures are based on consumer surveys or if they are based on data provided by service providers.
Statista (citing ??, 2017), 2018
“Daily time spent on social networking by internet users worldwide from 2012 to 2017”
Note:
Statista does not give the name of the original source (to unpaid customers), but they do specify that this data is based on worldwide, online consumer surveys of adults aged 16-64. Statista also reports that the survey question asks, “Roughly how many hours do you spend engaging with/connected to social networks or services during a typical day?” The source must be GlobalWebIndex, which conducts web-based surveys. Their latest report (2018) estimates current social media time exactly as reported by Statista. Their press release here describes the same survey question, and the same survey audience (16-64 year olds).
Entrepreneur, in Jan 2018 (date established via InternetArchive), published the following comparative daily consumption figures:
youtube: 40min/day
facebook: 35min/day
Snapchat: 25min/day
Instagram: 15min/day
Twitter: 1min/day
Media
Summary
This collection of data includes the following indicators, dates, and sources:
GLOBAL
ownership vs. access ($ millions), 2009-2019, McKinsey
total media consumption CAGR, 2010-2015, Zenith
total media consumption min/day, 2010/2015-2018, Zenith
total internet consump min/day, 2015/2018, Zenith
mobile internet consump min/day, 2016, Zenith
all other (besides mobile internet) media consump % change, 2016, Zenith
desktop internet consump min/day, 2010/2014/2016, Zenith
traditional cinema consump % change, 2016, Zenith
traditional outdoor consump % change, 2016, Zenith
traditional television consump min/day, % of consump, % change, 2015/2016/2018, Zenith
traditional radio consump % change, 2016, Zenith
Traditional newspapers consump, % change, 2016, Zenith
traditional magazines consump % change, 2016, Zenith
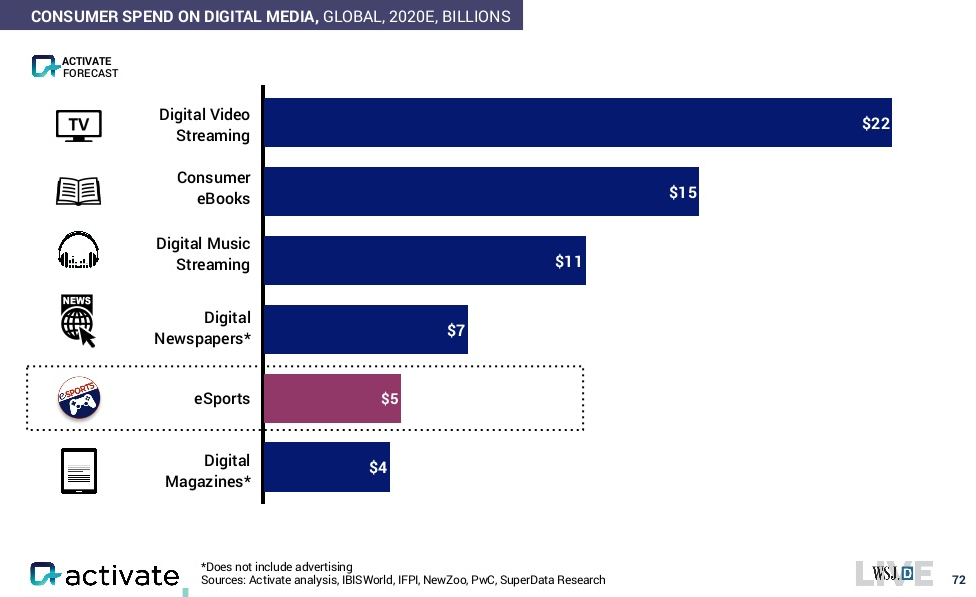
consumer spending, billions, 2020, Activate
digital video streaming
consumer ebooks
digital music streaming
digital newspapers
esports
digital magazines
UNITED STATES PER ADULT
all digital media time/day, 2012-2018, eMarketer
all mobile (nonvoice) media time/day, 2012-2018, eMarketer
mobile radio time/day, 2012-2018, eMarketer
mobile social networks time/day, 2012-2018, eMarketer
mobile video time/day, 2012-2018, eMarketer
mobile other media time/day, 2012-2018, eMarketer
all desk/lap-top media time/day, 2012-2018, eMarketer
desk/lap-top video time/day, 2012-2018, eMarketer
desk/lap-top social media time/day, 2012-2018, eMarketer
desk/lap-top radio time/day, 2012-2018, eMarketer
desk/lap-top other media time/day, 2012-2018, eMarketer
other connected devices time/day, 2012-2018, eMarketer
non-digital TV time/day, 2012-2018, eMarketer
non-digital radio time/day, 2012-2018, eMarketer
non-digital print media time/day, 2012-2018, eMarketer
non-digital newspapers time/day, 2012-2018, eMarketer
non-digital other media time/day, 2012-2018, eMarketer
all digital and non-digital media total time/day, 2012-2018, eMarketer
UNITED STATES, TOTAL AMONG ALL USERS
gaming hours/day and CAGR, 2015/2020, Activate
messaging hours/day and CAGR, 2015/2020, Activate
social media hours/day and CAGR, 2015/2020, Activate
audio hours/day and CAGR, 2015/2020, Activate
video hours/day and CAGR, 2015/2020, Activate
UNITED STATES
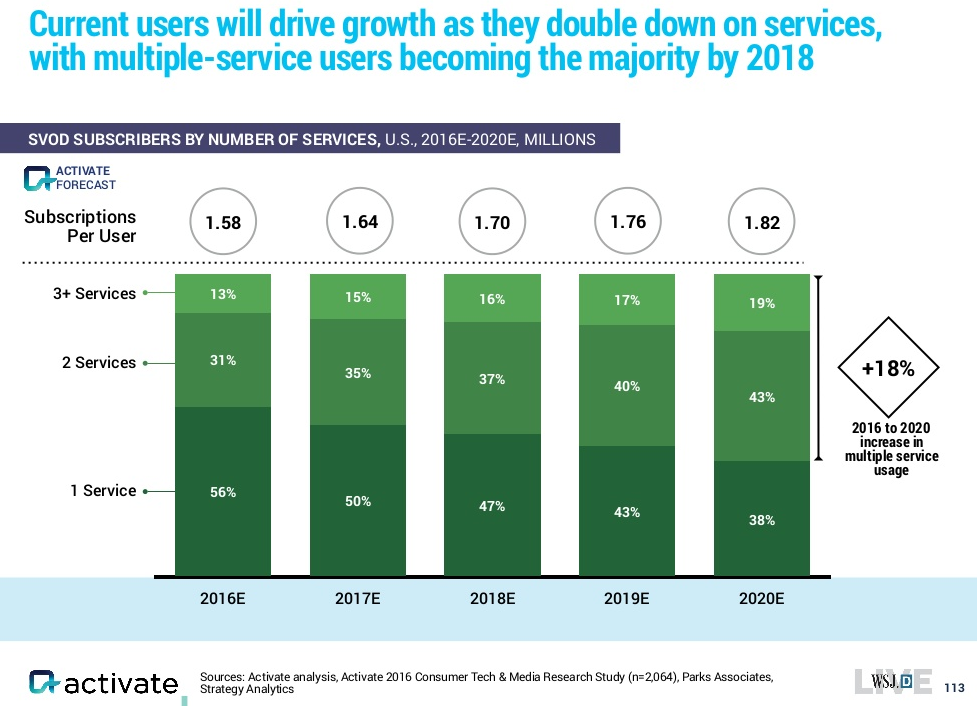
subscription video on demand, subscribers by number of services, 2016-2020, Activate
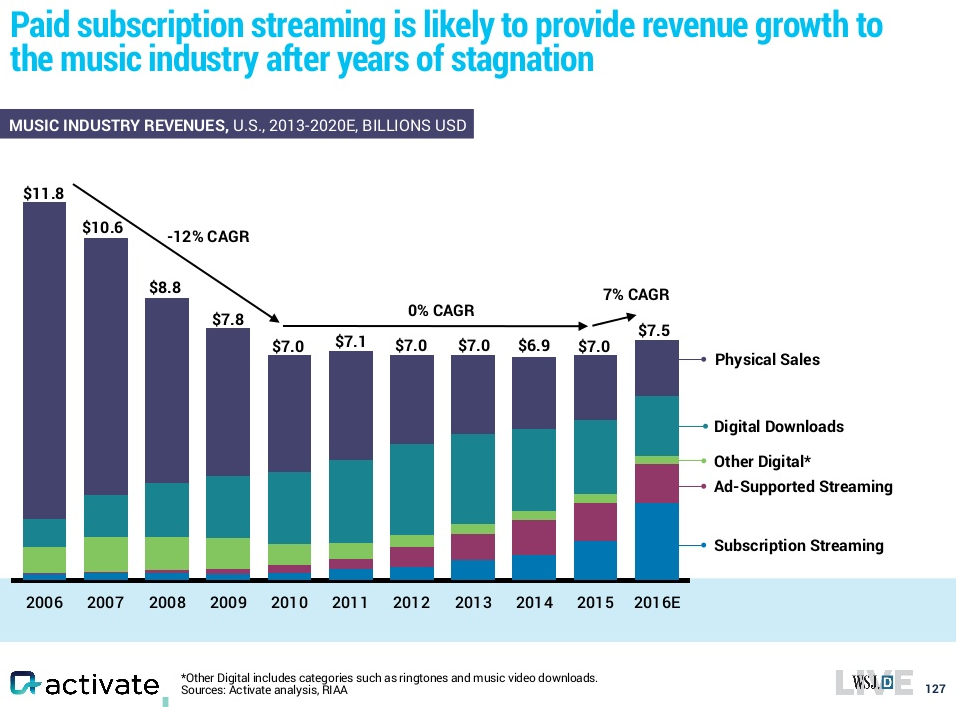
music revenues by sale type, $ and CAGR, 2006-2016, Activate
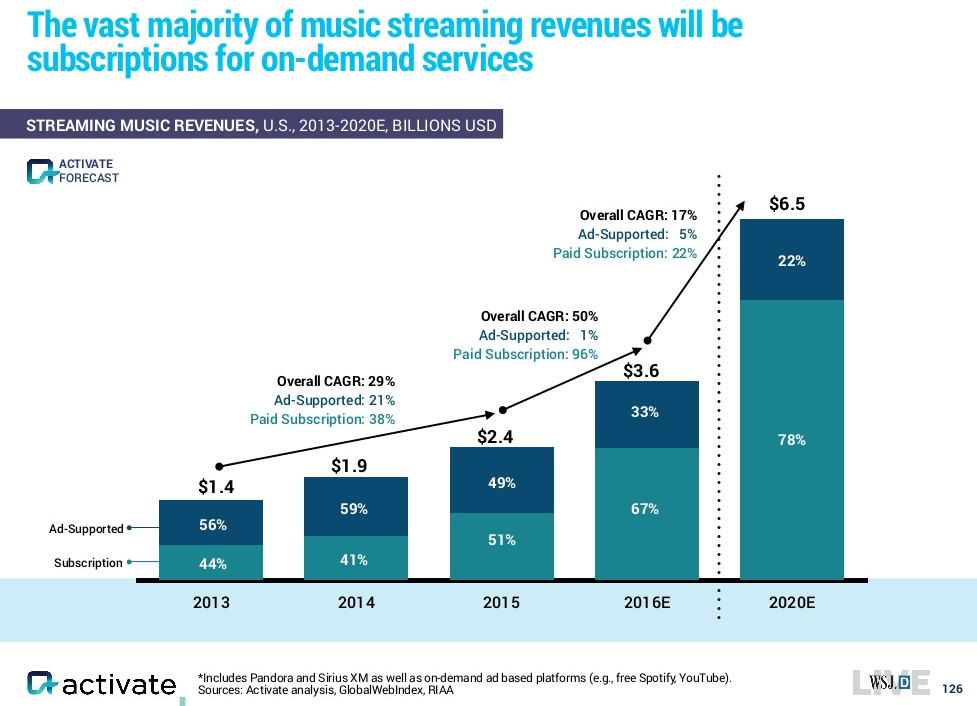
music streaming revenue, ads vs. paid subscriptions, 2013-2020, Activate
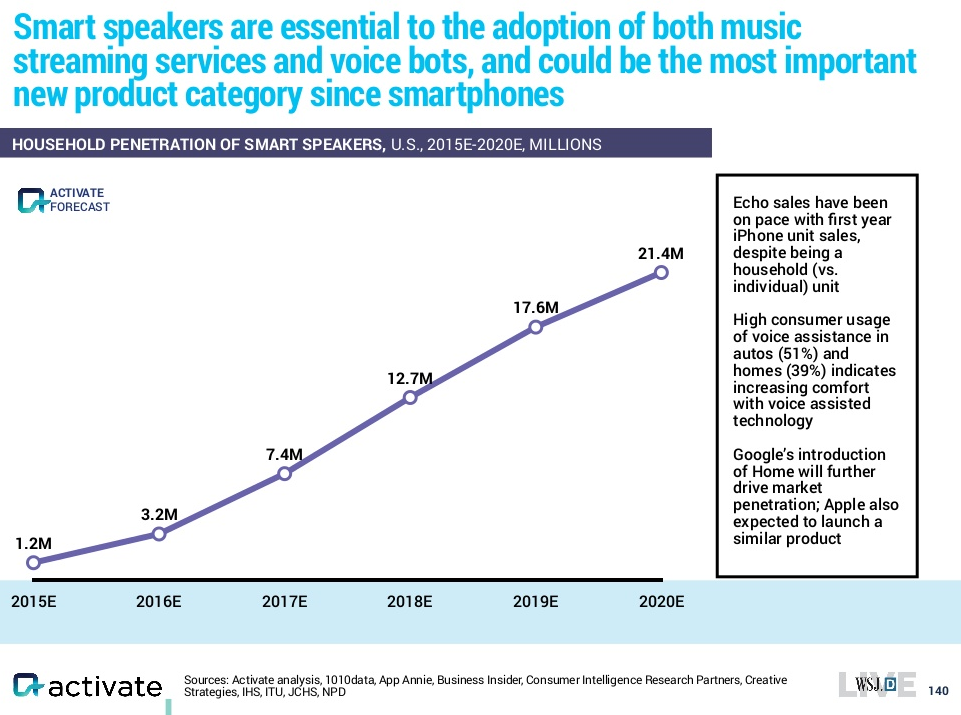
smart speakers household penetration, millions, 2015-2020, Activate
aggregate media spending CAGR, 2016-2020, Activate
internet advertising
internet access
out-of-home advertising
video games
music
tv advertising
business-to-business
book publishing
radio
cinema
tv & video
magazine publishing
newspaper publishing
internet users % of population, 2000-2014, ITU
broadband subscriptions, 2000-2015, ITU
wired-line vs. wireless users, 2000-2014, Activate
In addition to these data sets, I’ve also noted a large set of VR predictions by Jesse Schell.
Findings
General Media Consumption
McKinsey publishes an annual global media spending/revenues report examining the last five years of historic data and forecasting trends for the next five years. The most recent report includes the following ownership vs. access chart:
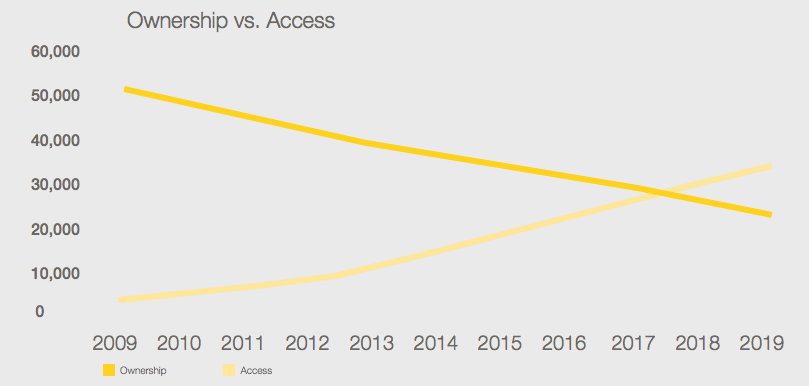
Note: Ownership consists of home video physical sales, physical recorded music sales and recorded music digital downloads. Access consists of OTT digital
video, recorded music digital subscriptions and recorded music ad-supported digital streaming.
Src:
McKinsey&Company. July 2016.
“Global Media Report 2015: Global Industry Overview.” P.21.
Citing:
McKinsey & Company, Wilkofsky Gruen Associates
Older McKinsey reports are available, which offer some older, historic data points. For example, the 2014-2018 Outlook includes some historic data going back to 2013.
*
Zenith (part of Publicis Media) is a marking consulting firm. It’s annual, global survey (two years running), “Media Consumption Forecasts,” estimates recent, current, and near-term media consumption patterns. The current report forecasts general media consumption trends two years out, to 2018. The report estimates time spent reading newspapers and magazines, watching television, listening to the radio, visiting the cinema, using the internet, and viewing outdoor advertising while out of the home. 71 countries are covered, and regional estimates are available (although the freely available excerpts below are global).
Excerpts:
Total media consumption
2010-2015: +7.9% (driven by internet consump), avg +1.5% per year
2010: 403 min/day
2015: 435 min/day
2016: +1.4%
2017: +1.2%
2018: 448 min/day, +0.4% (mobile consump levels off)
Total internet consumption
2015: 110 min/day
2018: 31% global media consumption
Mobile internet consumption
2016: +27.7%, 86 min/day, accounting for 71% of internet consump
Overall media consumption
2016: +1.4%
All other media consumption (besides mobile internet)
2016: -3.4%
Desktop internet consumption
2010: 36 min/day
2014: 52 min/day
2016: 36 min/day
Traditional cinema consumption
2016: -0.5%
Traditional outdoor consumption
2016: -0.8%
Traditional television consumption
[declining, but still the most popular medium]
2015: 177 min/day, 41% of media consumption
2016: -1.5%
2018: 38% of media consumption
Traditional radio consumption
2016: -2.4%
Traditional newspapers consumption
2016: -5.6%
Traditional magazines consumption
2016: -6.7%
Note: [The traditional media] figures only refer to time spent with these media in their traditional forms – with printed publications and broadcast television channels and radio stations. Much of the time that consumers spend on the internet is devoted to consuming content that has been produced by traditional publishers and broadcasters.
Src:
Zenith. June 2016.
“Media Consumption Forecasts.”
Via:
Contact:
Jonathan Barnard, Head of Forecasting, jbarnard1@publicisgroupe.net
Tim Collison, Global Communications Director, tcolliso@publicisgroupe.net
*
eMarketer has been publishing short-term forecasts of general media consumption longer than Zenith. It’s latest forecasts to 2018 show similar trends, although the total time consumed estimates are quite different.
Excerpts:
While mobile devices enable people to consume media content anywhere at any time, the numbers suggest a saturation point is near—and that increased time spent with one medium will tend to come at the expense of time spent with another, as explored in a new eMarketer report, “US Time Spent with Media: eMarketer’s Updated Estimates for Spring 2016.”
Src:
eMarketer. June 2016.
“Growth in Time Spent with Media Is Slowing.”
*
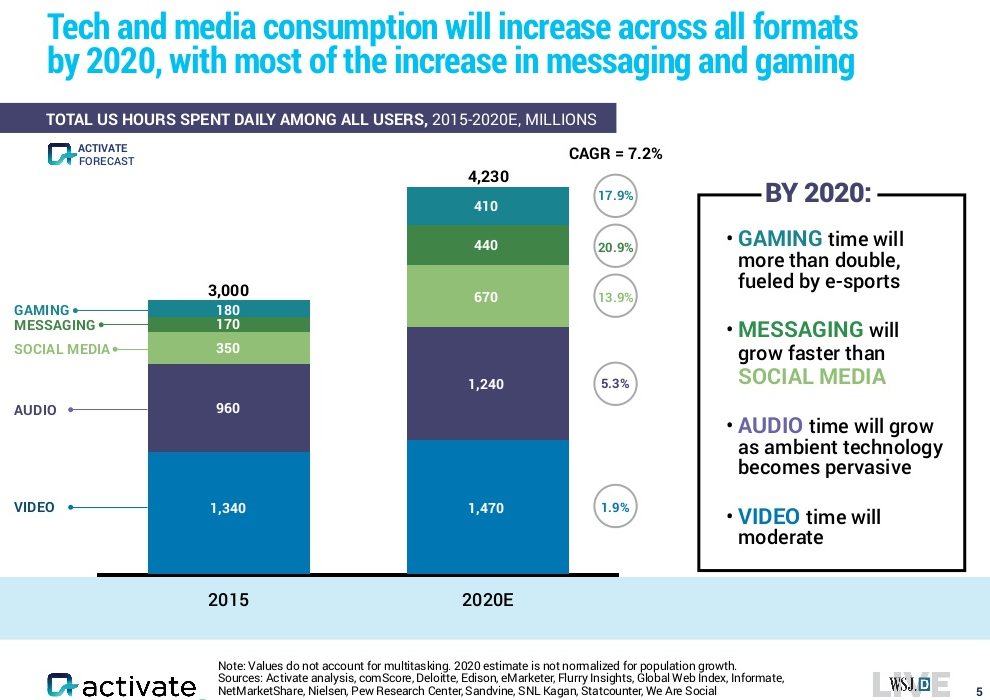
Technology strategist Michael Wolf, of Activate, recently presented a number of media forecasts at WSJDLive, The Wall Street Jounral’s global tech conference.
Here are excerpts:
Src:
Activate. October 2016.
“Tech and Media Outlook 2017.”
*
PwC produces an annual 5-year outlook for the entertainment and media industry which includes forecasts of consumer spending and advertising revenues.
Here are forecasts for US aggregate media spending for 2016-2020:

Src:
PRNewswire. June 2016.
“PwC’s Entertainment & Media Outlook Forecasts U.S. Industry Spending to Reach $720 Billion by 2020.”
citing:
PwC. June 2016.
“PwC Global Media and Entertainment Outlook: 2016-2020.”
*
PwC’s Chris Lederer, Partner, PwC’s Strategy&, Entertainment & Media practice, gave the following generalizations and examples from the latest report:
“At the highest level our annual Global entertainment and Media Outlook shows a mature media industry with slowing growth prospects.”
“The countries with large populations under 35 are faster growers than countries with larger aged populations,” Lederer observes.
More specifically, PwC’s analysis found that “on average, E&M spending in the 10 youngest markets is growing three times as rapidly as in the 10 oldest markets.”

2016 is the year when global Internet advertising revenue will surpass TV advertising

src:
Damian Radcliffe. August 2016.
“PwC’s global media outlook 2016-2020: six key trends.”
The Media Briefing.
***
Internet Users
ITU publishes an annual estimate of the percentage of internet users in each country.
United States, 2000-2014
Src:
ITU. 2016.
“Percentage of Individuals using the Internet (excel).”
[ICT Statistics]
***
Broadband Subscriptions

Src:
Andrew Meola. Jun 2016.
“All media consumption is declining – with one exception.”
Business Insider.
Citing: ITU
ITU data is here:
Src:
ITU. 2016.
“Key ICT indicators for developed and developing countries and the world (totals and penetration rates).” [XLS]
[ICT Statistics]
***
Wired-Line Vs. Wireless Users
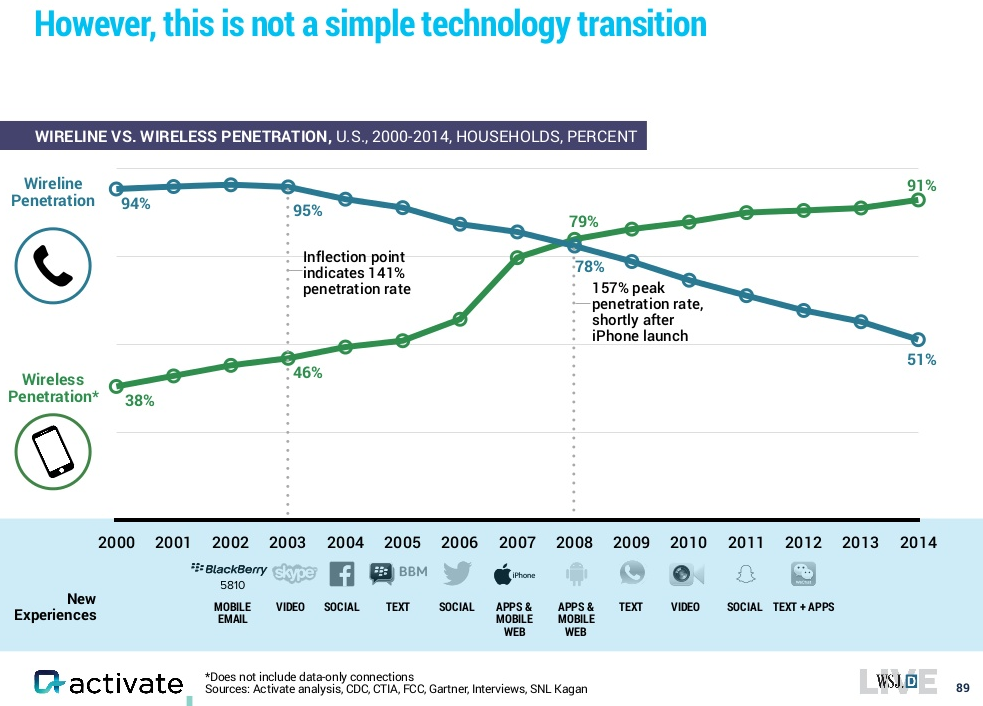
Src:
Activate. October 2016.
“Tech and Media Outlook 2017.”
***
VR Predictions
Game Designer Jesse Schell has made a large set of 40 (mostly) falsifiable predictions for VR, looking out as far as 2025.
Src:
Jesse Schell. March 2016.
“40 VR/AR Predictions – GDC 2016”
Media
Summary
This collection of data includes the following indicators, dates, and sources:
GLOBAL
ownership vs. access ($ millions), 2009-2019, McKinsey
total media consumption CAGR, 2010-2015, Zenith
total media consumption min/day, 2010/2015-2018, Zenith
total internet consump min/day, 2015/2018, Zenith
mobile internet consump min/day, 2016, Zenith
all other (besides mobile internet) media consump % change, 2016, Zenith
desktop internet consump min/day, 2010/2014/2016, Zenith
traditional cinema consump % change, 2016, Zenith
traditional outdoor consump % change, 2016, Zenith
traditional television consump min/day, % of consump, % change, 2015/2016/2018, Zenith
traditional radio consump % change, 2016, Zenith
Traditional newspapers consump, % change, 2016, Zenith
traditional magazines consump % change, 2016, Zenith
consumer spending, billions, 2020, Activate
digital video streaming
consumer ebooks
digital music streaming
digital newspapers
esports
digital magazines
UNITED STATES PER ADULT
all digital media time/day, 2012-2018, eMarketer
all mobile (nonvoice) media time/day, 2012-2018, eMarketer
mobile radio time/day, 2012-2018, eMarketer
mobile social networks time/day, 2012-2018, eMarketer
mobile video time/day, 2012-2018, eMarketer
mobile other media time/day, 2012-2018, eMarketer
all desk/lap-top media time/day, 2012-2018, eMarketer
desk/lap-top video time/day, 2012-2018, eMarketer
desk/lap-top social media time/day, 2012-2018, eMarketer
desk/lap-top radio time/day, 2012-2018, eMarketer
desk/lap-top other media time/day, 2012-2018, eMarketer
other connected devices time/day, 2012-2018, eMarketer
non-digital TV time/day, 2012-2018, eMarketer
non-digital radio time/day, 2012-2018, eMarketer
non-digital print media time/day, 2012-2018, eMarketer
non-digital newspapers time/day, 2012-2018, eMarketer
non-digital other media time/day, 2012-2018, eMarketer
all digital and non-digital media total time/day, 2012-2018, eMarketer
UNITED STATES, TOTAL AMONG ALL USERS
gaming hours/day and CAGR, 2015/2020, Activate
messaging hours/day and CAGR, 2015/2020, Activate
social media hours/day and CAGR, 2015/2020, Activate
audio hours/day and CAGR, 2015/2020, Activate
video hours/day and CAGR, 2015/2020, Activate
UNITED STATES
subscription video on demand, subscribers by number of services, 2016-2020, Activate
music revenues by sale type, $ and CAGR, 2006-2016, Activate
music streaming revenue, ads vs. paid subscriptions, 2013-2020, Activate
smart speakers household penetration, millions, 2015-2020, Activate
aggregate media spending CAGR, 2016-2020, Activate
internet advertising
internet access
out-of-home advertising
video games
music
tv advertising
business-to-business
book publishing
radio
cinema
tv & video
magazine publishing
newspaper publishing
internet users % of population, 2000-2014, ITU
broadband subscriptions, 2000-2015, ITU
wired-line vs. wireless users, 2000-2014, Activate
In addition to these data sets, I’ve also noted a large set of VR predictions by Jesse Schell.
Findings
General Media Consumption
McKinsey publishes an annual global media spending/revenues report examining the last five years of historic data and forecasting trends for the next five years. The most recent report includes the following ownership vs. access chart:
Note: Ownership consists of home video physical sales, physical recorded music sales and recorded music digital downloads. Access consists of OTT digital
video, recorded music digital subscriptions and recorded music ad-supported digital streaming.
Src:
McKinsey&Company. July 2016.
“Global Media Report 2015: Global Industry Overview.” P.21.
Citing:
McKinsey & Company, Wilkofsky Gruen Associates
Older McKinsey reports are available, which offer some older, historic data points. For example, the 2014-2018 Outlook includes some historic data going back to 2013.
*
Zenith (part of Publicis Media) is a marking consulting firm. It’s annual, global survey (two years running), “Media Consumption Forecasts,” estimates recent, current, and near-term media consumption patterns. The current report forecasts general media consumption trends two years out, to 2018. The report estimates time spent reading newspapers and magazines, watching television, listening to the radio, visiting the cinema, using the internet, and viewing outdoor advertising while out of the home. 71 countries are covered, and regional estimates are available (although the freely available excerpts below are global).
Excerpts:
Total media consumption
2010-2015: +7.9% (driven by internet consump), avg +1.5% per year
2010: 403 min/day
2015: 435 min/day
2016: +1.4%
2017: +1.2%
2018: 448 min/day, +0.4% (mobile consump levels off)
Total internet consumption
2015: 110 min/day
2018: 31% global media consumption
Mobile internet consumption
2016: +27.7%, 86 min/day, accounting for 71% of internet consump
Overall media consumption
2016: +1.4%
All other media consumption (besides mobile internet)
2016: -3.4%
Desktop internet consumption
2010: 36 min/day
2014: 52 min/day
2016: 36 min/day
Traditional cinema consumption
2016: -0.5%
Traditional outdoor consumption
2016: -0.8%
Traditional television consumption
[declining, but still the most popular medium]
2015: 177 min/day, 41% of media consumption
2016: -1.5%
2018: 38% of media consumption
Traditional radio consumption
2016: -2.4%
Traditional newspapers consumption
2016: -5.6%
Traditional magazines consumption
2016: -6.7%
Note: [The traditional media] figures only refer to time spent with these media in their traditional forms – with printed publications and broadcast television channels and radio stations. Much of the time that consumers spend on the internet is devoted to consuming content that has been produced by traditional publishers and broadcasters.
Src:
Zenith. June 2016.
“Media Consumption Forecasts.”
Via:
Contact:
Jonathan Barnard, Head of Forecasting, jbarnard1@publicisgroupe.net
Tim Collison, Global Communications Director, tcolliso@publicisgroupe.net
*
eMarketer has been publishing short-term forecasts of general media consumption longer than Zenith. It’s latest forecasts to 2018 show similar trends, although the total time consumed estimates are quite different.
Excerpts:
While mobile devices enable people to consume media content anywhere at any time, the numbers suggest a saturation point is near—and that increased time spent with one medium will tend to come at the expense of time spent with another, as explored in a new eMarketer report, “US Time Spent with Media: eMarketer’s Updated Estimates for Spring 2016.”
Src:
eMarketer. June 2016.
“Growth in Time Spent with Media Is Slowing.”
*
Technology strategist Michael Wolf, of Activate, recently presented a number of media forecasts at WSJDLive, The Wall Street Jounral’s global tech conference.
Here are excerpts:
Src:
Activate. October 2016.
“Tech and Media Outlook 2017.”
*
PwC produces an annual 5-year outlook for the entertainment and media industry which includes forecasts of consumer spending and advertising revenues.
Here are forecasts for US aggregate media spending for 2016-2020:
Src:
PRNewswire. June 2016.
“PwC’s Entertainment & Media Outlook Forecasts U.S. Industry Spending to Reach $720 Billion by 2020.”
citing:
PwC. June 2016.
“PwC Global Media and Entertainment Outlook: 2016-2020.”
*
PwC’s Chris Lederer, Partner, PwC’s Strategy&, Entertainment & Media practice, gave the following generalizations and examples from the latest report:
“At the highest level our annual Global entertainment and Media Outlook shows a mature media industry with slowing growth prospects.”
“The countries with large populations under 35 are faster growers than countries with larger aged populations,” Lederer observes.
More specifically, PwC’s analysis found that “on average, E&M spending in the 10 youngest markets is growing three times as rapidly as in the 10 oldest markets.”
2016 is the year when global Internet advertising revenue will surpass TV advertising
src:
Damian Radcliffe. August 2016.
“PwC’s global media outlook 2016-2020: six key trends.”
The Media Briefing.
***
Internet Users
ITU publishes an annual estimate of the percentage of internet users in each country.
United States, 2000-2014
Src:
ITU. 2016.
“Percentage of Individuals using the Internet (excel).”
[ICT Statistics]
***
Broadband Subscriptions
Src:
Andrew Meola. Jun 2016.
“All media consumption is declining – with one exception.”
Business Insider.
Citing: ITU
ITU data is here:
Src:
ITU. 2016.
“Key ICT indicators for developed and developing countries and the world (totals and penetration rates).” [XLS]
[ICT Statistics]
***
Wired-Line Vs. Wireless Users
Src:
Activate. October 2016.
“Tech and Media Outlook 2017.”
***
VR Predictions
Game Designer Jesse Schell has made a large set of 40 (mostly) falsifiable predictions for VR, looking out as far as 2025.
Src:
Jesse Schell. March 2016.
“40 VR/AR Predictions – GDC 2016”
Media was originally published on Extrapolations
