

Energy Mix, Consumption, Prices, Emissions
Overview
Energy mix forecasts looking out 15 to 35 years are available from a handful of governmental, industry, and independent sources. The excerpts below are preceded by my brief notes, in italic, introducing the source.
General consensus: oil, gas, and coal continue to dominate the energy mix. Gas grows substantially; oil and coal are either level or decreasing. Renewables show the highest growth rates. Amongst renewables, solar shows the greatest growth. Energy intensity (or consumption per capita) decreases.
In addition to energy mix, the figures below also include forecasts for overall usage, intensity (per capita usage), prices, residential sources, and emissions.
Findings
U.S. Energy Information Administration
The U.S. Energy Information Administration (EIA) presents energy forecasts for a range of cases in its Annual Energy Outlook. The excerpts below refer to the Reference Case, wherein GDP grows at an average annual rate of 2.4%, and current laws and regulations remain basically the same. This is the “business as usual” scenario. Forecasts for five other scenarios are presented in the report, but are not excerpted here.
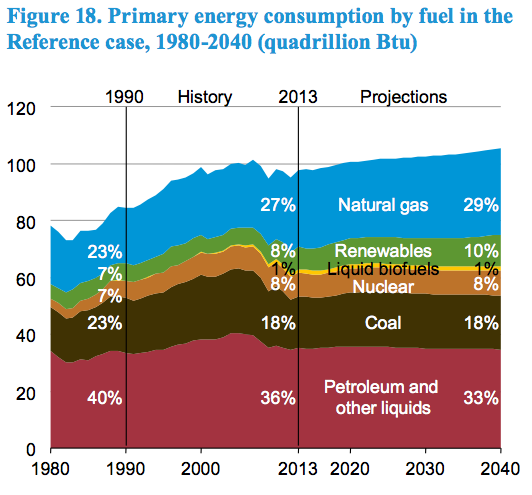
Total primary energy consumption grows in the AEO2015 Reference case by 8.6 quadrillion Btu (8.9%), from 97.1 quadrillion Btu in 2013 to 105.7 quadrillion Btu in 2040 (Figure 18).
data available here
web chapter here
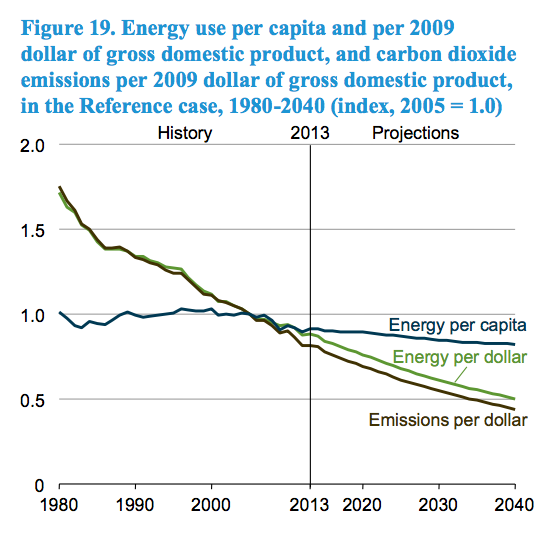
Energy intensity (measured both by energy use per capita and by energy use per dollar of GDP) declines in the AEO2015 Reference case over the projection period (Figure 19).
data available here
web chapter here
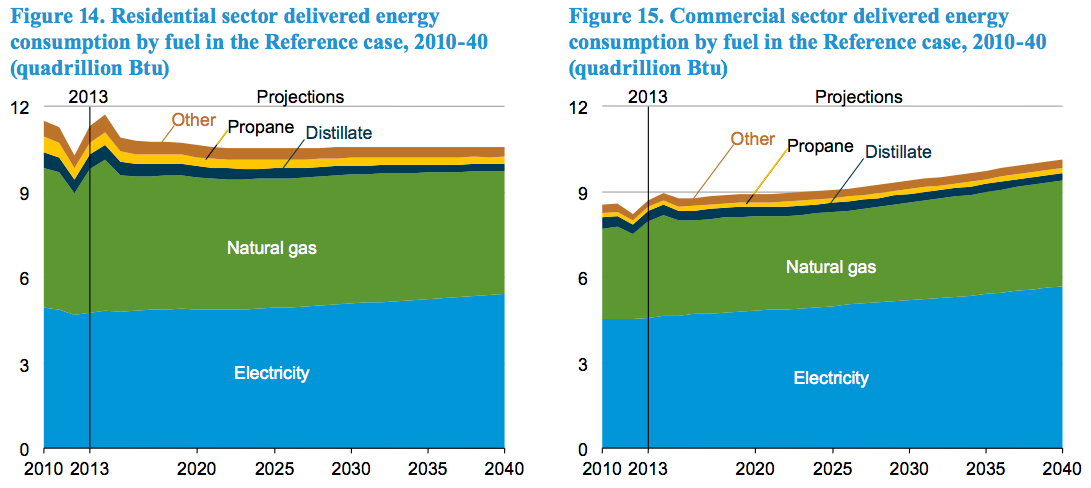
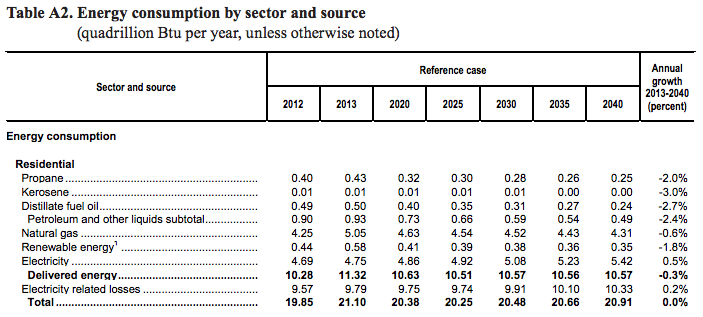
Delivered energy consumption decreases at an average rate of 0.3%/year in the residential sector and grows by 0.6%/year in the commercial sector from 2013 through 2040 in the AEO2015 Reference case (Figure 14 and Figure 15). Over the same period, the total number of households grows by 0.8%/year, and commercial floorspace increases by 1.0%/year (Table 4).
data available here and here
web chapter here
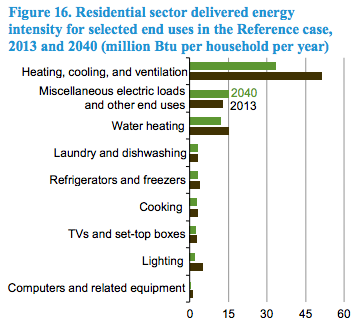
End-use energy intensity, as measured by consumption per residential household or square foot of commercial floorspace, decreases in the Reference case as a result of increases in the efficiency of equipment for many end uses (Figure 16 and Figure 17). Federal standards and voluntary market transformation programs (e.g., Energy Star) target uses such as space heating and cooling, water heating, lighting, and refrigeration, as well as devices that are rapidly proliferating, such as set-top boxes and external power supplies.
data available here
web chapter here
Src:
U.S. Energy Information Administration. April 2015. “The Annual Energy Outlook 2015.” DOE/EIA-0383(2015)
Contacts
Director: John J. Conti john.conti@eia.gov
General questions: Paul Holtberg paul.holtberg@eia.gov
[more contacts listed in the report TOC]
*
World Energy Council
The World Energy Council (WEC) is the UN-accredited global energy body comprised by more than 3000 member organizations drawn from governments, private and state corporations, academia, NGOs and energy-related stakeholders. WEC publishes many recurring reports, but in 2013 it released a set of projections to 2050.
The report focuses on two scenarios: a more consumer-driven scenario (called “Jazz”), and a more voter-driven scenario (called “Symphony”). Jazz has a focus on energy equity with priority given to achieving individual access and affordability of energy through economic growth. Symphony has a focus on achieving environmental sustainability through internationally coordinated policies and practices.
| Primary Energy Mix, 2010 and 2050 (Jazz and Symphony) | |||
| 2010 | 2050 Jazz | 2050 Symphony | |
| Fossil fuels (coal, oil, gas) | 79% | 77% | 59% |
| Renewables | 15% | 20% | 30% |
| Nuclear | 6% | 4% | 11% |
| World Energy Council Jazz and Symphony Projections for North America, 2010-2040 | |||||||||
| 2010 | 2020 | 2030 | 2040 | 2050 | 2020 | 2030 | 2040 | 2050 | |
| Total Primary Energy Supply (EJ/y) | 116 | 128 | 135 | 136 | 130 | 118 | 114 | 108 | 105 |
| Total Electricity Generation (TWh/y) | 5,214 | 6,152 | 6,903 | 7,728 | 8,024 | 6,100 | 6,733 | 7,695 | 8,057 |
| Carbon Price (US$2010/tCO2) | 8 | 15 | 21 | 28 | 21 | 28 | 55 | 70 | |
| CO2 – Emissions (GtCO2/y) | 6.5 | 7.2 | 7.3 | 7.2 | 6.7 | 6.2 | 5.4 | 4.4 | 3.1 |
| Carbon Capture, Use And Storage (GtCO2/y) | 0.0 | 0.0 | 0.0 | 0.1 | 0.2 | 0.0 | 0.1 | 0.3 | 1.1 |
10 Key Messages
- Energy system complexity will increase by 2050.
- Energy efficiency is crucial in dealing with demand outstripping supply.
- The energy mix in 2050 will mainly be fossil based.
- Regional priorities differ: there is no ‘one-size-fits-all’ solution to the energy trilemma.
- The global economy will be challenged to meet the 450ppm target without unacceptable carbon prices.
- A low-carbon future is not only linked to renewables: carbon capture, utilisation and storage (CC(U)S) is important and consumer behaviour needs changing.
- CC(U)S technology, solar energy and energy storage are the key uncertainties up to 2050.
- Balancing the energy trilemma means making difficult choices.
- Functioning energy markets require investments and regional integration to deliver benefits to all consumers.
- Energy policy should ensure that energy and carbon markets deliver.
Scenarios are alternative views of the future which can be used to explore the implications of different sets of assumptions and to determine the degree of robustness of possible future developments. While most widely known scenarios are normative, the WEC has adopted a different, exploratory approach. ‘Normative’ in this context means that the scenarios are being used to drive the world towards a specific objective such as a particular atmospheric CO2 level. In contrast, the WEC with its exploratory scenarios Jazz and Symphony, attempts to provide decision makers with a neutral fact-based tool that they will be able to use to measure the potential impact of their choices in the future.
This approach can only be done successfully by a network like the WEC’s with its impartial and inclusive membership structure. Over 60 experts from more than 28 countries have contributed to the WEC’s scenario building process over a period of three years.
Src:
World Energy Council. 2013. “World Energy Scenarios: Composing Energy Futures to 2050”
*
BP
BP produces a 20-year forecast based on a single, most-likely growth trajectory.
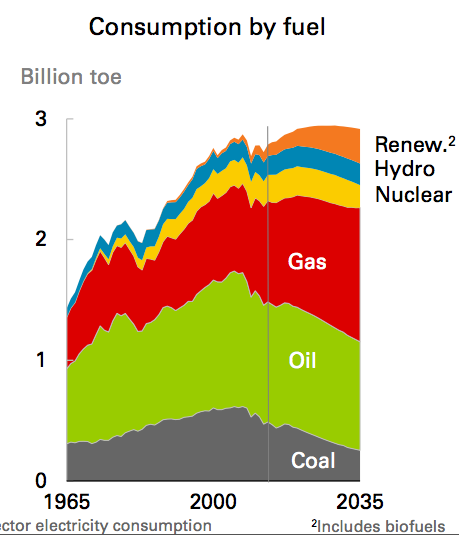
Oil consumption declines 0.5% p.a. over the Outlook as a result of falling demand in the transport sector. Coal declines by 2.9% p.a., driven by more aggressive environmental policies and competitively priced natural gas. Nuclear (-0.6% p.a.) demand also declines over the Outlook. Natural gas is the only fossil fuel to grow over the Outlook (1.3% p.a.). Renewables are the fastest growing group of fuels, increasing by 5.1% p.a.. Hydro-electric power increases 0.6% p.a., faster than total energy demand.
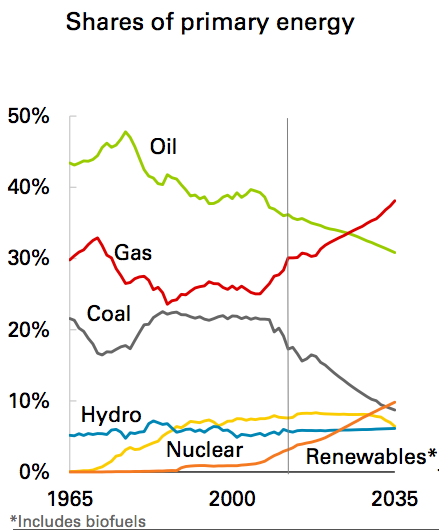
Shares of fossil fuels in the energy mix decline from 83% today to 78% by 2035. Shares of renewables (including biofuels) increase from 3% in 2013 to 10% in 2035, while hydro remains stable throughout the Outlook at 6% and nuclear remains near 8% until losing market share in the last few years of the Outlook. Shares of natural gas grow from 30% in 2013 to 37% in 2035, overtaking oil as the leading fuel around 2025. More than half of the increase in energy demand from 2013-2035 is met by natural gas. Oil’s market share declines throughout the Outlook, reaching just 31% by 2035, the lowest share on record and down from a high of 48% in 1977. Coal’s share drops to just 9%, also the lowest on record. Renewables overtake coal as the third largest fuel by market share by the end of the Outlook.
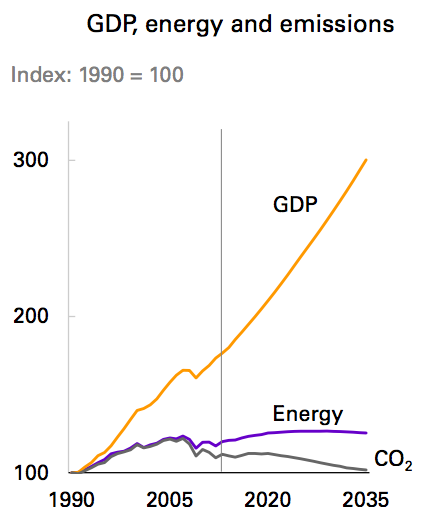
Continuing declines in energy intensity – the broadest indicator of improving energy efficiency across the economy – leads to a marked widening in the gap between GDP and energy consumption. Energy intensity declines by 39% by 2035 (-2.2% p.a.). Total carbon emissions from energy consumption decrease by 9% between 2013 and 2035 (-0.4% p.a.), with the rate of decline speeding up in the last half of the outlook, (-0.7% p.a. from 2025 to 2035).
Src:
BP. February 2015. “Energy Outlook 2035: Focus on North America.”
Excel tables (49.8KB)
Country Insights: US
*
The International Renewable Energy Agency
The International Renewable Energy Agency (IRENA) is an intergovernmental organisation that supports countries in their transition to a sustainable energy future, and serves as the principal platform for international co-operation, a centre of excellence, and a repository of policy, technology, resource and financial knowledge on renewable energy. As of December 2015, there are 144 member states, including the US.
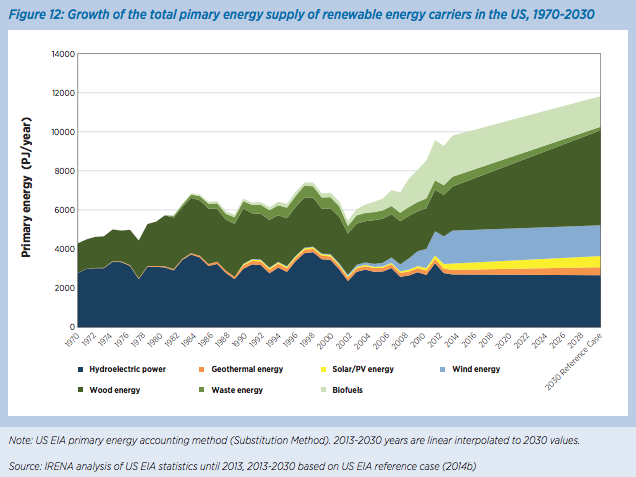
The following excerpts come from a report on renewable energy sources and consumption in the US. Although the report focuses on the potential to dramatically increase renewable energy, the excerpts here highlight it’s projections for conservative, or business as usual, usage of renewables. The data in their report is from the US Energy Information Agency.
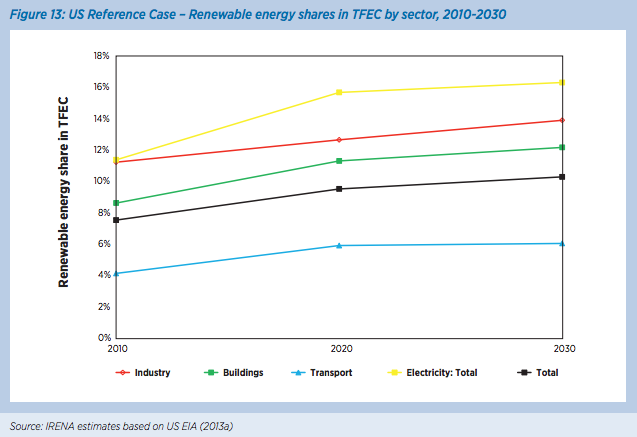
In 2010, the US was the second largest energy consumer in the world with a total final energy consumption (TFEC) of 64 exajoules (EJ), equivalent to 19% of the global TFEC (IEA, 2013a). The US TFEC is projected to remain stable in the period between 2010 and 2030 growing by only 4% according to US Energy Information Agency‘s Annual Energy Outlook (AEO) (US EIA, 2013a). In the same time period, based on current policies or the Reference Case according to this study, the US share of renewable energy in the TFEC will only grow from 7.5% in 2010 to 10% in 2030, driven mostly by an increase in renewable power generation.
The Reference Case for the US was based on the U.S. Energy Information Agency’s “Annual Energy Outlook 2013”
Renewable energy share in TFEC of the US stood at 7.5% in 2010 (the base year of REmap 2030 analysis). This included 2.4% renewable power, 1.6% liquid biofuels and the remainder (3.4%) largely solid biomass in industry and building heating.
Src:
IRENA. 2015. “Renewable Energy Prospects: United States of America, REmap 2030 analysis.”
2030 Injury Scenarios
Quantitative injury rate forecasts have been somewhat scarce (short of Pardee’s long-range fatality forecasts to 2100). During the search, I came across the previously mentioned Institute for Alternative Futures’ Public Health Scenarios 2030. Here’s expected scenario from their “Injury Prevention Driver Forecasts”:
- Technological innovations in design and monitoring – and decreased public tolerance – reduce unintentional injury rates for certain types of injuries
- Rates of violence continue to be closely tied to poverty, race, education, and geography
- Some innovative programs prove successful locally but are leadership-dependent and unsustainable
- Injury-related fatalities decrease but injury-related costs – including long-term care and benefits – rise due to inadequate focus on primary prevention
- Political and cultural opposition to a population-based approach hinders the most effective local policies from being embraced on a nationwide level
Src: “Injury Prevention Driver Forecasts.” 2014. Institute for Alternative Futures.
China, Ethiopia Traffic Fatality Forecasts
Came across these papers while looking for US injury forecasts.
Haimanot Gebrehiwot Moges and Solomon Meseret Woldeyohannes. 2014. “Trends and Projections of Vehicle Crash Related Fatalities and Injuries in Northwest Gondar, Ethiopia: A Time Series Analysis.”International Journal of Environmental Health Engineering 3 (1): 30. doi:10.4103/2277-9183.139752.
Aichun Tan, Danping Tian, Yuanxiu Huang, Lin Gao, Xin Deng, Li Li, Qiong He, Tianmu Chen, Guoqing Hu, and Jing Wu. 2014. “[Forecast the trend of burden from fatal road traffic injuries between 2015 and 2030 in China].” Zhonghua Liu Xing Bing Xue Za Zhi = Zhonghua Liuxingbingxue Zazhi 35 (5): 547–51.http://www.ncbi.nlm.nih.gov/pubmed/25059365.
Public Health Scenarios 2030
I’ve been looking for illness-related forecasts and historic statistics for the last couple days. After looking through so much quantitative data (my roundup is here), it’s interesting to finish out the research with a look at some scenarios.
The Institute for Alternative Futures (co-founded by Alvin Toffler in 1977), has a series called Public Health 2030. The “Chronic Disease Driver Forecasts” is of particular interest.
Excerpt:
Forecast Summaries
Expectable: Chronic disease epidemic continues its upward trajectory
• Tobacco use and cancer incidence rates drop
• Aging yields higher rates of dementia and prostate and breast cancer
• Highest-risk populations cannot access new treatments for chronic disease
• Behavioral health programs show varied success/failure rates
• Primary prevention efforts are met by various obstacles, including legal and public relations battles
• About 48 percent (171 million) of U.S. residents live with one or more chronic conditions, i.e., 2% or
30 million people more since 2010
• National health spending accounts for 22 percent of GDP (compared to 18 percent in 2010)Challenging: Chronic disease epidemic escalates
• Improved access to care leads to substantial increase in diagnosed chronic diseases. Widespread
provider shortages and inconsistent quality of self-management support fail to effectively control
and prevent chronic disease
• A major economic downturn worsens psychological and behavioral health; smoking, obesity, heart
disease, cancers, and diabetes become more prevalent among both youth and elders
• Health disparities increase and low-income and minority groups are blamed for their health
problems and scapegoated for overburdening the health care system
• Some communities experience successes in improving behavioral and community health, but most
struggle to replicate this success
• Over half the U.S. population lives with one or more chronic conditions, and all states have obesity
rates above 50 percent
• Cuts in Medicare and Medicaid reduce health spending to 17 percent of GDP as many in the U.S.
forego careAspirational: Widespread conquering and prevention of chronic disease
• Communities address social determinants of health, prevention, and behavioral health; Community
Centered Health Homes are prominent
• Accountable Care Communities (ACCs) expand on the idea of the Accountable Care Organization
(ACO) to coordinate across a range of sectors, including employment, housing, transportation, and
education
• “My code is your code”: apps are tailored and reworked to engage the public in promoting personal
and community wellbeing among neighbors and localities; widespread use of personalized health
informatics, games, and digital agents to assess and change behavior
• People and groups increasingly advocate for healthier community environments
• Less than 40 percent of the U.S. population is living with one or more chronic conditions
Src: “Chronic Disease Driver Forecasts.” 2014. Institute for Alternative Futures.
Sick Days and Chronic Illness
I consulted a few different sources of information for illness statistics. The Bureau of Labor Statistics has a very small sample of sick-leave used data (for 2009). Gallup and Healthways also have a small sample of sick-leave data (for 2012). No forecasts are available. Several think tanks are tracking reported rates of chronic illness. A couple forecasts are available. Results are summarized below.
Sick Days
In 2012, researchers from the Bureau of Labor Statistics conducted a one-time tabulation of sick leave provision and usage. The data used were compiled from the 2009 National Compensation Survey, looking only at full-time workers in private industry.
The researchers averaged the amount of sick leave used in each of 6 industry areas (financial activities; information industry; trade, transportation, and utilities; professional and business services; leisure and hospitality; construction). In the first four of those industries, workers used an average of 4 days of sick leave per year. In the last two industries (leisure and hospitality, and construction), workers used an average of 2 days of sick leave per year.
This was a one-time tabulation. Jason Ford says by email that he’s not aware of any forecasts. To his knowledge, additional years of this data are not available.
Src:
Ross O. Barthold, Jason L. Ford. 2012 February 29. “Paid Sick Leave: Prevalence, Provision, and Usage among Full-Time Workers in Private Industry.” Bureau of Labor Statistics.
*
2012 survey data of workers in 14 job categories found that usage of sick days ranged from 6 days per year to 3 days per year. The survey was conducted by Gallup and Healthways as part of Healthways’ annual Well-Being Index report. The survey was administered to 94,000 Americans who work at least 30 hours per week.
Days missed per month
Physicians: .24
Farmers, Foresters, Fishers: .25
Construction or Mining: .28
Installation/Repair: .35
Sales: .35
Managers/Executives: .36
Professionals: .37
Manufacturing/Production: .38
School Teacher: .39
Transportation: .40
Business Owners: .41
Nurses: .43
Clerical or Office Workers: .44
Service Workers: .47
Note: 24/7 Wall St. performed the analysis of data collected by Gallup-Healthways. Emailed Healthways (9/25) to see if they’re still collecting this data.
Src:
Michael B. Sauter, Samuel Weigley and Alexander E.M. Hess. 2013 May 9. “Workers Taking the Most Sick Days.” 24/7 Wall St.
Well-Being Index
Gallup and Healthways have compiled their Well-Being Index annually since 2008. It’s a “barometer of Americans’ perceptions of their well-being.” The index is compiled based on survey responses to questions about six areas of life: life evaluation, emotional health, work environment, physical health, healthy behavior, basic access.
Physical Health Index
2008 76.9
2009 76.6
2010 76.9
2011 76.7
2012 77.0
2013 76.4
The Physical Health Index is comprised of questions related to: Body Mass Index, disease burden, sick days, physical pain, daily energy, history of disease, and daily health experiences.
Overall Well-Being Score
2008 66.5
2009 66.3
2010 66.8
2011 66.2
2012 66.7
2013 66.2
Over the six years of our well-being measurement, Americans’ life evaluations have improved, emotional health and healthy behaviors have remained stable, and basic access, physical health, and work environment have declined. While there are dozens of trends that have impacted the national score since 2008, the three most prominent ones are:
* Annual decreases in the rate of those with health insurance;
* Rising rates of obesity;
* Declining work environment scores.
Src:
Gallup-Healthways Well-Being Index. 2014. “State of American Well-Being.”
Chronic Disease Rates
In 2008, The Milken Institute found that one third of Americans reported having at least one of seven common chronic diseases, with a total of 162.2 million cases in 2003. They forecasted a 42% increase in cases of those diseases by 2023, for a total of 230.7 million cases.
Of the seven chronic diseases, pulmonary conditions were the most common, with 49.2 million cases recorded. Next in prevalence were hypertension, with 36.8 million recorded cases, and mental disorders, with 30.3 million; followed by heart disease at 19.2 million; diabetes at 13.7 million; cancer at 10.6 million; and stroke at 2.4 million.
Src:
Ross DeVol, Armen Bedroussian. 2007. “An Unhealthy America: The Economic Burden of Chronic Disease.” Milken Institute.
*
In 2009, almost half of Americans, 145 million people, had at least one chronic condition. This represented an increase of 10 million people over the estimate that was made in 2002 for the year 2009.
The number of people with chronic conditions reached 125 million in 2000, forecast to reach 147 million by 2010 and 157 million by 2020. By 2030 half the population will have one or more chronic conditions.
Src:
2010. “Chronic Care: Making the Case for Ongoing Care.” Robert Wood Johnson Foundation.
*
Prevalence of Chronic Disease in the U.S. Population
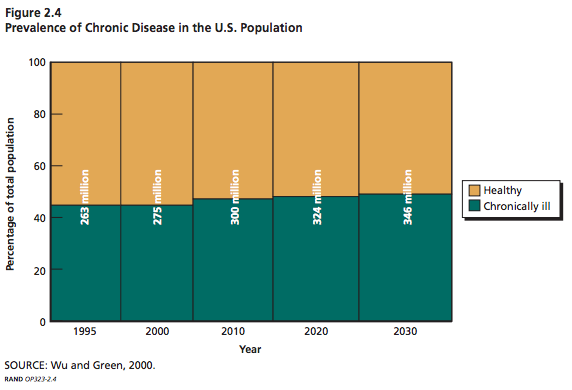
Millions of Americans
Src: Wu, Shin-Yi and Anthony Green. Projection of Chronic Illness Prevalence and Cost Inflation. RAND Corporation; October 2000. (unavailable online)
Cited in:
Soeren Mattke, Lisa Klautzer, Tewodaj Mengistu, et al. 2010. “Health and Well-Being in the Home.” RAND Corporation.
and
The Marshall Protocol Knowledge Base. 2012. “Incidence and Prevalence of Chronic Disease.” Autoimmunity Research Foundation.
Per Capita Rx Usage
Current data
Evaluate and IMS Health both track current and recent rates of drug prescription per capita.
From Evaluate:
2011: 10
2013: 9
src: 2013. Evaluate. Medical Expenditure Panel Survey. Spreadsheet shared by email, 2015 Sep 10.
From IMS Health:
2010: 11.46
2011: 11.33
2013: 12.2
2014: 2.1% more than 2013
Src (2010, 2011): 2012. IMS Institute for Healthcare Informatics. “The Use of Medicines in the United States: Review of 2011.″
Src (2013): 2014. IMS Institute for Healthcare Informatics. “Medicine use and shifting costs of healthcare: A review of the use of medicines in the United States in 2013.″
Src (2014): 2015. IMS Institute for Healthcare Informatics. “Medicines Use and Spending Shifts: A Review of the Use of Medicines in the U.S. in 2014.″
Michael Kleinrock, of IMS, explains via email that Rx usage rates have been very consistent for a very long time. Their data goes back to the early 90s, but the collection of age-band data is a relatively recent addition. They haven’t yet produced harmonized figures showing all of their historic data.
Forecast data
In 2008, a paper published by the Department of Health and Human Services gave forecasts for prescriptions dispensed per visit to the year 2030. Three forecasts were made for prescriptions per physician office visit, per hospital/clinic outpatient visit, and per emergency visit. The forecasts are divided into age bands for patients aged 0-44, 45 to 64, and 65 years and older. The forecasts are all based on analysis of the CDC’s National Ambulatory Medical Care Survey (NAMCS) from 1995 to 2004, with trend extrapolation from 2005 to 2030.
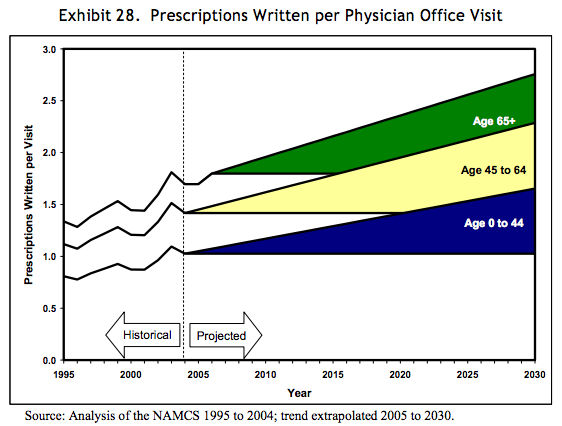
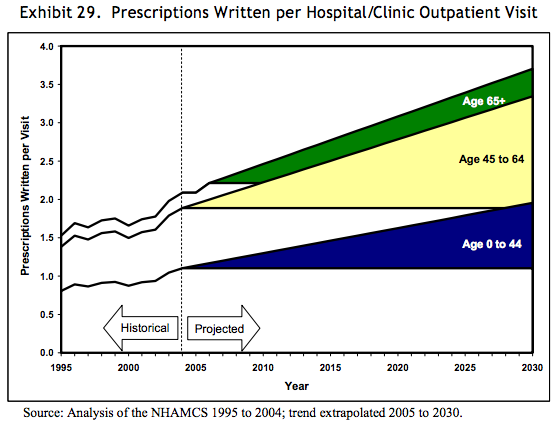

Src: 2008. Department of Health and Human Services. “The Adequacy of Pharmacist Supply: 2004 to 2030.” Exhibits 28-30, pp 31, 32.
Klaus Æ. Mogensen’s Media Predictions
In 2013, Klaus Æ. Mogensen made a set of media predictions and scenarios to 2030. The details of the scenarios are being a publication paywall, but the predictions are accessible as part of a preview. Here is a summary of his predictions:
More of…
bigger screens with better resolution and color (16k-32k screens)
content (more in public domain, more self-published, more new free)
bandwidth availability, usage, and requirements
variety of devices (very small and very big)
subscription streams will continue to replace ownership of individual works
collaborative creation of content
Less of…
printed mass media
physical access points for digital content (brick-and-mortar rental/purchase points)
digital content on physical media
slow, rigid distribution systems (eg: traditional publishers)
Possibly…
micro-implants enabling thought-based user interfaces and feedback (eg: augmented reality)
screens that be folded or rolled
holographic displays
Source: Mogensen, Klaus Æ. September 24, 2013. “The Media World 2013.” Scenario, 5
