

Prevalence of Tattoos
Statistics on tattoo prevalence are quite thin, and I have not found a source for systematic, historic data. I’ve found no forecasts.
1936 – 10 million Americans, 6% of population had at least one tattoo*
(Life Magazine)
2000 – 15%, ~40 million Americans**
(National Geographic News, April 2000)
2002 – 13% (1/8) of Americans
(Esquire Magazine, March 2002)
2004 – 24% of Americans
(Laumann and Derick, 2006)
2003 – 16%
2008 – 14%
2012 – 21%
(Harris Polls)
2010 – 23%
(Pew Research, Febrary 2010)
*Haven’t been able to find this figure in the 1936 Life Magazine, but they did publish an estimate of 1/10th of Americans being tattooed. Source below. Via The Vanishing Tattoo
**Unable to find this figure, although I searched the April 2000 issue of National Geographic Magazine. Via The Vanishing Tattoo
Original sources
Life, December 21, 1936. “One Out of Ten Americans is Tattooed.” P.30.
Anne Laumann, Amy Derick. 2006. “Tattoos and body piercings in the United States: A national data set.” Journal of American Academy of Dermatology, 55(3).
Pew Research Center. February 2010. “Millennials: A Portrait of Generation next.”
The Harris Poll. February 23, 2012. “One in Five U.S. Adults Now Has a Tattoo.”
Plastic Surgery
There are at least two professional organizations that publish plastic surgery statistics: American Society of Plastic Surgeons (ASPS), and The American Society for Aesthetic Plastic Surgery (ASAPS). Figures from the latter tend to be a bit lower than the former. Seeking clarification on the discrepancy. Procedures are typically broken down into two major categories: cosmetic and reconstructive. All readily available figures from ASPS are below (2005-2014). Awaiting to hear if pre-2005 figures are also available from ASPS.
Google Sheet (with links to individual reports)
Src:
American Society of Plastic Surgeons, 2006-2015
Alternate lead:
The American Society for Aesthetic Plastic Surgery, 1997-2014 Statistics
Refractive Surgery
Summary
Refractive surgery (corrective eye surgery) includes PRK, LASIK, and SMILE procedures, among others.
Market Scope is a research firm that collects data on LASIK procedure rates, and seems to be the primary (if not the only) source for such data. I’ve found an 18-year dataset, 1996-2014 (the last two-years of which were forecast). I’ve contacted Market Scope to inquire if they have long-term forecasts as well.
No US forecasts obtained yet. The best academic paper addressing refractive surgery forecasts (in China) suggests that procedure rates are fairly stable in the US.
Research Excerpts
As of 2011, more than 11 million LASIK procedures had been performed in the United States.
Src:
Dan Lindfield and Tom Poole. 2013 February. “Nd:YAG Treatment of Epithelial Ingrowth.” Cataract & Refractive Surgery Today Europe.
Citing Market Scope.
*
Number of LASIK (laser-assisted in situ keratomileusis) surgeries in the United States from 1996 to 2014 (in 1,000s).
Src:
Market Scope via Statista
(source inferred via other sources quoting the same numbers and attributing to Market Scope. Statista hides their name behind a paywall)
*
In 2012 U.S. procedure volumes were approximately 700,000 procedures per year. The average price point of $1500 per eye in the United States factors to a total U.S. market size of $1.05 Billion / Year.
The model for potential market growth is based on the observation that the laser refractive surgery market in the United States demonstrated saturation at approximately 2.7% penetration, and showed a baseline volume at approximately 1.2% penetration. In this context, market penetration is defined as annual procedure volume compared to the potential candidate pool.
Potential U.S. Candidate Pool = Overall Population (310 Million People)
x Patients in Treatable Age Group of 18 to 45 Years (36.5%)
x Patients with Treatable Refractive Errors (50%)
x Patients with Adequate Disposable Income (50%)
EQUATION 1: General estimate of United States candidate pool for laser refractive surgery. The result calculates to 28.3 million people.
Laser refractive surgery volumes in the United States grew steadily to peak in 2000 at about 1.5 million procedures (eyes). Volume declined during the economic downturn that began in Q4 2001 and rebounded slightly from 2003 through 2007. The U.S. market has not recovered following the macroeconomic downturn of 2008. It stood at approximately 700,000 procedures in 2012. [Citing Market Scope figures given above.]
Src:
Guy Kezirian, et al. 2013. “Forecast of Laser Refractive Surgery in China: 2013-2023.” Northwestern University Kellogg School of Management. Pages i, iii, Figure 1.
Dr. Kezirian (info@surgivision.net) is a board certified and sub-specialty trained ophthalmologist. His company has run several FDA studies for excimer laser approvals. He is an industry consultant in ophthalmology through his company, SurgiVision Consultants.
Email inquiry sent 10/9 seeking recent figures and U.S. forecasts.
*
Ron Krueger, MD, of the Cleveland Clinic in Cleveland, Ohio, discusses his forecast for the future of LASIK procedures.
LASIK will probably be replaced by something else in the next 10 years due to flap complications, biomechanical concerns, dry eye concerns.
SMILE procedure (or something like it) will probably replace it.
Src:
Mark Kontos and Ron Krueger. 2014. “Will LASIK Still Be Kind in 2025?” Aspen 2014. American-European Congress of Ophthalmic Surgery. Eyetube.net.
*
Professional Organizations (inquiries sent 10/13)
American-European Congress of Ophthalmic Surgery
contact form
American Society of Cataract and Refractive Surgery
media inquiries form
Outpatient Ophthalmic Surgery Society
Kent L. Jackson, Executive Director, kjackson@ooss.org
American Academy of Ophthalmology
media@aao.org
Update
Trudy Larkins, Executive Direction of AECOS, says:
I think Dave Harmon and Bill Freeman of MarketScope are your best resources.
Since these procedures are elective (i.e. not covered by any type of medical insurance), figures have historically been “best estimates.”
Toric IOLs are extremely popular and perhaps the most widely used. The patient pays out of pocket and the surgeon is able to significantly reduce the amount of pre-op as well as post-op (surgically induced) astigmatism.
We had hoped that having LASIK would become as anticipated as getting braces on your teeth. Unfortunately, this did not happen and some bad PR apparently resonated much more than we anticipated.
I would suggest that you contact someone from the American Refractive Surgery Council. AECOS is an Advisor to this group which is made up of industry as well as refractive surgery physicians. I do know that Richard Lindstrom MD, Eric Donnenfeld MD and Kerry Solomon MD are all very actively involved in this organization and would be great to interview.
CC emailed Dave Harmon at Market Scope directly (10/16/15)
Injuries Data
Current injuries data is collected by two federal agencies, the Centers For Disease Control, and the Bureau for Labor Statistics. The CDCs data describes overall injury rates (fatal and nonfatal) going back to 2002. BLS’s data describes work-related injury and illness rates (fatal and nonfatal) going back to 1992 (only 2003 for nonfatal incidents).
The Pardee Center for International Futures produces the most long-ranging forecasts for injury- and illness-related fatalities that I’ve found so far. (As far as I can tell, their forecasts do not included non-fatal incidents.) I’ve taken samples of their data from the top of the decade through 2050, but annual data are available from 2010 through 2100.
Data from all three sources (CDC, BLS, and Pardee) are aggregated in this Google Spreadsheet:
This graphic from a 2011 Pardee paper shows the general trend in fatalities due to injuries versus disease:

Src: Barry B. Hughes, Randall Kuhn, Cecilia M. Peterson, et al. 2011. “Projections of global health outcomes from 2005 to 2060 using the International Futures integrated forecasting model.” Bulletin of the World Health Organization.
Sick Days and Chronic Illness
I consulted a few different sources of information for illness statistics. The Bureau of Labor Statistics has a very small sample of sick-leave used data (for 2009). Gallup and Healthways also have a small sample of sick-leave data (for 2012). No forecasts are available. Several think tanks are tracking reported rates of chronic illness. A couple forecasts are available. Results are summarized below.
Sick Days
In 2012, researchers from the Bureau of Labor Statistics conducted a one-time tabulation of sick leave provision and usage. The data used were compiled from the 2009 National Compensation Survey, looking only at full-time workers in private industry.
The researchers averaged the amount of sick leave used in each of 6 industry areas (financial activities; information industry; trade, transportation, and utilities; professional and business services; leisure and hospitality; construction). In the first four of those industries, workers used an average of 4 days of sick leave per year. In the last two industries (leisure and hospitality, and construction), workers used an average of 2 days of sick leave per year.
This was a one-time tabulation. Jason Ford says by email that he’s not aware of any forecasts. To his knowledge, additional years of this data are not available.
Src:
Ross O. Barthold, Jason L. Ford. 2012 February 29. “Paid Sick Leave: Prevalence, Provision, and Usage among Full-Time Workers in Private Industry.” Bureau of Labor Statistics.
*
2012 survey data of workers in 14 job categories found that usage of sick days ranged from 6 days per year to 3 days per year. The survey was conducted by Gallup and Healthways as part of Healthways’ annual Well-Being Index report. The survey was administered to 94,000 Americans who work at least 30 hours per week.
Days missed per month
Physicians: .24
Farmers, Foresters, Fishers: .25
Construction or Mining: .28
Installation/Repair: .35
Sales: .35
Managers/Executives: .36
Professionals: .37
Manufacturing/Production: .38
School Teacher: .39
Transportation: .40
Business Owners: .41
Nurses: .43
Clerical or Office Workers: .44
Service Workers: .47
Note: 24/7 Wall St. performed the analysis of data collected by Gallup-Healthways. Emailed Healthways (9/25) to see if they’re still collecting this data.
Src:
Michael B. Sauter, Samuel Weigley and Alexander E.M. Hess. 2013 May 9. “Workers Taking the Most Sick Days.” 24/7 Wall St.
Well-Being Index
Gallup and Healthways have compiled their Well-Being Index annually since 2008. It’s a “barometer of Americans’ perceptions of their well-being.” The index is compiled based on survey responses to questions about six areas of life: life evaluation, emotional health, work environment, physical health, healthy behavior, basic access.
Physical Health Index
2008 76.9
2009 76.6
2010 76.9
2011 76.7
2012 77.0
2013 76.4
The Physical Health Index is comprised of questions related to: Body Mass Index, disease burden, sick days, physical pain, daily energy, history of disease, and daily health experiences.
Overall Well-Being Score
2008 66.5
2009 66.3
2010 66.8
2011 66.2
2012 66.7
2013 66.2
Over the six years of our well-being measurement, Americans’ life evaluations have improved, emotional health and healthy behaviors have remained stable, and basic access, physical health, and work environment have declined. While there are dozens of trends that have impacted the national score since 2008, the three most prominent ones are:
* Annual decreases in the rate of those with health insurance;
* Rising rates of obesity;
* Declining work environment scores.
Src:
Gallup-Healthways Well-Being Index. 2014. “State of American Well-Being.”
Chronic Disease Rates
In 2008, The Milken Institute found that one third of Americans reported having at least one of seven common chronic diseases, with a total of 162.2 million cases in 2003. They forecasted a 42% increase in cases of those diseases by 2023, for a total of 230.7 million cases.
Of the seven chronic diseases, pulmonary conditions were the most common, with 49.2 million cases recorded. Next in prevalence were hypertension, with 36.8 million recorded cases, and mental disorders, with 30.3 million; followed by heart disease at 19.2 million; diabetes at 13.7 million; cancer at 10.6 million; and stroke at 2.4 million.
Src:
Ross DeVol, Armen Bedroussian. 2007. “An Unhealthy America: The Economic Burden of Chronic Disease.” Milken Institute.
*
In 2009, almost half of Americans, 145 million people, had at least one chronic condition. This represented an increase of 10 million people over the estimate that was made in 2002 for the year 2009.
The number of people with chronic conditions reached 125 million in 2000, forecast to reach 147 million by 2010 and 157 million by 2020. By 2030 half the population will have one or more chronic conditions.
Src:
2010. “Chronic Care: Making the Case for Ongoing Care.” Robert Wood Johnson Foundation.
*
Prevalence of Chronic Disease in the U.S. Population
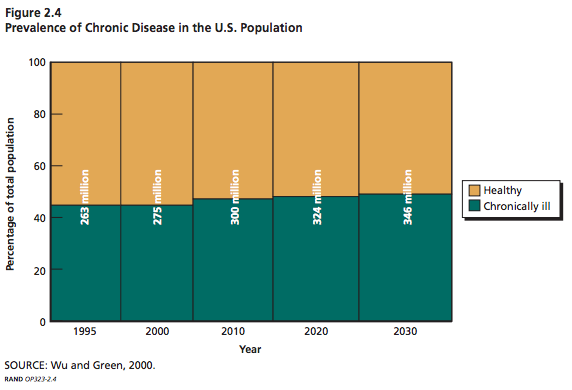
Millions of Americans
Src: Wu, Shin-Yi and Anthony Green. Projection of Chronic Illness Prevalence and Cost Inflation. RAND Corporation; October 2000. (unavailable online)
Cited in:
Soeren Mattke, Lisa Klautzer, Tewodaj Mengistu, et al. 2010. “Health and Well-Being in the Home.” RAND Corporation.
and
The Marshall Protocol Knowledge Base. 2012. “Incidence and Prevalence of Chronic Disease.” Autoimmunity Research Foundation.
Supplement Usage Prevalence
Usage Trends
The CDC tracks U.S. dietary supplement usage (which includes multivitamins and multiminerals) via its National Health and Nutrition Examination Survey (NHANES), which began in the 1970s. In 2011, the CDC said over half of U.S. adults were taking dietary supplements.
Overall usage trend:
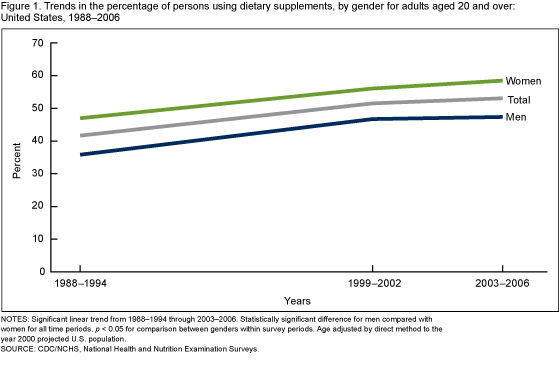
Usage prevalence percentages for adults over 20:
| Year | Men | Women |
| 1971-1975 | 28% | 38% |
| 1976-1980 | 32% | 43% |
| 1988-1994 | 35% | 44% |
| 1999-2000 | 47% | 56% |
| 2003-2006 | 47% | 59% |
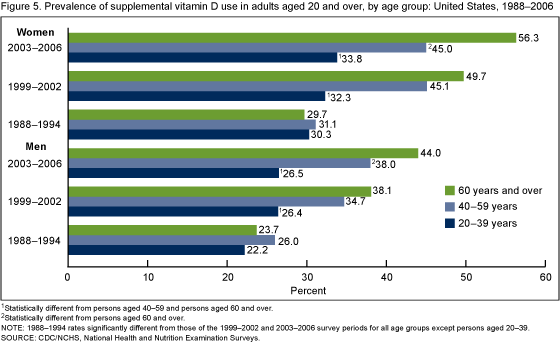
Vitamin D use by age group and gender:
Srcs:
Gahche J, Bailey R, Burt V, et al. 2011. “Dietary Supplement Use Among U.S. Adults Has Increased Since NHANES III (1988–1994).” NCHS data brief, no 61. Hyattsville, MD: National Center for Health Statistics.
Madison Park. 2011 April 13. “Half of Americans Use Supplements.” CNN.
Market Research
Euromonitor tracks the vitamins and dietary supplements (VDS) market. In 2013, they estimated that the market would grow at a CAGR of 4% between 2013 and 2018 to reach $112 billion in 2018.
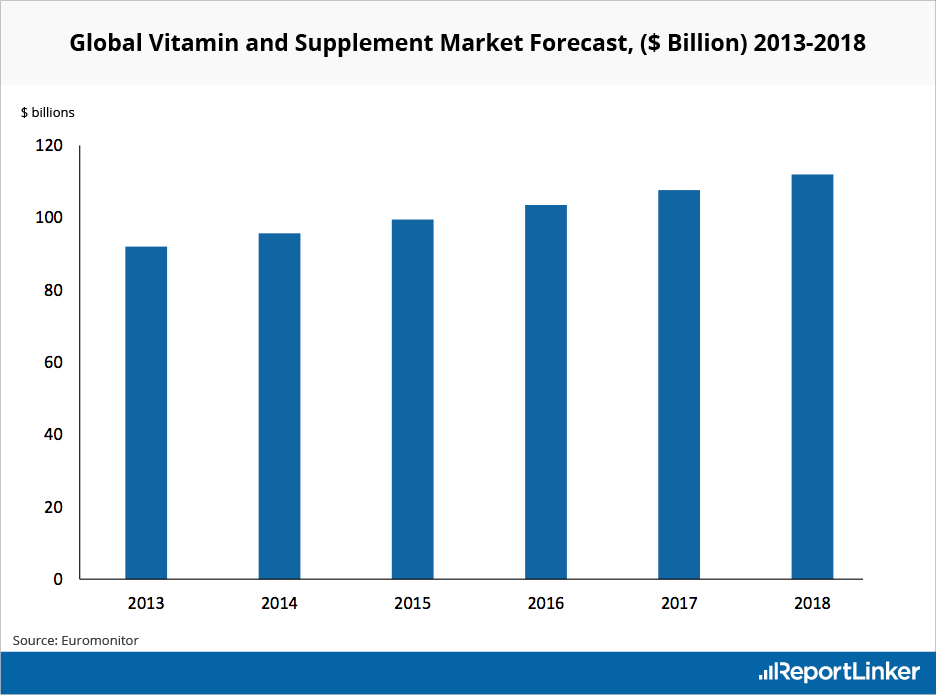
Src:
Euromonitor (via Reportlinker). 2013. “Global Vitamin and Supplement Industry Overview.”
Per Capita Rx Usage
Current data
Evaluate and IMS Health both track current and recent rates of drug prescription per capita.
From Evaluate:
2011: 10
2013: 9
src: 2013. Evaluate. Medical Expenditure Panel Survey. Spreadsheet shared by email, 2015 Sep 10.
From IMS Health:
2010: 11.46
2011: 11.33
2013: 12.2
2014: 2.1% more than 2013
Src (2010, 2011): 2012. IMS Institute for Healthcare Informatics. “The Use of Medicines in the United States: Review of 2011.″
Src (2013): 2014. IMS Institute for Healthcare Informatics. “Medicine use and shifting costs of healthcare: A review of the use of medicines in the United States in 2013.″
Src (2014): 2015. IMS Institute for Healthcare Informatics. “Medicines Use and Spending Shifts: A Review of the Use of Medicines in the U.S. in 2014.″
Michael Kleinrock, of IMS, explains via email that Rx usage rates have been very consistent for a very long time. Their data goes back to the early 90s, but the collection of age-band data is a relatively recent addition. They haven’t yet produced harmonized figures showing all of their historic data.
Forecast data
In 2008, a paper published by the Department of Health and Human Services gave forecasts for prescriptions dispensed per visit to the year 2030. Three forecasts were made for prescriptions per physician office visit, per hospital/clinic outpatient visit, and per emergency visit. The forecasts are divided into age bands for patients aged 0-44, 45 to 64, and 65 years and older. The forecasts are all based on analysis of the CDC’s National Ambulatory Medical Care Survey (NAMCS) from 1995 to 2004, with trend extrapolation from 2005 to 2030.
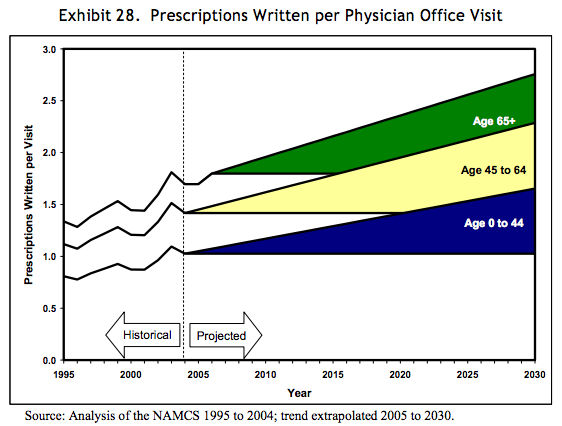
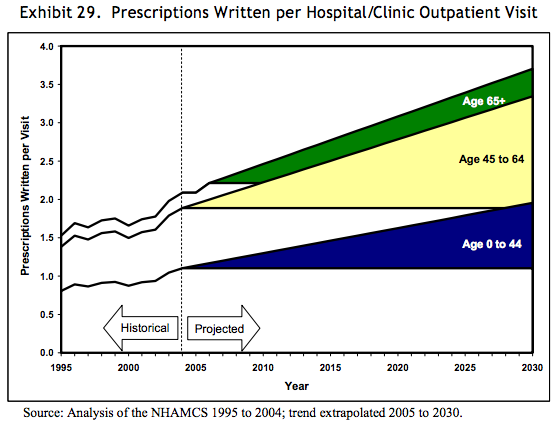

Src: 2008. Department of Health and Human Services. “The Adequacy of Pharmacist Supply: 2004 to 2030.” Exhibits 28-30, pp 31, 32.
Dental Braces Usage
Statistics describing dental services and usage rates are collected as part of the previously cited Medical Expenditure Panel Survey (MEPS topics: Dental Visits/Use/Events and Expenditures). Unfortunately, the publications that summarize this data often do not include procedure-level details, but instead focus on dental expenditure on the whole as a percentage of health spending.
One exception I’ve found is a paper from 2007 comparing detailed statistics from 1996 and 2004. Here are relevant excerpts:
The total number of procedures increased from about 496 million in 1996 to about 572 million in 2004.
Distribution of dental procedures1996 2004 Diagnostic 40.2% 42.5% Preventive 29.0% 30.4% Restorative 8.2% 6.9% Prosthetic 7.3% 6.4% Oral surgery 4.1% 3.3% Periodontic 0.9% 0.9% Endodontic 2.1% 1.7% Orthodontic 6.8% 6.9% Other* 1.5% 1.0%
Diagnostic includes exams and x-rays.
Preventative includes cleanings, flouride, sealants and recall visits.
Restorative includes fillings and inlays.
Prosthetic procedures include crowns, bridges, and dentures.
Periodontic procedures include gums.
Endodontic procedures include root canals.
Orthodontic procedures include braces.
Other includes any other dental service not included above.
Src:
Richard J. Manski and Erwin Brown. 2007. “Dental Use, Expenses, Private Dental Coverage, and Changes, 1996 and 2004.” Agency for Healthcare Research and Quality, Rockville, MD.
Co-author Richard Manski (rmanski AT umaryland DOT edu) has written a couple of foreward-looking papers for RAND. I’ve emailed him to ask if he is aware of any ~10-year forecasts for dental braces usage.
EDIT: Manski is unaware of any forecasts.
Dental raw data from the on-going MEPS survey is available here: MEPSnet/HC Trend Query. Raw data for orthodontic visits in 2012 is here, for example: 2012 Full Year Person-Level File. DVGEN12 – # GENERAL DENTIST VISITS 12. Assistance in interpreting the data would be helpful.
