

Energy Mix, Consumption, Prices, Emissions
Overview
Energy mix forecasts looking out 15 to 35 years are available from a handful of governmental, industry, and independent sources. The excerpts below are preceded by my brief notes, in italic, introducing the source.
General consensus: oil, gas, and coal continue to dominate the energy mix. Gas grows substantially; oil and coal are either level or decreasing. Renewables show the highest growth rates. Amongst renewables, solar shows the greatest growth. Energy intensity (or consumption per capita) decreases.
In addition to energy mix, the figures below also include forecasts for overall usage, intensity (per capita usage), prices, residential sources, and emissions.
Findings
U.S. Energy Information Administration
The U.S. Energy Information Administration (EIA) presents energy forecasts for a range of cases in its Annual Energy Outlook. The excerpts below refer to the Reference Case, wherein GDP grows at an average annual rate of 2.4%, and current laws and regulations remain basically the same. This is the “business as usual” scenario. Forecasts for five other scenarios are presented in the report, but are not excerpted here.
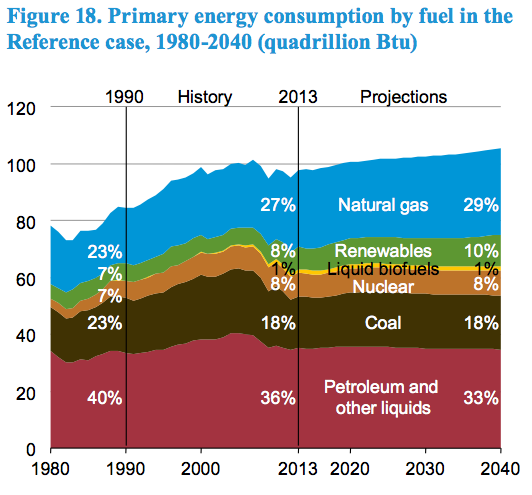
Total primary energy consumption grows in the AEO2015 Reference case by 8.6 quadrillion Btu (8.9%), from 97.1 quadrillion Btu in 2013 to 105.7 quadrillion Btu in 2040 (Figure 18).
data available here
web chapter here
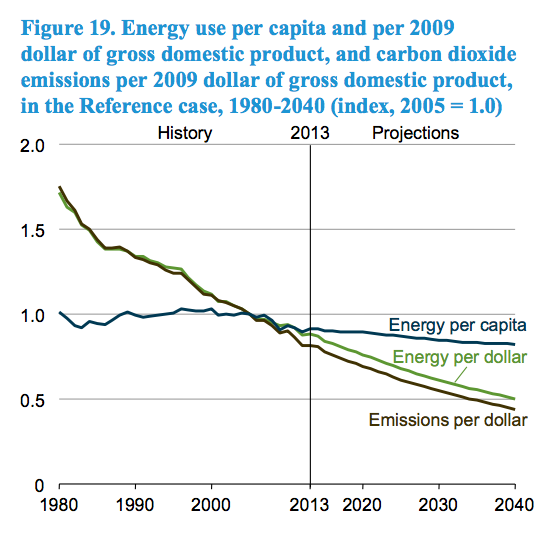
Energy intensity (measured both by energy use per capita and by energy use per dollar of GDP) declines in the AEO2015 Reference case over the projection period (Figure 19).
data available here
web chapter here
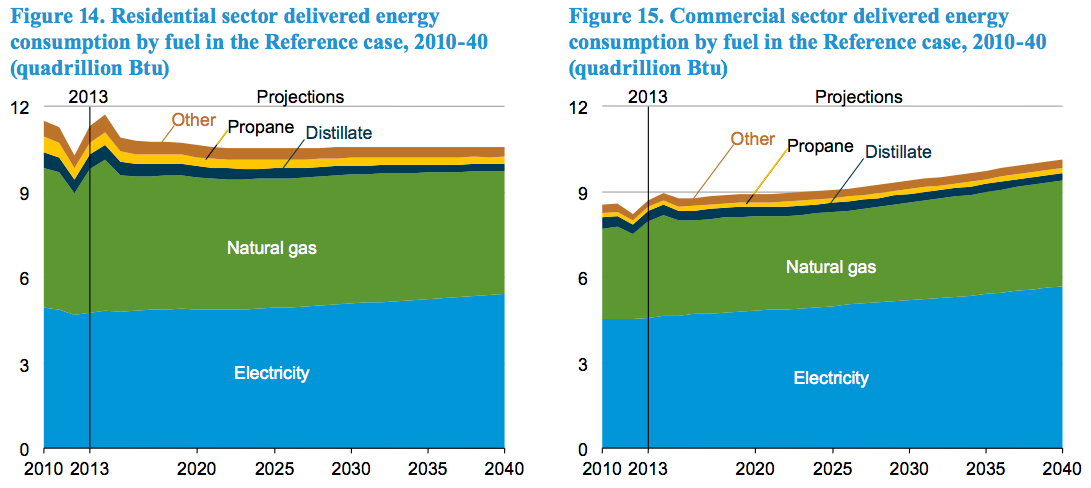
Delivered energy consumption decreases at an average rate of 0.3%/year in the residential sector and grows by 0.6%/year in the commercial sector from 2013 through 2040 in the AEO2015 Reference case (Figure 14 and Figure 15). Over the same period, the total number of households grows by 0.8%/year, and commercial floorspace increases by 1.0%/year (Table 4).
data available here and here
web chapter here
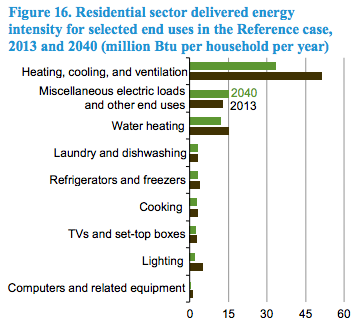
End-use energy intensity, as measured by consumption per residential household or square foot of commercial floorspace, decreases in the Reference case as a result of increases in the efficiency of equipment for many end uses (Figure 16 and Figure 17). Federal standards and voluntary market transformation programs (e.g., Energy Star) target uses such as space heating and cooling, water heating, lighting, and refrigeration, as well as devices that are rapidly proliferating, such as set-top boxes and external power supplies.
data available here
web chapter here
Src:
U.S. Energy Information Administration. April 2015. “The Annual Energy Outlook 2015.” DOE/EIA-0383(2015)
Contacts
Director: John J. Conti john.conti@eia.gov
General questions: Paul Holtberg paul.holtberg@eia.gov
[more contacts listed in the report TOC]
*
World Energy Council
The World Energy Council (WEC) is the UN-accredited global energy body comprised by more than 3000 member organizations drawn from governments, private and state corporations, academia, NGOs and energy-related stakeholders. WEC publishes many recurring reports, but in 2013 it released a set of projections to 2050.
The report focuses on two scenarios: a more consumer-driven scenario (called “Jazz”), and a more voter-driven scenario (called “Symphony”). Jazz has a focus on energy equity with priority given to achieving individual access and affordability of energy through economic growth. Symphony has a focus on achieving environmental sustainability through internationally coordinated policies and practices.
| Primary Energy Mix, 2010 and 2050 (Jazz and Symphony) | |||
| 2010 | 2050 Jazz | 2050 Symphony | |
| Fossil fuels (coal, oil, gas) | 79% | 77% | 59% |
| Renewables | 15% | 20% | 30% |
| Nuclear | 6% | 4% | 11% |
| World Energy Council Jazz and Symphony Projections for North America, 2010-2040 | |||||||||
| 2010 | 2020 | 2030 | 2040 | 2050 | 2020 | 2030 | 2040 | 2050 | |
| Total Primary Energy Supply (EJ/y) | 116 | 128 | 135 | 136 | 130 | 118 | 114 | 108 | 105 |
| Total Electricity Generation (TWh/y) | 5,214 | 6,152 | 6,903 | 7,728 | 8,024 | 6,100 | 6,733 | 7,695 | 8,057 |
| Carbon Price (US$2010/tCO2) | 8 | 15 | 21 | 28 | 21 | 28 | 55 | 70 | |
| CO2 – Emissions (GtCO2/y) | 6.5 | 7.2 | 7.3 | 7.2 | 6.7 | 6.2 | 5.4 | 4.4 | 3.1 |
| Carbon Capture, Use And Storage (GtCO2/y) | 0.0 | 0.0 | 0.0 | 0.1 | 0.2 | 0.0 | 0.1 | 0.3 | 1.1 |
10 Key Messages
- Energy system complexity will increase by 2050.
- Energy efficiency is crucial in dealing with demand outstripping supply.
- The energy mix in 2050 will mainly be fossil based.
- Regional priorities differ: there is no ‘one-size-fits-all’ solution to the energy trilemma.
- The global economy will be challenged to meet the 450ppm target without unacceptable carbon prices.
- A low-carbon future is not only linked to renewables: carbon capture, utilisation and storage (CC(U)S) is important and consumer behaviour needs changing.
- CC(U)S technology, solar energy and energy storage are the key uncertainties up to 2050.
- Balancing the energy trilemma means making difficult choices.
- Functioning energy markets require investments and regional integration to deliver benefits to all consumers.
- Energy policy should ensure that energy and carbon markets deliver.
Scenarios are alternative views of the future which can be used to explore the implications of different sets of assumptions and to determine the degree of robustness of possible future developments. While most widely known scenarios are normative, the WEC has adopted a different, exploratory approach. ‘Normative’ in this context means that the scenarios are being used to drive the world towards a specific objective such as a particular atmospheric CO2 level. In contrast, the WEC with its exploratory scenarios Jazz and Symphony, attempts to provide decision makers with a neutral fact-based tool that they will be able to use to measure the potential impact of their choices in the future.
This approach can only be done successfully by a network like the WEC’s with its impartial and inclusive membership structure. Over 60 experts from more than 28 countries have contributed to the WEC’s scenario building process over a period of three years.
Src:
World Energy Council. 2013. “World Energy Scenarios: Composing Energy Futures to 2050”
*
BP
BP produces a 20-year forecast based on a single, most-likely growth trajectory.
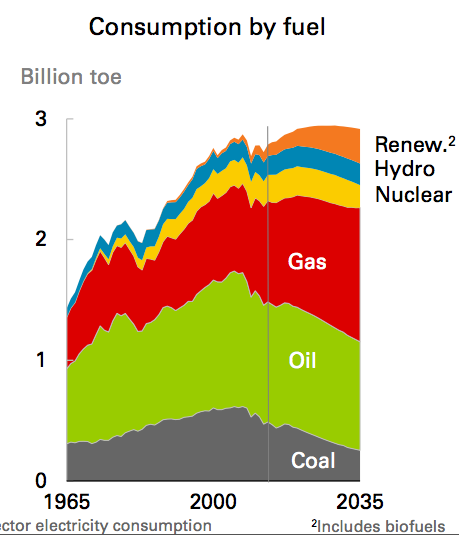
Oil consumption declines 0.5% p.a. over the Outlook as a result of falling demand in the transport sector. Coal declines by 2.9% p.a., driven by more aggressive environmental policies and competitively priced natural gas. Nuclear (-0.6% p.a.) demand also declines over the Outlook. Natural gas is the only fossil fuel to grow over the Outlook (1.3% p.a.). Renewables are the fastest growing group of fuels, increasing by 5.1% p.a.. Hydro-electric power increases 0.6% p.a., faster than total energy demand.
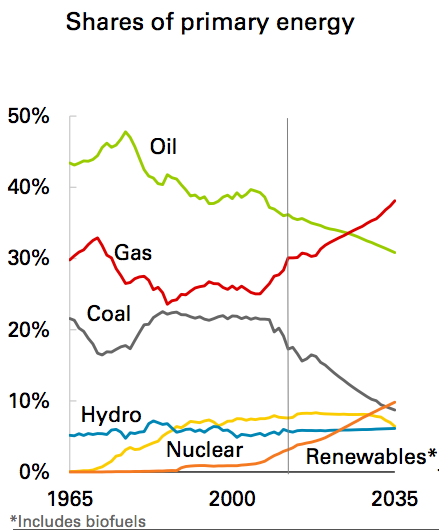
Shares of fossil fuels in the energy mix decline from 83% today to 78% by 2035. Shares of renewables (including biofuels) increase from 3% in 2013 to 10% in 2035, while hydro remains stable throughout the Outlook at 6% and nuclear remains near 8% until losing market share in the last few years of the Outlook. Shares of natural gas grow from 30% in 2013 to 37% in 2035, overtaking oil as the leading fuel around 2025. More than half of the increase in energy demand from 2013-2035 is met by natural gas. Oil’s market share declines throughout the Outlook, reaching just 31% by 2035, the lowest share on record and down from a high of 48% in 1977. Coal’s share drops to just 9%, also the lowest on record. Renewables overtake coal as the third largest fuel by market share by the end of the Outlook.
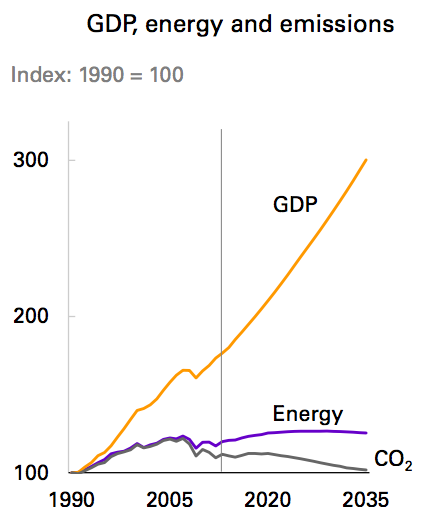
Continuing declines in energy intensity – the broadest indicator of improving energy efficiency across the economy – leads to a marked widening in the gap between GDP and energy consumption. Energy intensity declines by 39% by 2035 (-2.2% p.a.). Total carbon emissions from energy consumption decrease by 9% between 2013 and 2035 (-0.4% p.a.), with the rate of decline speeding up in the last half of the outlook, (-0.7% p.a. from 2025 to 2035).
Src:
BP. February 2015. “Energy Outlook 2035: Focus on North America.”
Excel tables (49.8KB)
Country Insights: US
*
The International Renewable Energy Agency
The International Renewable Energy Agency (IRENA) is an intergovernmental organisation that supports countries in their transition to a sustainable energy future, and serves as the principal platform for international co-operation, a centre of excellence, and a repository of policy, technology, resource and financial knowledge on renewable energy. As of December 2015, there are 144 member states, including the US.
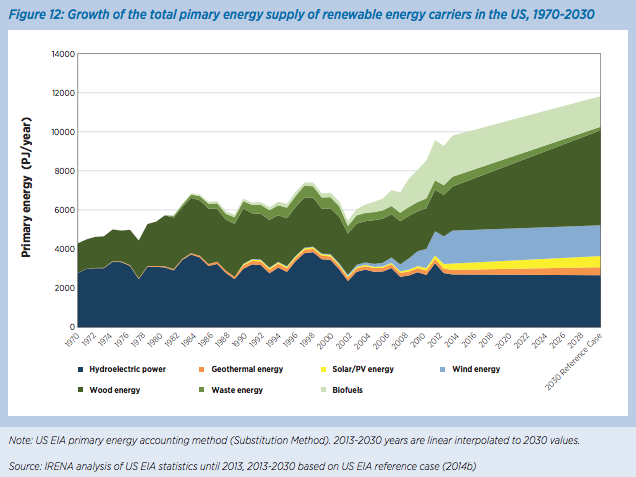
The following excerpts come from a report on renewable energy sources and consumption in the US. Although the report focuses on the potential to dramatically increase renewable energy, the excerpts here highlight it’s projections for conservative, or business as usual, usage of renewables. The data in their report is from the US Energy Information Agency.
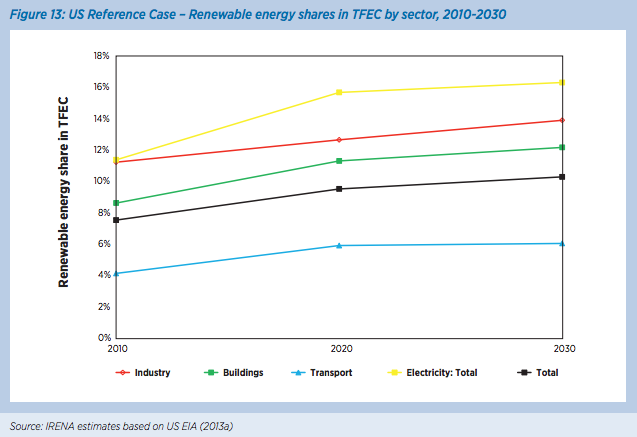
In 2010, the US was the second largest energy consumer in the world with a total final energy consumption (TFEC) of 64 exajoules (EJ), equivalent to 19% of the global TFEC (IEA, 2013a). The US TFEC is projected to remain stable in the period between 2010 and 2030 growing by only 4% according to US Energy Information Agency‘s Annual Energy Outlook (AEO) (US EIA, 2013a). In the same time period, based on current policies or the Reference Case according to this study, the US share of renewable energy in the TFEC will only grow from 7.5% in 2010 to 10% in 2030, driven mostly by an increase in renewable power generation.
The Reference Case for the US was based on the U.S. Energy Information Agency’s “Annual Energy Outlook 2013”
Renewable energy share in TFEC of the US stood at 7.5% in 2010 (the base year of REmap 2030 analysis). This included 2.4% renewable power, 1.6% liquid biofuels and the remainder (3.4%) largely solid biomass in industry and building heating.
Src:
IRENA. 2015. “Renewable Energy Prospects: United States of America, REmap 2030 analysis.”
Population and Fertility Projections
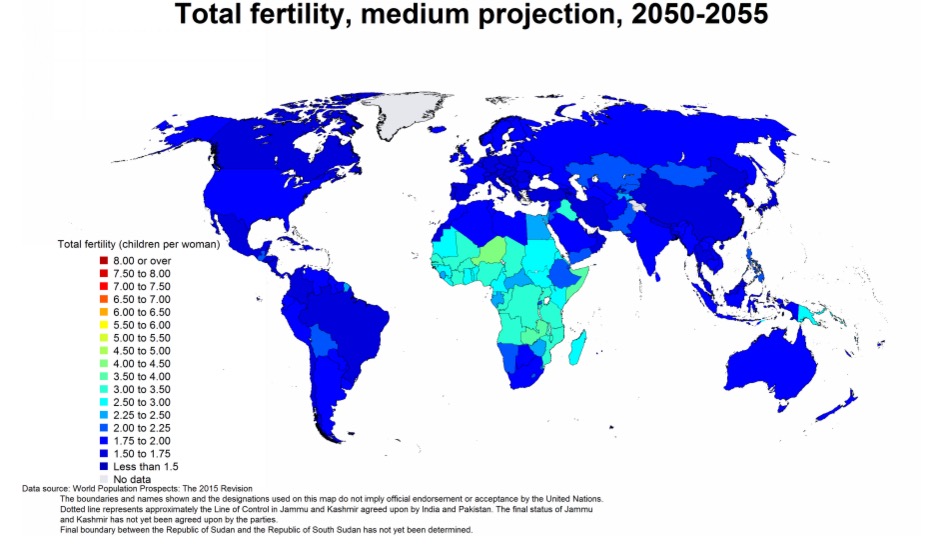
Future population growth is highly dependent on the path that future fertility will take and according to the World Population Prospects, 2015 Revision (United Nations), global fertility is projected to fall from 2.5 children per woman in 2010-2015 to 2.4 in 2025-2030 and 2.0 in 2095-2100.
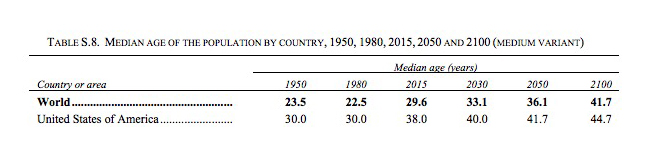
Even assuming that fertility levels will continue to decline, the global population is still expected to reach 8.5 billion in 2030, 9.7 billion in 2050 and 11.2 billion in 2100, according to the medium projection variant. In 2016, it is projected that 83 million people will be added to the world’s population.
In the United States, fertility is projected to rise from 1.89 children per woman in 2010-2015 to 1.92 in 2045-2050. Below is a world map of Total fertility, 2050-2055.
Other key findings:
Data Source:
United Nations. 2015.
World Population Prospects: The 2015 Revision.
Department of Economic and Social Affairs, Population Division.
*
Src:
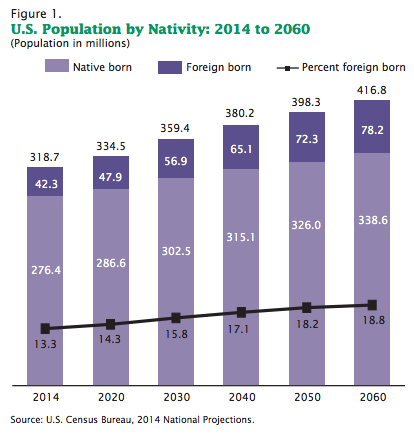
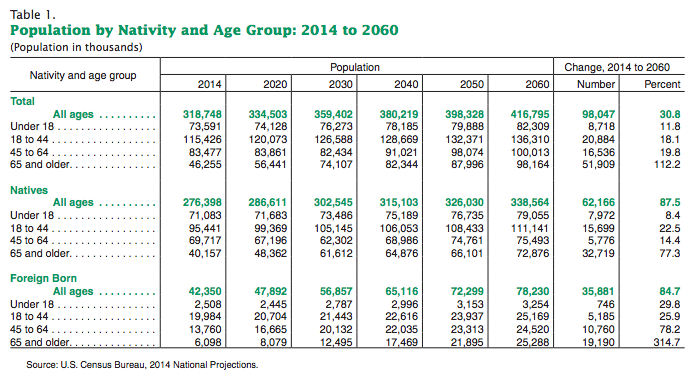
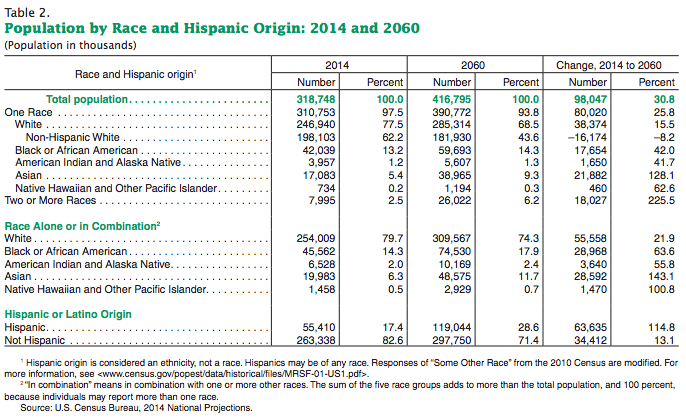
U.S. Census Bureau. March 2015.
“Projections of the Size and Composition of the U.S. Population: 2014 to 2060.”
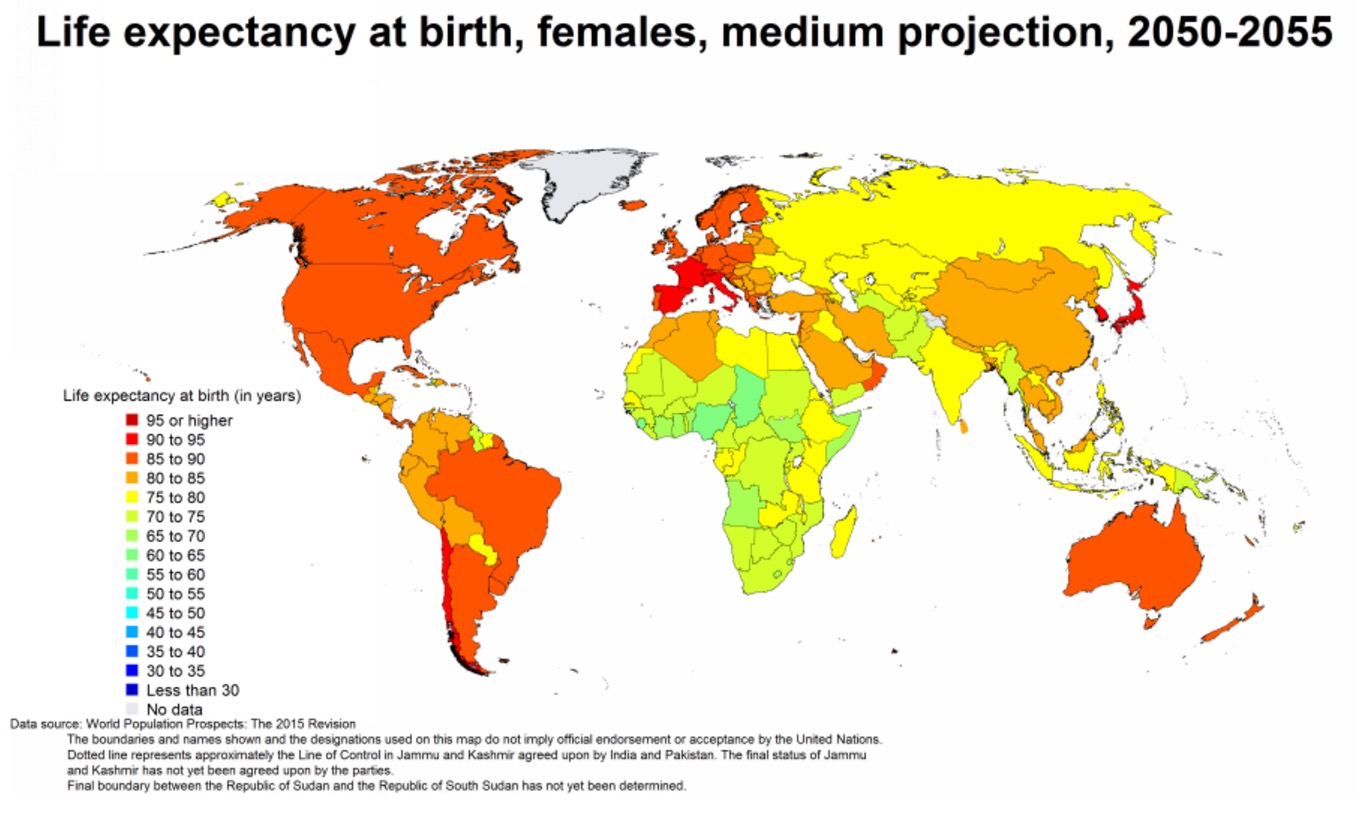
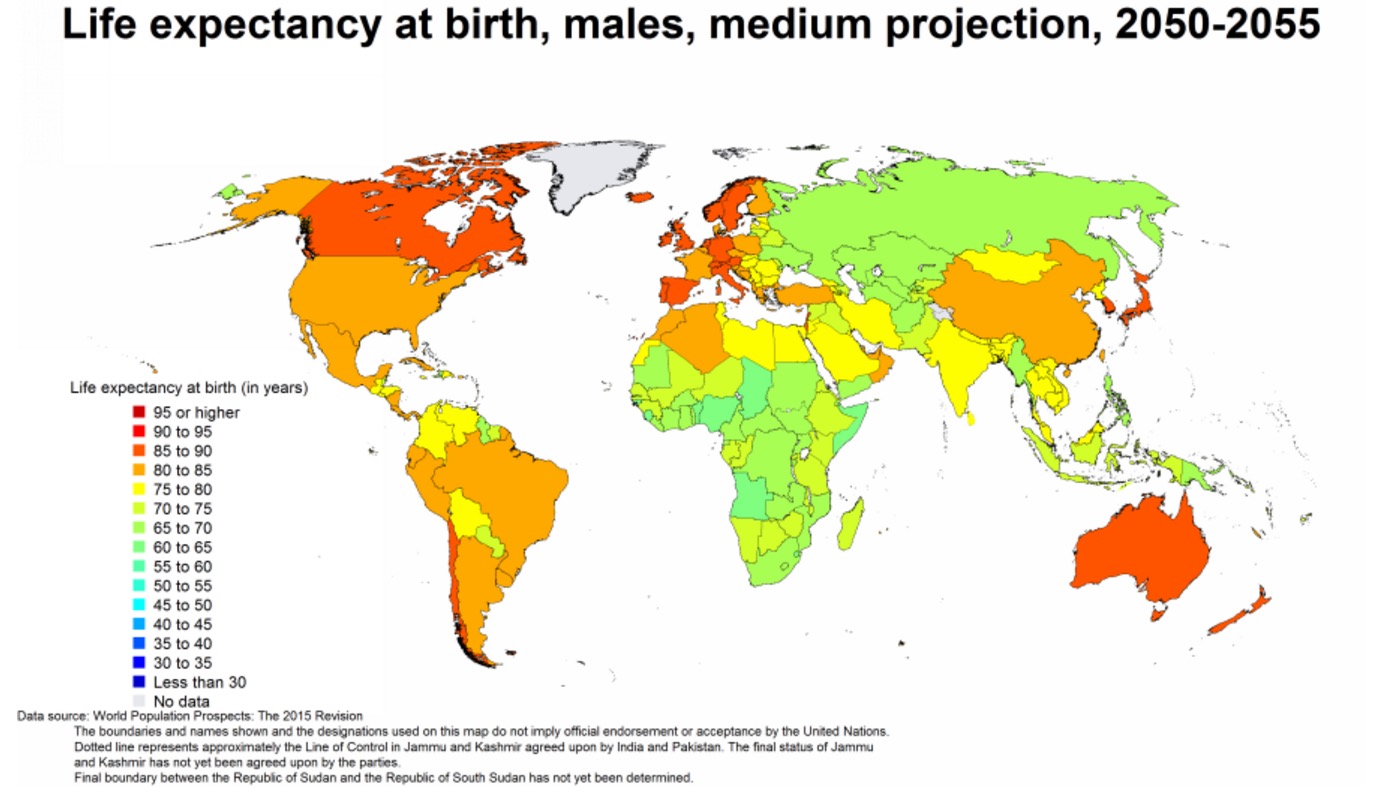
Life expectancy at birth in 2050
The Department of Economic and Social Affairs of the United Nations provides population projections for the period 2015-2100. Projections are presented for five-year periods. Below are world maps of life expectancy at birth for females and males, 2050-2055.
In the United States, life expectancy at birth for females is projected to rise 10 years from 80-85 years in 2015 to 90-95 years in 2050. For men, it will rise 10 years from 75-80 years to 80-85 years.
Data Source:
United Nations. 2015.
“World Population Prospects: The 2015 Revision.”
What Will We Wear?
The future of fashion may be built on recycled garbage. Or fabrics lab-grown by fermentation (or grown on our bodies). Or subdermal electronics. Here’s a roundup and summary of a few speculations.
Jessica Brinton. April 4, 2015. “2050: The Fashion Of The Future.” The Australian.
Of the speculations I’ve seen so far, this is the most optimistic. Here is a summary of the major points:
Department stores will be optimized not to sell things, but to make people happy. Presumably making them glad to be there (and buy things).
We’ll shop in stores, and our purchases will be delivered to our homes nearly instantly.
Clothing will be embedded with nanotechnology creating body operating system, thereby connecting us to the larger internet of things. Our clothes will react to the needs of our bodies.
“Our clothing will be fully updateable, adaptable and optimised to the way we want to express ourselves on any particular day.”
We will use 3D printers at home or in high-spec printing houses nearby, or we may grow our clothes on demand from microbial cultures.
Beauty standards will reflect new ethnicities and increased lifespans.
By the late 2020s, clothes will be so adaptable and recyclable they will never be thrown away. “Fast fashion” will be made from paper so that it can be recycled when the trend has passed.
Nancy Tilbury. March 6, 2010. “Digital Skins Body Atmospheres.”
Kathleen Flood. August 29, 2012. “This Future Of Fashion Film Predicts Body Mods Will Be All The Rage In 2050.” The Creators Project.
Wearable technology designer Nancy Tilbury released a short film in 2010 predicting high fashion possibilities in 2050. The Creators Project blogged about Tilbury’s film and picked up on the prevalence of body modification in her vision. Highlights from the film include dresses made of gas; embedded moisturizers, fashion pills, and electric eyes; biologically grown high-heels, jewelry, and clothes that are extensions of the “wearers” flesh.
The Creators Project playfully contrasted Tilbury’s vision with a film from the 1930s predicting fashion trends in the year 2000.
Note: Nancy Tilbury spoke at the 2013 conference “Wearable Futures.” Other speakers are listed here.
Danielle Meder. June 3, 2007. “Fashion Forecast 2050.” Final Fashion.
Fashion illustrator Danielle Meder did a bit of speculation on general fashion trends in 2050 back in 2007. She was prompted by the question of what impact quadrupling energy costs might have on the fashion industry. Her speculations also assume a generally contracting global economy, a warming climate, and a slight overall dip in quality of life. Here are some “highlights”:
The most affordable materials will be the ones produced closest to you. For example, garbage.
The most fashionable materials will be the most unavailable. In Toronto, that would be practically any virgin fiber.
In Canada, woven fabrics will be exotic and rare. Fur will be more common.
With less heat and A/C, clothing weights and constructions will compensate. Because UV rays will be stronger, outdoor clothing will be sun-protective. Clothing will be washed less often.
Rising inflation might lead people to keep (and wear) their wealth in jewelry, instead of banks.
As materials become more localized, and also the skills to work with localized materials, extreme regional variations in dress will develop.
Wages will be depressed, as will consumer spending. Less productivity means fashion will change more slowly. People will be thinner on average, and the idealized fashionable body will become more voluptuous.
If the world becomes more religious/conservative on the whole, there may be a greater power divide between the sexes. In that case, men’s and women’s clothing will be less similar, more defined and restrictive.
COMING SOON OR HERE
Grown materials:
Cara McGoogan. October 28, 2015. “This Sportswear Peels Away When You’re Hot And Sweaty.” Wired.co.uk.
Katie Levitt. November 17, 2011. “Suzanne Lee Grows Her Own BioCouture Bomber Jackets.” The Creators Project.
Chemical reactive materials:
October 17, 2015. “The Unseen Uses Chemistry To Create Reactive Fashion.” Wired 2015 Next Generation.
Prosthetic Limbs Forecast to 2050
Summary
In searching for prosthetic device usage rates and forecasts, I’m finding that the most accessible type of data available describes incidence of limb loss and associated prostheses. Data describing usage rates for other types of prostheses and assistive devices has been harder to find (for example, dental prostheses, cochlear implants, artificial heart valves, etc). This summary and set of excerpts focuses on limb loss and associated prostheses.
The CDC, via its National Health Interview Survey, collected data on the number of people using upper and lower limb prostheses. Data was collected in the mid 1990s – I’m not sure if CDC has more recent (or older) figures. (Email inquiry on Oct 6, 2015. No reply as of Oct 8.)
The US Department of Health and Human Services has documented rates of amputation in the US via its Healthcare Cost And Utilization Project (HCUP), although this effort does not document rate of prostheses usage. Estimated rates of prosthesis usage by amputees vary widely.
The National Commission on Orthotic and Prosthetic Education (NCOPE) has published a workforce demand study forecasting prosthesis user figures through 2020. An academic study has forecast amputee figures to 2050. We could apply the usage rate used in the NCOPE study to extrapolate a number of users from that second study.
*
Follow-up Notes
CC emailed CDC. CC emailed reps from SFB’s Devices & Materials Committee and BMES’s Medical Devices Special Interest Group (including someone from FDA).
Donna Lochner (FDA) is not aware of any centralized repositories for overall prosthetics data, but she made a few suggestions by email: check the Center for Medicare and Medicaid Services (CMS) for the Medicare population, and individual registries by product areas (eg: INTERMACS for mechanically-assisted circulatory support devices; the Society for Thoracic Surgeons and the American College of Cardiology for transcatheter heart valves). Lochner thinks the highest volume implants are intraocular lenses, and this might be an area where CMS data would capture the vast majority of the implants.
Emailed William Polglase of CMS for assistance in interpretting data (10/15).
Emailed Medtech Solutions (recommended by BMES) to ask about general tallies.
Research Excerpts
Currently, there are an estimated 1.9 million people living with limb loss in the United States, almost half of whom are non-white. At its peak, an estimated 185,000 amputations occurred in 1996 in the United States.
Amputation rates in the total population (including individuals without diabetes, or with peripheral artery disease alone) are not known and active surveillance efforts do not exist.
Src:
Limb Loss Task Force/Amputee Coalition. 2012. “Roadmap for Preventing Limb Loss in America: Recommendations From the 2012 Limb Loss Task Force.”
*
82% [of amputations] are due to Peripheral Vascular Disease and Diabetes. More than 65 percent of amputations are performed on people age 50 and older.
While diseases such as diabetes and peripheral vascular disease are the leading causes of amputation, accidents and war continue to play a major role in driving the limb prosthetics market.
Technological growth and an increasing consumer base of amputees are bolstering the prosthetics market growth, according to an analysis from the business and research consulting firm Frost & Sullivan. The overall prosthetics market in the United States earned revenues of $1.45 billion in 2006 and estimates that number to reach $1.85 billion by 2013. The global dental prosthetics market is estimated to exceed $5 billion. Hip and knee replacements are big drivers of the orthopedic prosthetic market. Over 100,000 cochlea implants are currently in place globally. The limb future prosthetics devices and the accompanying services market are estimated to exceed $5 billion (of which an estimated $3 billion alone is in amputee patient services) in the U.S.
The lack of common standards, a common lexicon and common data collections negatively impact on the ability to assemble precise market data on limb prosthetics. A National Institutes of Health study concluded, “For example, documented rates of prosthesis use vary from 27 to 56 percent for upper-limb amputation (ULA) and from 49 to 95 percent for lower-limb amputation (LLA). A number of studies have attempted to identify variables that explain inconsistent use rates and identify persons less likely to wear and benefit from a prosthesis. Unfortunately, the existing literature is equivocal and limited by a number of factors.”
Research at the Bioengineering Institute of Worcester Polytechnic Institution, University of Utah, University of Washington and the University of Illinois at Chicago are current leaders in osseointegration and limb transplantation research.
Among the sources for this market analysis are:
Walter Reed Army Medical Center
Henry Jackson Foundation
Amputee Coalition of America
O&P Edge
The Press-Enterprise
Frost & Sullivan
Securities and Exchange Commission
Boston Globe
Aetna Insurance
Atlas of Prosthetics
National Institutes of Health
Disabled-World.com
One Source
ArmDynamics.com
some of the above tallies are from:
Persons Living with Limb Loss, 1996
National Health Interview Survey, Vital Statistics Report, Series 10, No. 200.
New Cases of Limb Loss, 1996
Health Care Utilization Project National Inpatient Sample (HCUP-NIS), 1996.
It is estimated that approximately 199,000 persons in the U.S. were using an artificial limb in 1994, with the majority using an artificial leg or foot (173,000).
Datasource: National Center for Health Statistics,
Disability Report. Table 1
EMAILED nhis@cdc.gov TO SEE IF ITS BEEN UPDATED
Src:
Dr. Grant McGimpsey and Terry C. Bradford. “Limb Prosthetics Services and Devices” [White paper]. Bioengineering Institute Center for Neuroprosthetics, Worcester Polytechnic Institution.
*
The total number of persons with an amputation, and those using a prosthesis, is expected to increase by at least 47% by the year 2020.
The projected number of persons with amputations (excluding tips of fingers and toes) is based on rates by age group and sex determined in the 1993 Health Interview Survey. These projections (Table VII) assume that the rates will remain stable through the year 2020. The total number of persons with an amputation is expected to increase by 47% between 1995 and 2020. Of the total number of persons with amputations it is estimated that 75% use a prosthesis. The population using a prosthesis is also anticipated to increase by 47% during this time period. With the advent of improved prosthetic designs and lighter materials it is likely that the rate of use may increase, particularly if third party payers become more aware of the benefits of these products.
Table VII
Projected Number of Persons with Absence of Extremities
(excluding tips of fingers and toes) 2000-2020
Year — Total Number — No. Of Users of Prostheses*
2000 — 1,752,838 — 1,314,629
2005 — 1,904,035 — 1,428,026
2010 — 2,065,993 — 1,549,495
2015 — 2,224,022 — 1,668,017
2020 — 2,382,413 — 1,786,810
*Based on 75% of total numbers of persons with amputations.
Src:
Caroline C. Nielsen. 2002 May. “Issues Affecting The Future Demand For Orthotists And Prosthetists:Update 2002.” National Commission on Orthotic and Prosthetic Education
Citing:
Benson, V and Marano, MA. Current Estimates for the National Health Interview Survey, 1993. National Center for Health Statistics. Vital Health Statistics 10 (190). 1994.
Estimated number of persons with an amputation using a prosthesis (75%) estimated from data in 1) Current Estimates for the National Health Interview Survey, 1993 ; 2) Scremin, A.M. et al. Effect of Age on Progression Through Temporary Prostheses After Below-Knee Amputation. Am. J. of Phys. Med. and Rehab, 1993, and 3)Nielsen, C.C. A Survey of Amputees: Functional Level and Life Satisfaction, Information Needs and the Prosthetist’s Role, JPO, 1991.
NOTE: An updated version of this report was produced for NCOPE in 2015, but it does not provide estimates for the number of prosthesis users. (Instead it calculates the number of O&P doctors in demand.) I’ve written to the author to inquire if that data is available. The updated report is:
Joan E. DaVanzo, Audrey El-Gamil, Steven Heath, et al. 2015. “Projecting the Adequacy of Workforce: Supply to Meet Patient Demand.” National Commission on Orthotic and Prosthetic Education. p.17, Exhibit 5 – 2014 figures. p.19, Exhibit 6 – 2016, 2025 projections.
*
In the year 2005, 1.6 million persons were living with the loss of a limb. It is projected that the number of people living with the loss of a limb will more than double by the year 2050 to 3.6 million.
Table 3
Projected Prevalence of Limb Loss by Etiology and Age (in thousands)
Year — Total
2005 — 1,568
2010 — 1,757
2020 — 2,213
2050 — 3,627
…Most striking, however, are the projected trends for the number of people living with the loss of a limb. This increase is related to the aging of the population and the associated increase in the number of people living with dysvascular conditions, especially diabetes. The prevalence of diabetes in the United States is projected to nearly double by the year 2030 solely because of changes in the demographic composition of the population. Our estimates of limb loss reflect, and indeed magnify, these trends. Even assuming that age-, sex-, and race-specific rates of both diabetes and diabetes-related amputations remain unchanged, the number of people with diabetes who are living with the loss of a limb will nearly triple by the year 2050. Overall, the prevalence of limb loss will more than double from 1.6 to 3.6 million people. Given the increase in the prevalence of obesity and the known relationship between obesity and diabetes, a projected increase in the incidence of amputations secondary to dysvascular conditions is likely.
…A goal of Healthy People 2010 is to reduce the number of lower-extremity amputations in persons with diabetes by 55%, from 4.1 per 1000 to 1.8 per 1000 persons.
Src:
Ziegler-Graham K, MacKenzie EJ, Ephraim PL, et al. 2008. “Estimating the prevalence of limb loss in the United States: 2005 to 2050.” Archives of Physical Medicine and Rehabilitation, 89(3).
*
UPDATE 10/27: INTERMACS confirmed tallies for ventricular assist devices from 2006-2015. They estimate that their figures cover 90-95% of the market.

[click for larger]
Annual new patient tallies are at the top of the chart area.
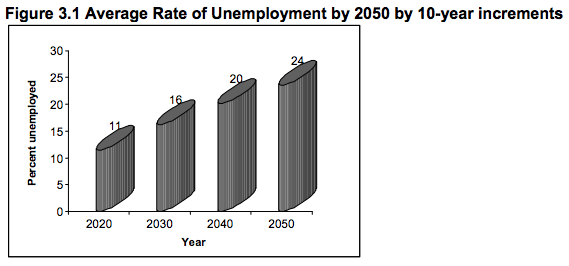
Unemployment Rates to 2050
As part of their 2015-16 State of the Future report (the 18th edition), The Millennium Project conducted a Future Work/Technology 2050 study. Using a Real-Time Delphi survey, the Project asked a panel of 300 experts the following question:
If socio-political-economic systems stay the same around the world, and if technological acceleration, integration, and globalization continue, what percent of the world do you estimate could be unemployed—as we understand being employed today—during each of the following years: 2020; 2030; 2040; 2050?
Their response:
The full chapter (including the responses to 9 other questions also asked of the expert panel) are available here:
Jerome C. Glenn, Elizabeth Florescu, et al. 2015. “Future Work/Technology 2050” in 2015-16 State of the Future.
The Executive Summary for the 2015-16 “State of the Future” report is here:
Jerome C. Glenn, Elizabeth Florescu, et al. 2015. “Executive Summary” in 2015-16 State of the Future.
