

food
Food
This collection of data includes the following indicators:
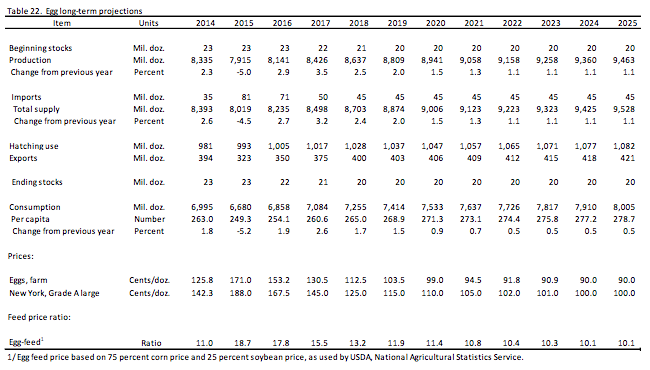
Crop Acreage, 2014-2025, USDA
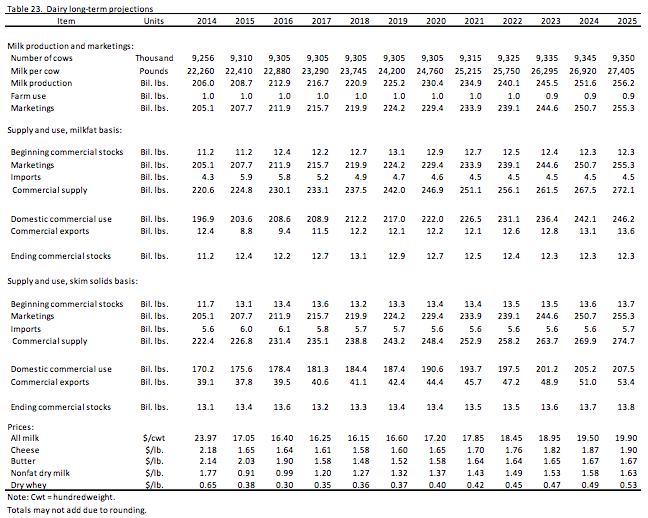
Meat Production, 1990-2025, USDA
Meat Consumption, 1909-2013; 1990-2025, USDA
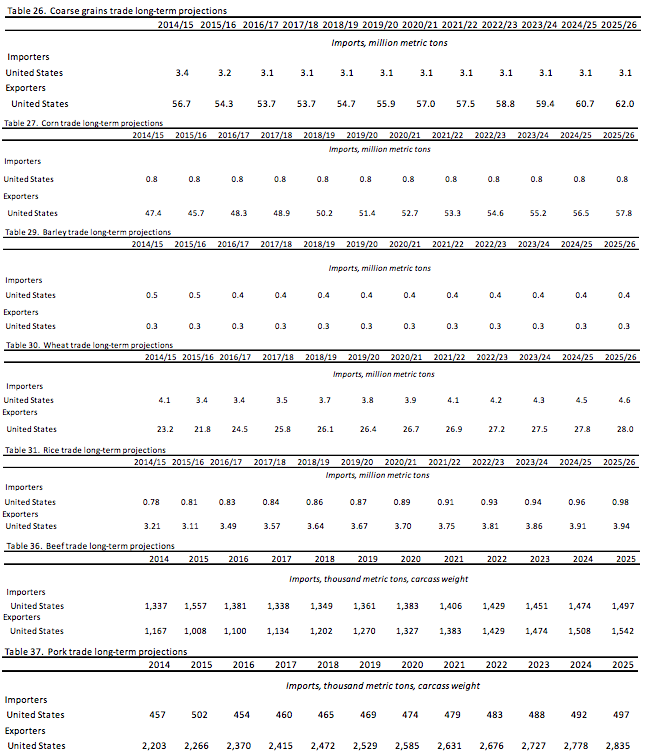
Meat Imports and Exports, 2014-2025, USDA
Organic Food Market CAGR 2015-2020, TechSci
Organic Food Sales, 1994-2014; 2006-2015, USDA; Organic Trade Association (OTA)
Organic Food Acreage, 2003-2014; 2008-2014; 1992-2011, OTA; USDA
Organic Acreage as a % of Total, 1995-2050, Steve Savage
Organic Food Premiums, 2004-2010, Nielsen/USDA
Genetically Engineered Corn and Soy, 2001-2015, USDA
Farmers’ Markets, 1994-2015, USDA & LocalHarvest
CSA Growth, 1980-2016, LocalHarvest
Food-Miles, 1997/2004, 1969, 1980, 2001, Weber & Matthews, Dept. of Defense, Hendrickson, Pirog
Farms By Size, 2002-2012, USDA
Grocery Delivery Services, 2014 & 2023, Bricks Meets Clicks
Income Spent on Food, 1970-2007, USDA
% of Food Purchased Away from Home, 1970-2012, USDA
Total Spending on Dining Out v. Groceries, 1992-2015, Commerce Dept.
% of Dinners Eaten at Home and Made at Home, 1974-2014, NPD Group
Food at Home v. Away By Income, 1956-2008, Smith
Time Spent Cooking, 1965-2008, Smith
In addition to these data sets, I’ve also included a link to a set of scenarios published by the Institute For The Future.
Crop Acreage
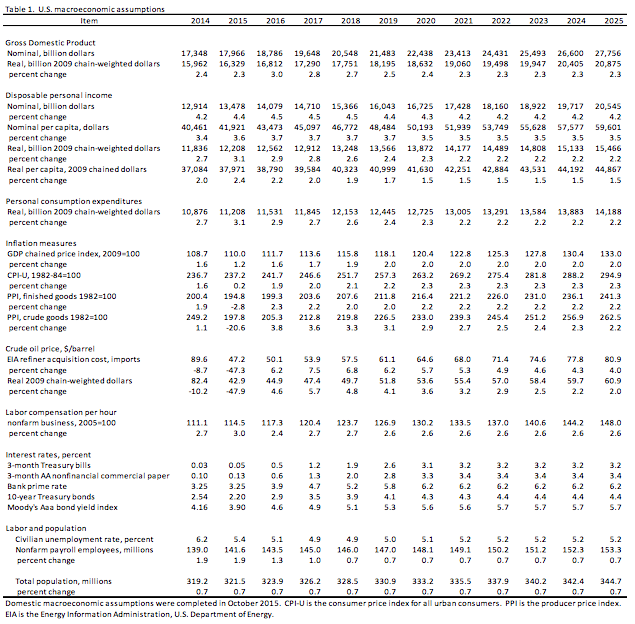
The USDA has published a report of 10-year agricultural projections annually at least since 2005. The reports are a business-as-usual projection for crops, livestock, farm income, and agricultural trade. Excerpted below are projections for crop acreage.
Includes the following macroeconomic assumptions (annual projections)
GDP
Disposable personal income
Personal consumption expenditures
Labor compensation per hour
Civilian unemployment rate
Nonfarm payroll employees
Total population
(p.16)
Excerpts:
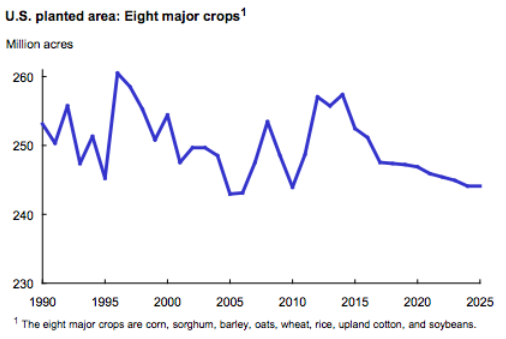
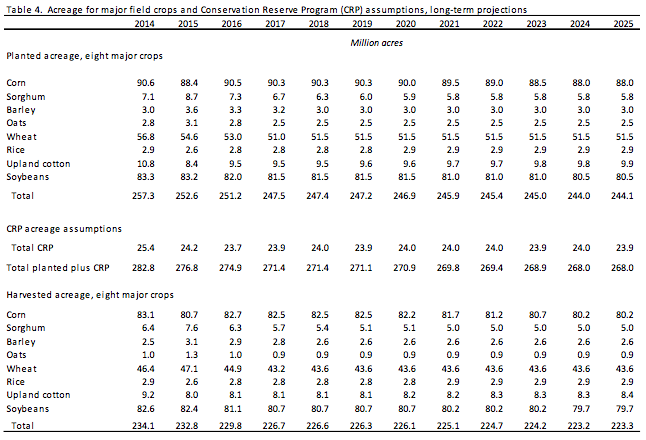
Over the long run, steady global economic growth provides a foundation for increasing crop demand, with gains in world consumption and trade. Although crop prices are projected to be below recent records, they remain above pre-2007 levels. U.S. plantings for the eight major crops continue to fall during the second half of the projection period, to about 244 million acres by 2025. Corn and soybeans decrease the most. Increasing yields provide most of the gains in U.S. production.
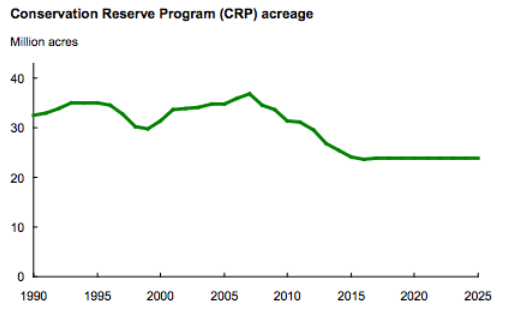
Farm programs of the Agricultural Act of 2014 are assumed to be extended through the projection period. Acreage enrolled in the Conservation Reserve Program (CRP) is assumed at levels slightly below the legislated maximum of 24 million acres.
src:
Paul Westcott and James Hansen, February 2016.
“USDA Agricultural Projections to 2025”
p.19, 28
contact: westcott@ers.usda.gov, jhansen@ers.usda.gov
Meat Production/Consuption
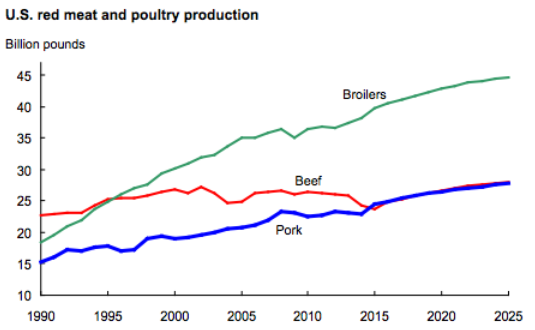
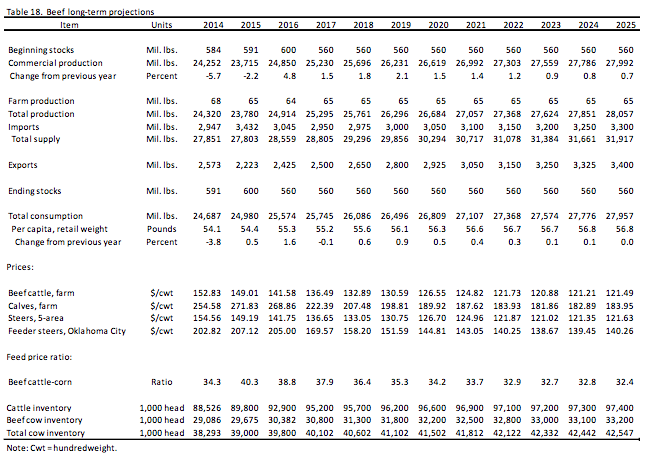
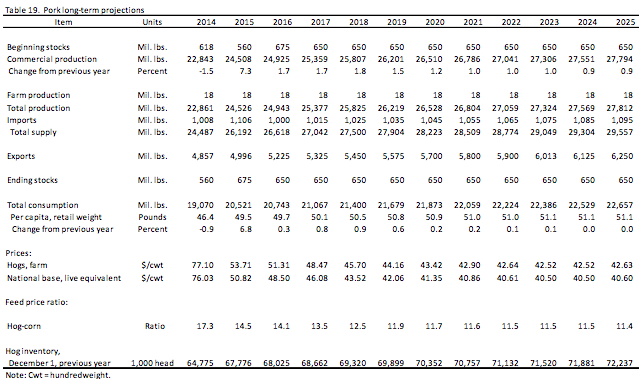
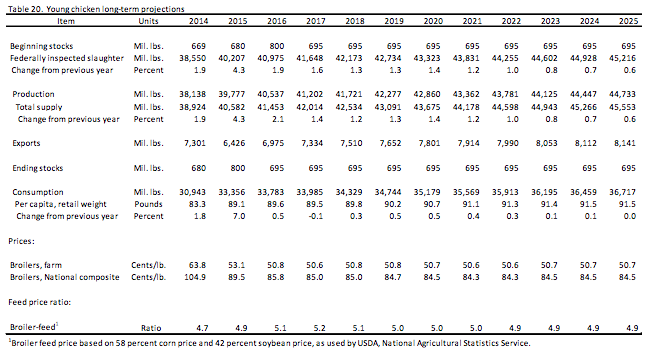
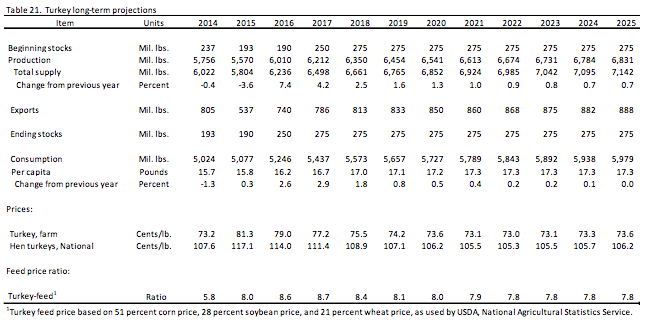
The USDA produces a 10-year forecast for many agricultural indicators, including meat production and consumption.
Excerpts:
The U.S. livestock sector is projected to increase production over the next decade, an expansion that reflects several factors. Feed costs have fallen from recent highs and are projected to rise only moderately over the next 10 years. Also, demand for meats and dairy products in both the domestic market and for export is projected to be strong. As a result, total U.S. red meat and poultry production rises over the projection period. Milk production also increases over the next decade.
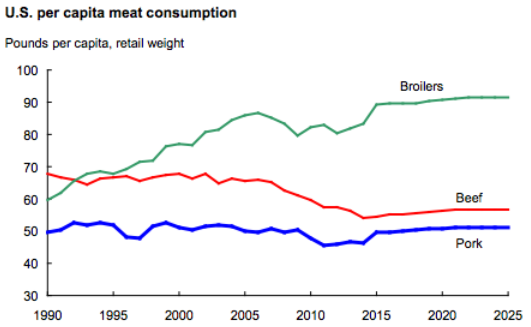
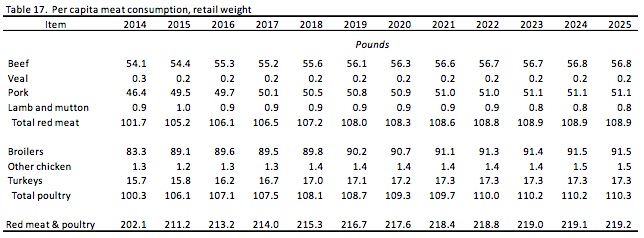
As production increases, consumption of red meats and poultry is projected to rise from about 211 pounds per person in 2015 to about 219 pounds toward the end of the projection period. Although this level consumption is below those in 2004-07 of more than 221 pounds per person, it represents a rebound from a low of 202 pounds per person in 2014.
src:
Paul Westcott and James Hansen, February 2016.
“USDA Agricultural Projections to 2025”
p.39, 40, 44-47, 83-92
contact: westcott@ers.usda.gov, jhansen@ers.usda.gov
*
The USDA collects data on food and nutrient availability for consumption, which they describe as proxies for actual consumption at the national level.
Red Meat, Poultry, and Fish
1909-2013, pounds available/consumed per year, broken down by type of meat
Also available in the following Google Sheet.
original source file
src:
USDA Economic Research Service. Accessed June 6, 2016.
“Food Availability (Per Capita) Data System.”
Organic Food
Research firm TechSci forecasts that the global organic food market will have a CAGR over 16% during 2015-2020.
src:
TechSci Research. 2015.
“Global Organic Food Market Forecast & Opportunities, 2020.”
via [PR Newswire]
Media Contact: Ken Mathews ken.mathews@techsciresearch.com
Previous forecasts had estimated the US CAGR for 2013-2018 to be 14%.
EMAILED THE FIRM 6/21 TO SEE IF THEY CAN SHARE THE MOST RECENT US FIGURES
UPDATE: Karan Chechi, Research Director with TechSci Research, confirms by email that the US market will have a CAGR of 16.27% during 2015-2020.
src:
Email correspondence via Kalpana Verma, June 23, 2016
citing Karan Chechi
*
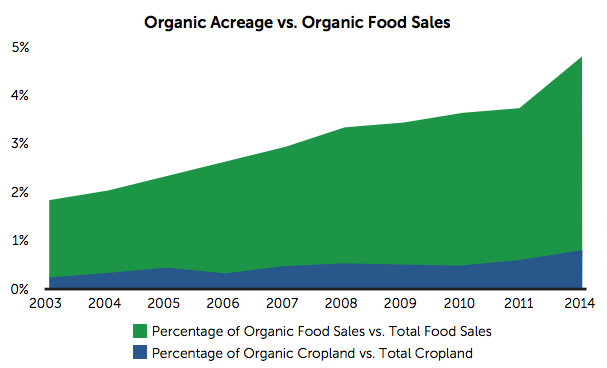
The Organic Trade Association conducts an annual survey describing the previous year’s organic food sales. In 2015, organic food sales were up 11% over the previous year (the overall food market’s growth was just 3%). Nearly 5% of all the food sold in the US in 2015 was organic.
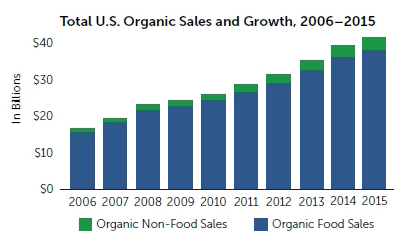
Organic fruits and vegetables remain the largest of all the major organic categories, with sales up 10.5%. Almost 13% of the produce sold in the US is now organic.
OTA also reports short-comings in the organics supply chain. Although organic food sales make up nearly five percent of total food sales, acreage devoted to organic agriculture is less than one percent of total U.S. cropland.
src:
Organic Trade Association. May 19, 2016.
“U.S. organic sales post new record of $43.3 billion in 2015.”
and
“U.S. Organic State of the Industry.” Accessed June 21, 2016.
Media Contact: Maggie McNeil, mmcneil@ota.com
In previous years, the OTA has given very short forecasts for growth.
EMAILED 6/21 TO INQUIRE ABOUT RECENT FORECASTS, AND REQUESTING A COPY OF THE EXECUTIVE SUMMARY.
UPDATE: NO OFFICIAL FORECASTS, BUT THEY EXPECT GROWTH TO REMAIN STRONG FOR THE FORESEEABLE FUTURE
*
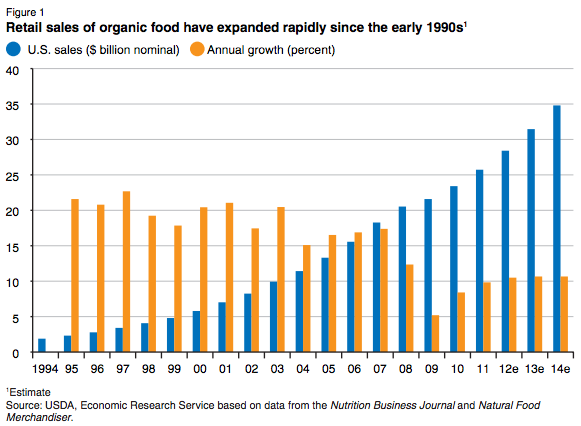
U.S. sales of organic products were an estimated $28.4 billion in 2012—over 4 percent of total food sales—and will reach an estimated $35 billion in 2014, according to the Nutrition Business Journal.
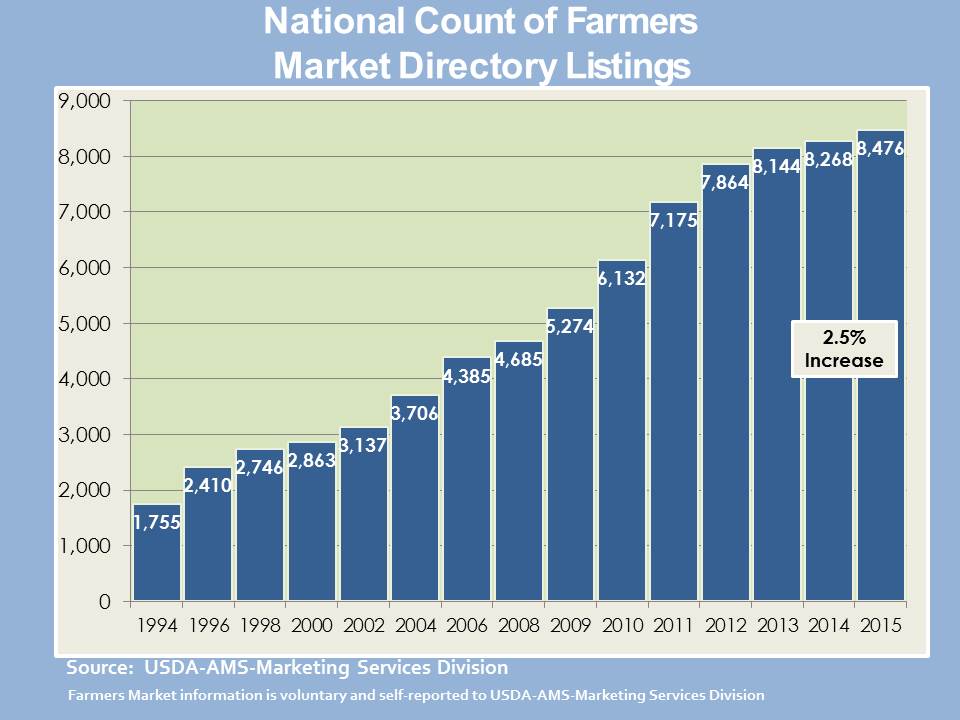
The number of farmers’ markets in the United States has grown steadily from 1,755 markets in 1994, when USDA began to track them, to over 8,144 in 2013
src:
USDA. May 2016.
“Organic Market Overview.”
Contact: Catherine Greene, cgreene@ers.usda.gov
http://www.ers.usda.gov/ers-staff-directory/catherine-greene.aspx
*
src:
Catherine Greene, et al. February 2016.
“Economic Issues in the Coexistence of Organic, Genetically Engineered (GE), and Non-GE Crops.” Report EIB-149.
Economic Research Service/USDA
p.8, 10
*
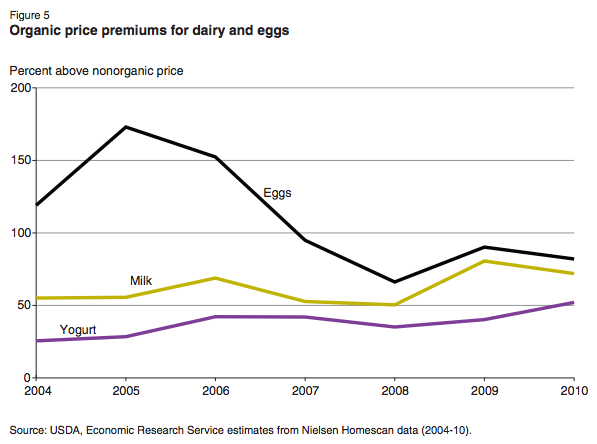
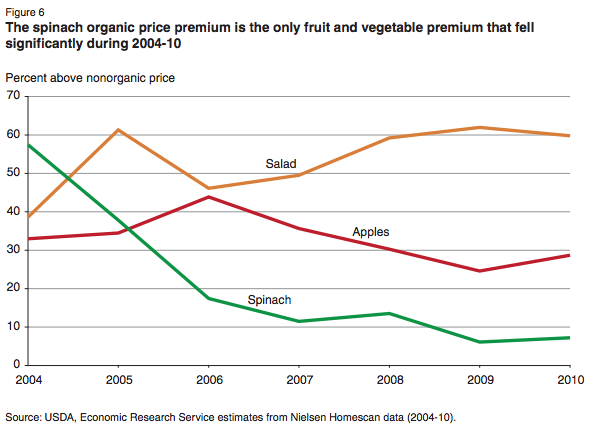
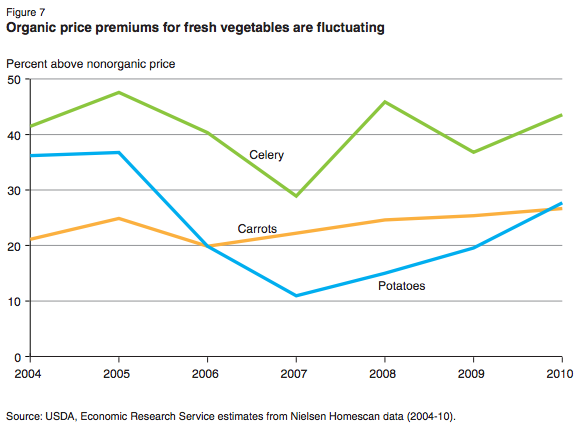
Nielsen Homescan data is an annual, nationally representative panel of households’ retail food purchases. USDA organic food certification began in 2002, and Nielsen started tracking whether a product was organic in 2004. USDA’s Economic Research Service conducted a study using the Nielsen data from 2004 through 2010 to compare sales data over the period. Each product tracked was ranked by percent of organic sales, percent of organic purchase quantity, and percent of organic transactions (Table 1).
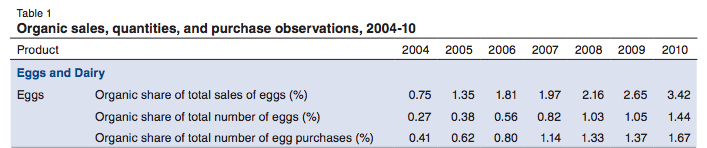
The study also calculated price premiums for organic products (Table 2).
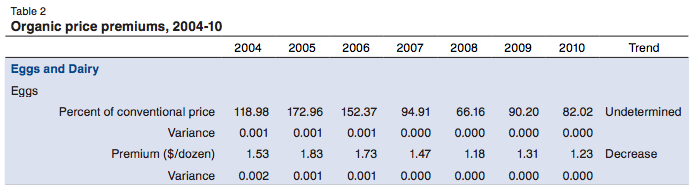
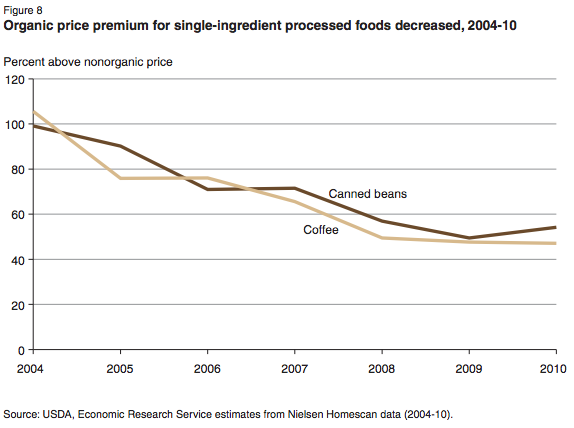
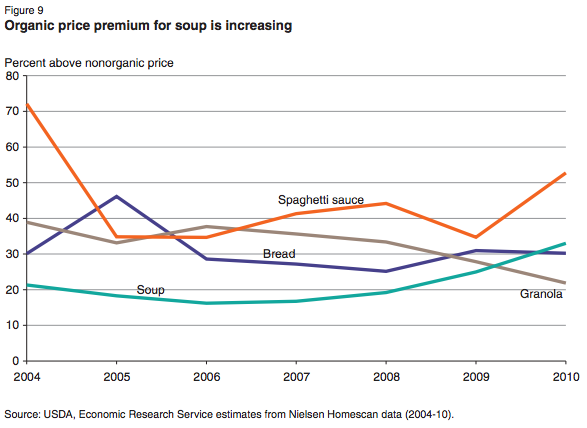
Products tracked include eggs and dairy, fruits and vegetables, single-ingredient processed foods (eg: canned beans, coffee), multi-ingredient processed food (eg: bread), and baby food. Only products with UPCs were tracked (no premium meat and poultry were tracked).
src:
Andrea Carlson and Edward C. Jaenicke. May 2016.
“Changes in Retail Organic Price Premiums from 2004 to 2010.”
Economic Research Report No. ERR-209. USDA.
Summary and Appendix tables available here.
TO-DO: EXTRACT DATA FROM PAPER, AND/OR CONTACT NIELSEN TO SEE IF WE CAN GET POST-2010 DATA.
*
USDA NASS Organic Production Survey
The USDA’s National Agricultural Statistics Service (NASS) has conducted three surveys of organic agricultural production in the US, first in 2008, then 2011, then 2014. Some data on organics production were also gathered as part of the 2012 Agricultural Census.
Organic Land Acres
2008: 4,077,337
2011: 3,648,896
2014: 3,670,560
Market Value of Organic Agricultural Products Sold
Year — Value of Crops sold (B) — Value of Livestock Poultry and Products Sold — Total Value of Ag Products Sold
2008 — 2.0 — 1.2 — 3.2
2011 — 2.2 — 1.3 – 3.5
2012 — N/A — N/A — 3.1
2014 — 3.3 — 2.2 — 5.5
src:
USDA NASS. September 17, 2015.
“Data Release: 2014 Organic Survey.”
Contact: Adam Cline, adam.cline@nass.usda.gov
*
The USDA Economic Research Service (ERS) has collected some historic data describing the extent of organic farmland acreage and livestock in the US. Data is available 1992-2011, and imported to the following Google Sheet.
src:
USDA ERS. Accessed June 2016.
“Organic Production — Overview”
Table 2: U.S. certified organic farmland acreage, livestock numbers, and farm operations [XLS]
contact: Catherine Greene, cgreene@ers.usda.gov
*
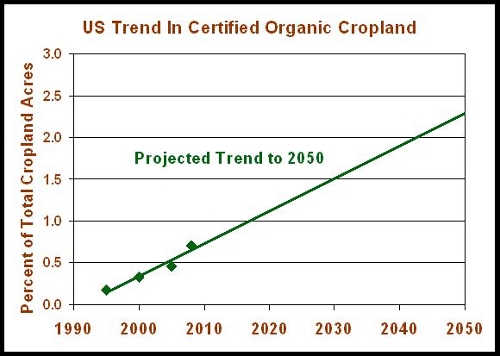
In fact, all those Organic acres put together still only represent 0.71% of the 370 million acres of US cropland. The amount of that cropland that was actually harvested in 2008 represented only 0.52% of the total. Organic cropland area has been growing, but only at 0.0385% per year on an absolute basis (see chart below). At that rate of growth, US Organic cropland will still represent less than 2.5% of the total in the year 2050. The math suggests that Organic will remain as a small niche market.
src: Steve Savage. August 2011.
“Why Does Organic Seem Larger Than It Is?”
contact: savage.sd@gmail.com
citing: USDA-NASS and USDA-ERS data
NOTE: Per his bio (last slide), Steve Savage is an independent agricultural technology consultant. He does NOT see organics as a viable solution for the overall sustainability and production challenges faced on a global level.
Genetically Engineered Crops
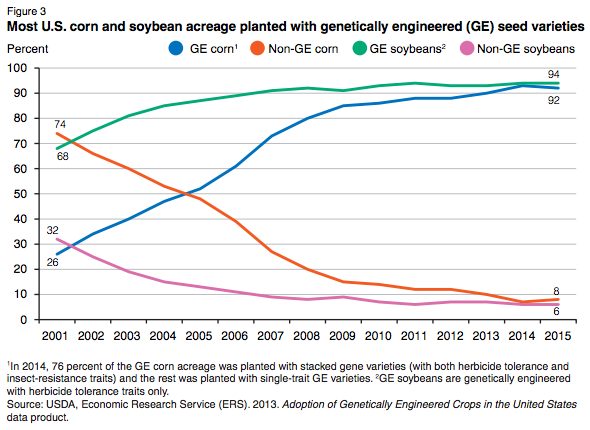
GE corn and soybeans are grown on more acres than any another crop in the United States. GE varieties of corn and soybeans were commercialized in 1996. By 2001, a quarter of the U.S. corn crop and over two-thirds of the soybean crop were planted with GE seed (fig. 3). In 2015, U.S. producers planted 89 million acres of corn and 85 million acres of soybeans with GE seed, accounting for 92 and 94 percent of the total planted acres for these crops (USDA-National Agricultural Statistics Service, 2015a) (fig. 3). One of the major uses of these crops is for animal feed, but they are also used to produce vegetable oil and as ingredients in many processed foods. A substantial amount of the corn crop—44 percent in 2015—is now used to produce alcohol for fuel use (USDA-ERS, 2015a).
src:
Catherine Greene, et al. February 2016.
“Economic Issues in the Coexistence of Organic, Genetically Engineered (GE), and Non-GE Crops.” Report EIB-149.
Economic Research Service/USDA
p.11
Farmer’s Markets
The USDA has maintained a registry of farmers markets at least since 1994.
src:
USDA Agricultural Marketing Service. Accessed June 24, 2016.
Linked via “Farmers Markets and Direct-to-Consumer Marketing.”
JPG src
*
8,268 farmers’ markets operating in 2014, up 180 percent since 2006. Martinez et al. (2010)
In 2012, 7.8 percent of U.S. farms sold food through local food marketing channels, including direct-to-consumer (DTC) marketing channels (e.g., farmers’ markets, roadside stands, u-pick) and intermediated marketing channels (e.g., direct to restaurants, institutions or to regional food aggregators).
Regional food hubs are enterprises that aggregate locally sourced food to meet wholesale, retail, institutional and even individual demand (see box, “Regional Food Hubs”). Since 2006-07, the number of food hubs has increased by 288 percent (fig. 1).
Farm to school programs have multiple objectives, ranging from nutrition education to serving locally sourced food in school meals. According to the USDA Farm to School Census, 4,322 school districts have farm to school programs, a 430-percent increase since 2006 (fig. 1).
src:
USDA. January 2015.
“Trends in U.S. Local and Regional Food Systems.”
*
TO-DO: LOOK INTO THE Food Marketing Institute (2011 Trends survey)
Community Supported Agriculture
2010 Stats that might be available as series:
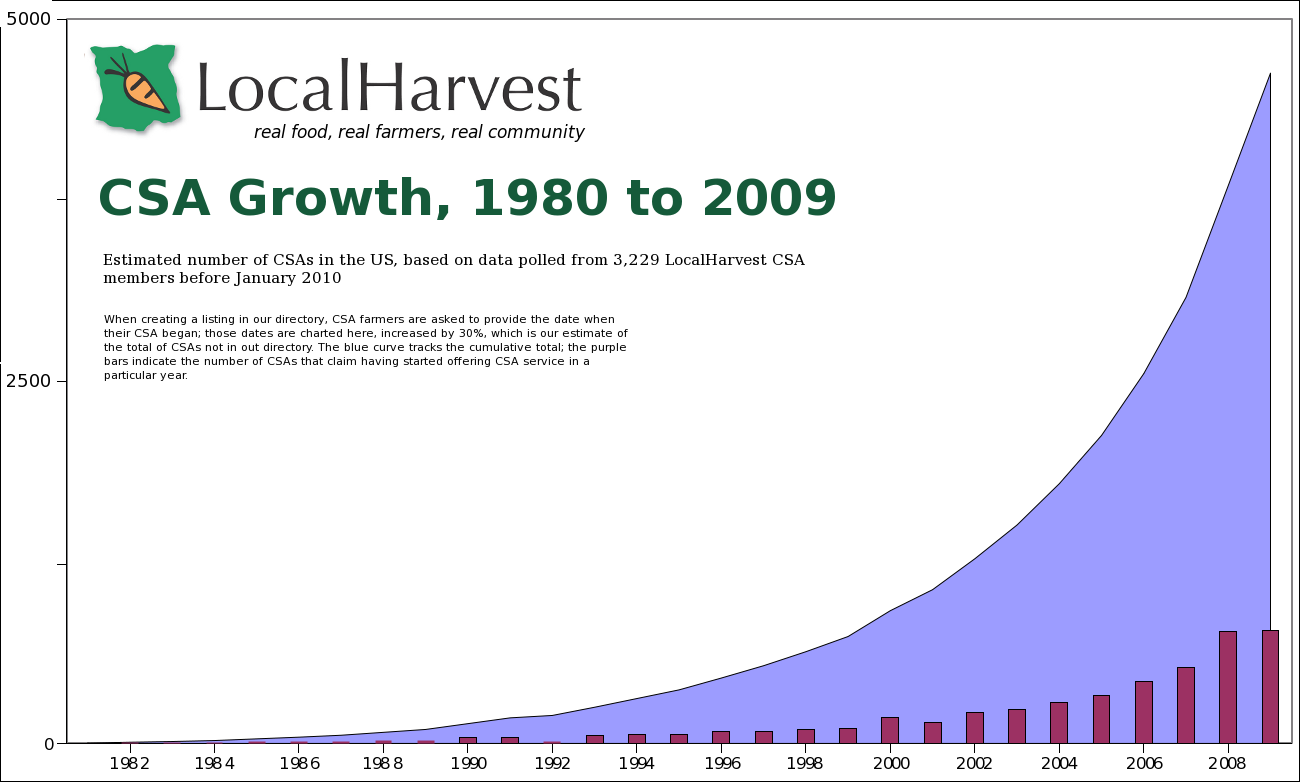
3,229 CSAs listed with LocalHarvest
the average sized CSA in the U.S. has 96 members
the median is 47
total number of shares offered by our CSAs is about 390,000
“If the number of CSAs keeps growing at the same rate as CSAs have been joining our site over the last three years, by 2020, there will be over 18,000 CSAs in the U.S.”
EMAILED LOCALHARVEST 6/24/16 TO INQUIRE ABOUT ANNUAL TALLIES AND RECENT FIGURES.
Guillermo Payet, President of LocalHarvest
gpayet@localharvest.org
src:
LocalHarvest, January 2010.
“LocalHarvest Newsletter, January 28, 2010”
image URL
UPDATE: LocalHarvest shared the following set of CSA and farmers’ markets tallies from their directory.
Src:
LocalHarvest. July 2016.
Private communication with Guillermo Payet, gpayet@localharvest.org
*
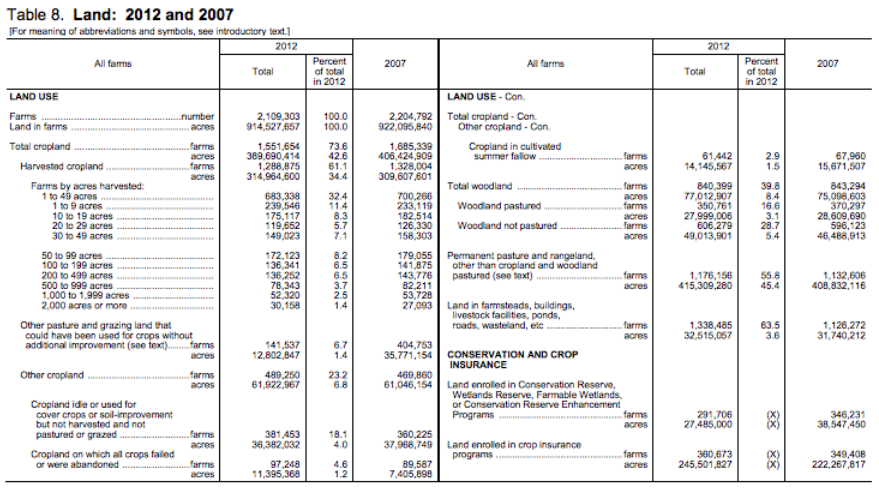
Data collected in 2012 by the U.S. Department of Agriculture indicates that 12,617 farms in the United States reported marketing products through a community supported agriculture (CSA) arrangement, a .5 percent increase over the 12,549 farms marketing through CSAs in 2007.
2012
Table 43. Selected Practices: 2012. In 2012 Census of Agriculture – State Data. p. 558. (2014) U.S. Department of Agriculture, National Agricultural Statistics Service.
See the column titled, “Marketed products through Community Supported Agriculture (CSA) (farms)” to find the number of farms that answered yes to the question, “At any time during 2012, did this operation market products through a community supported agriculture (CSA) arrangement?”
See also: 2012 Agricultural Census Home page
2007
Table 44. Selected Practices: 2007. In 2007 Census of Agriculture – State Data. p. 606. (2009) U.S. Department of Agriculture, National Agricultural Statistics Service.
See the column titled, “Marketed products through Community Supported Agriculture (CSA) (farms)” to find the number of farms that answered yes to the question, “At any time during 2007, did this operation market products through a community supported agriculture (CSA) arrangement?”
See also: 2007 Agricultural Census Home page
src:
AFSIC staff. April 2016.
“Community Supported Agriculture: Surveys and Statistics.”
USDA National Agricultural Library. Alternative Farming Systems Information Center.
*
The USDA Agricultural Marketing Service maintains several local food directories, including one for CSAs.
For questions about the Local Food Directories, please contact:
Edward Ragland, Economist
directoryupdates@ams.usda.gov
202.690.1327
EMAILED EDWARD RAGLAND 6/24/16 TO INQUIRE ABOUT HISTORIC STATISTICS.
src:
“Local Food Directories”
USDA Agricultural Marketing Service. Accessed June 24, 2016.
Food Miles
CC NOTES: Having trouble finding good time series data on this. The sources below cite data from individual locations (mostly iowa). Haven’t found any nationally representative time series averages. I wrote to Rich Pirog (6/24/16) at the Leopold Center to inquire about any national time series data, and he referred me to the paper by Weber and Matthews, below. They cite somewhat limited CFS data. I also emailed Matthews and he said it should be possible to pull additional CFS data for a more complete picture of change over time. See my additional notes below the excerpts for that paper.
*
“Globalization from 1997 to 2004 increased the average distance moved by food by around 25%, from 1640 km (1020 mi) directly and 6760 km (4200 mi) in total to 2050 km (1250 mi) directly and 8240 km (5120 mi) in total.”
“We suggest that dietary shift can be a more effective means of lowering an average household’s food-related climate footprint than “buying local.” Shifting less than one day per week’s worth of calories from red meat and dairy products to chicken, fish, eggs, or a vegetable-based diet achieves more GHG reduction than buying all locally sourced food.”
Src:
Christopher L. Weber and H. Scott Matthews. April 2008.
“Food-Miles and the Relative Climate Impacts of Food Choices in the United States.”
Environ. Sci. Technol., 2008, 42 (10)
Citing: the US Census [Commodity Flow Survey] and Department of Commerce [Input-Output Accounts Data]
EMAILED THE PAPER AUTHORS 6/27/16
chris@2degrees-investing.org, hsm@cmu.edu
Neither of the authors have done any other work with this data, but Scott Matthews says it should be possible for us to pull additional historic CFS data to get a bigger picture of the change over time. Matthews says that they performed an “embedded transportation” calculation (total miles shipped from beginning to end) that wouldn’t show up in the CFS data. But we should be able to perform that same calculation using an input-output model (and perhaps referring to the discussion in Matthews’ paper.
TO-DO: PULL ADDITIONAL HISTORIC CFS DATA TO INFORM OUR EXTRAPOLATION.
*
Several surveys from different wholesale markets in the United States show that fruits and vegetables are traveling between 2,500 and 4,000 kilometers from farm to market, an increase of roughly 20 percent in the last two decades.
src:
Brain Halweil. 2002.
“Home Grown: The Case for Local Food in a Global Market.”
Worldwatch Paper 163. Worldwatch Institute.
citing:
United States surveys from Hora and Tick, op. cit. note 2, and Rich
Pirog et al., “Food, Fuel, and Freeways: An Iowa Perspective on How Far Food Travels, Fuel Usage, and Greenhouse Gas Emissions” (Ames, Iowa: Leopold Center for Sustainable Agriculture, Iowa State University, 2001), pp. 1, 2
*
A food mile is the distance food travels from where it is grown or raised to where it is ultimately purchased by the consumer or other end-user. One 1969 estimate of miles traveled by food in the United States cited an average distance of 1,346 miles (47). Calculations
made by John Hendrickson using a 1980 study examining transportation and fuel requirements estimated that fresh produce in the United States traveled an estimated 1,500 miles (48). Fresh produce arriving in Austin, Texas, was estimated to travel an average of 1,129 miles (49). An analysis of the USDA Agricultural Marketing Service’s
1997 arrival data from the Jessup, Maryland, terminal market found that the average pound of produce distributed at the facility traveled more than 1,685 miles (50). This same study showed the average distance for fruits to be transported was 2,146 miles, while
the average for vegetables was 1,596 miles (51).
src:
Rich Pirog, et al. 2001.
“Food, Fuel, and Freeways: An Iowa perspective on how far food travels, fuel usage, and greenhouse gas emissions.”
Leopold Center. Iowa State University.
p.9
contact: rspirog@iastate.edu
citing:
47: U.S. Department of Defense. 1969. U.S. Agriculture: Potential Vulnerabilities. Stanford Research Institute, Menlo Park, CA.
48: Hendrickson, John. 1996. “Energy use in the U.S. Food System: A Summary of existing research and analysis.” Sustainable Farming-REAP-Canada. Ste. Anne-de’Bellevue, Quebec. Vol 7, No 4. Fall 1997.
49: ibid.
50: Hora, Matthew, and Jody Tick. 2001. “From Farm to Table: Making the Connection in the Mid-Atlantic Food System.” Capital Area Food Bank of Washington D.C. report.
*
Recent studies have shown that this distance has been steadily increasing over the last fifty years. Studies estimate that processed food in the United States travels over 1,300 miles, and fresh produce travels over 1,500 miles, before being consumed.
src:
Holly Hill. 2008.
“Food Miles: Background and Marketing.”
also citing:
The Leopold Center, Iowa State University (a 1998 study looking at the distance that 30 convention fresh produce items traveled to reach the Chicago Terminal Market).
and citing:
statistics on the volume of world agricultural trade going back to 1961
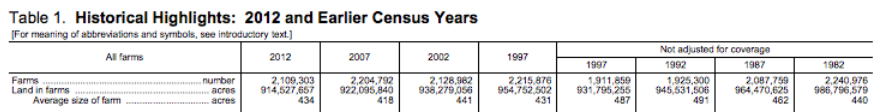
Farm Size and Diversity
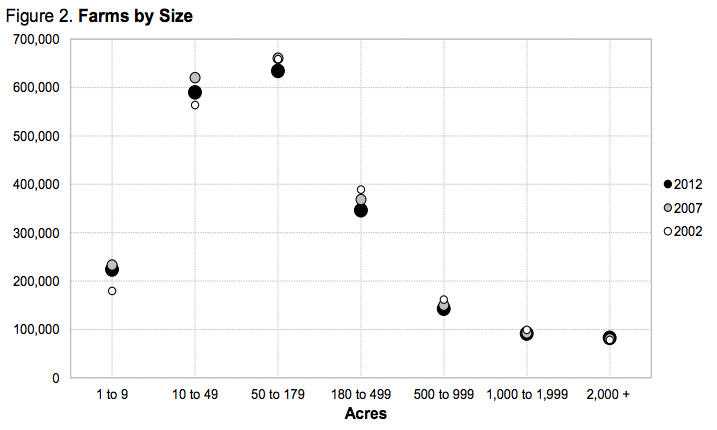
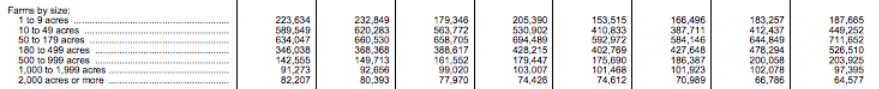
TO-DO: LOOK INTO OLDER AG CENSUSES FOR FARMS-BY-SIZE DATA
src:
USDA. May 2014.
“2012 Census of Agriculture.”
Grocery Delivery Services
Brick Meets Click forecasts that online grocery spending in the US will reach between 11% and 17% in most markets by 2023. Up from 4% in 2014.
src:
Bill Bishop. October 2014.
“What’s ahead for online grocery? Updated growth forecast & implications?” Slide 2. Brick Meets Click.
NOTE: Brick Meets Click is a research and consulting firm that tracks online grocery sales and advises businesses on meeting this demand.
Meals at/away from home
The average U.S. consumer spent 9.8 percent of disposable personal income (income available after taxes) on all food in 2007—5.7 percent on food at home and 4.1 percent on food away from home. The percentage of disposable income spent on all food, food at home, and food away from home remained constant from 2005 to 2007.
src:
Annette Clauson. September 2008.
“Despite Higher Food Prices, Percent of U.S. Income Spent on Food Remains Constant.”
USDA Economic Research Service.
*
Food purchased away from home as a share of household food expenses
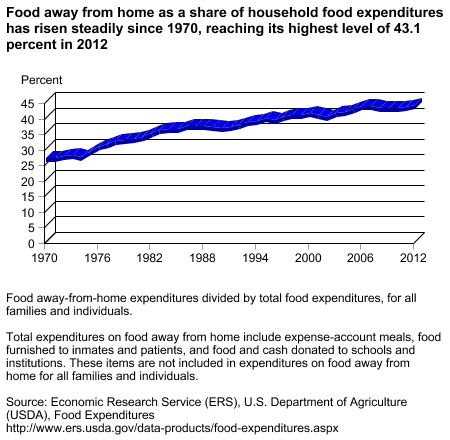
Chart Data available in the following Google Sheet.
src:
Economic Research Service. Accessed June 6, 2016.
“Food-Away-from-Home”
US Department of Agriculture, Food Expenditures.
*
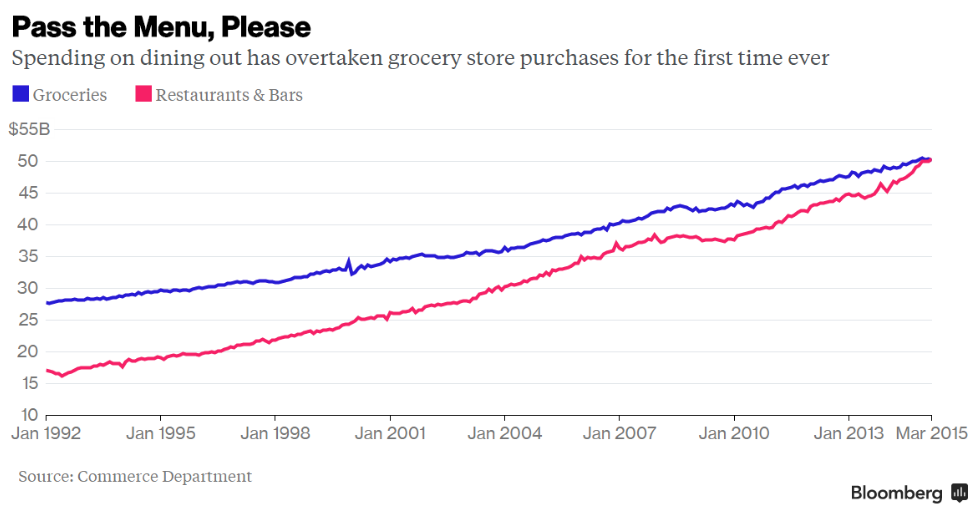
Spending on dining out vs. grocery store purchases (total in the US, NOT per capita)
src:
Michelle Jamrisko. April 14, 2015.
“Americans’ Spending on Dining Out Just Overtook Grocery Sales for the First Time Ever.”
Bloomberg
citing:
Commerce Department
*
The percentage of dinners eaten at home that were actually made at home in the U.S.
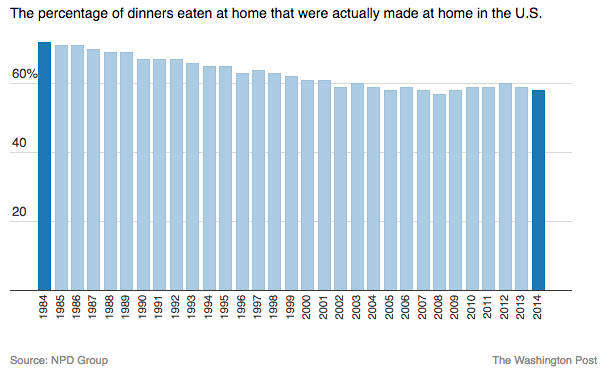
NOTE: No/few numeric values in this article.
TO-DO: CONTACT NPD FOR THE ACTUAL YEARLY VALUES
src:
NPD Group
via:
Roberto A. Ferdman. March 5, 2015.
“The Slow Death Of The Home-Cooked Meal.”
The Washington Post
*
Daily energy intake of US adults by food source, 1965-1966 to 2007-2008
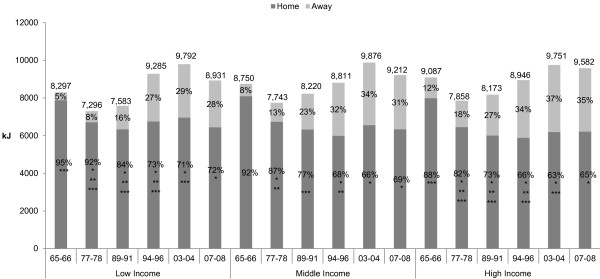
Figure 1
Trends in Time Spent Cooking for US adults from 1965–1966 to 2007-2008
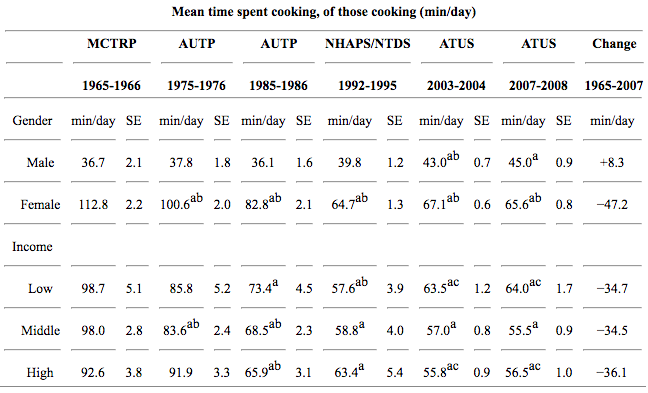
Table 2
src:
Lindsey P. Smith, et al. 2013.
“Trends in US home food preparation and consumption: analysis of national nutrition surveys and time use studies from 1965–1966 to 2007–2008.”
Nutrition Journal, 12(45).
citing the following data sources for Figure 1:
Household Food Consumption Survey (HFCS) of 1965–1966 (n=4,114), Nationwide Food Consumption Survey (NFCS) of 1977–1978 (n=12,935), Continuing Survey of Food Intakes by Individuals (CSFII) of 1989–1991 (n=7,750), CSFII of 1994–1996 (n=6,894), National Health and Nutrition Examination Survey (NHANES) of 2003–2004 (n=3,138), and NHANES of 2007–2008 (n=3,734).
data sources for Table 2:
Multinational Comparative Time-Budget Research Project (MCTRP) of 1965–1966 (n=1,888), American’s Use of Time Project (AUTP) of 1975–1976 (n=3,190), AUTP of 1985–1986 (n=2,391), National Human Activity Pattern Survey (NHAPS) of 1992–1994 and National Time Diary Study (NTDS) of 1994–1995 (n=6,291), American Time Use Study (ATUS) of 2003–2004 (n=24,382), and ATUS of 2007–2008 (n=17,282). Percentages and mean time spent cooking are adjusted to be nationally representative.
Scenarios
The Institute For The Future has published a set of scenarios imagining how we might experience food in the next decades.
Excerpts:
We’re entering a curious world of vibrating forks and designer orange juice, of microfarming and meat printing, of virtual meals and drone delivery. How will these technologies interact with changing human needs and desires? In this future, what lengths will we go to for to convenient food experiences? How will we know if our food was sustainably produced? How fresh can we get it, and what will that mean? How will we define satisfaction?
In combination with our map of the decade, Seeds of Disruption: How Technology is Remaking the Future of Food, these forecast perspectives offer a tool for exploring the edges of technological possibility in food and developing insights into how to use them to meet human values and needs.
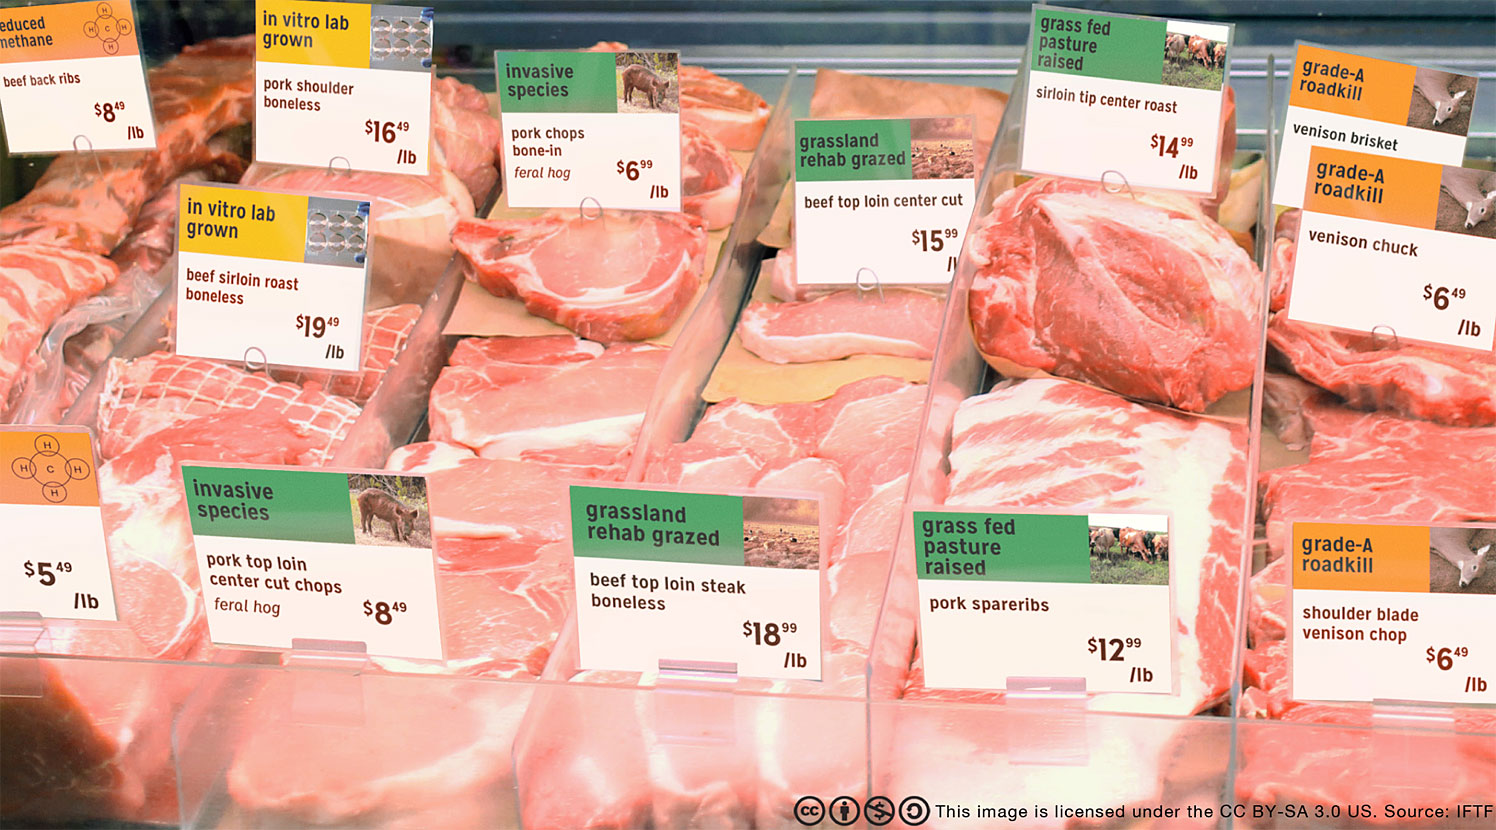
Concepts such as carbon footprints and food miles, humane treatment of animals, ecosystems management, and waste reduction are all big concerns for eaters today. However, as our ability to take all of these to the extreme increases, we’ll see the tradeoffs and choices become more dramatic, creating diverse new sustainability standards. While eating road-kill and invasive species are, today, fringe behaviors, in a decade, they could become commonplace.

The ability to directly and precisely manipulate the human senses will open a new frontier for creating food experiences. Initial attempts to rewire taste will likely be around curbing the hardwired drives for fats and sugars to improve health. However, as we develop a more nuanced understanding of both the chemical and psychological components that make up how we perceive food, people will start hacking the senses for many different goals—maximizing bliss, recreating nostalgic meal experiences, or making healthy, but bland, foods more enjoyable.

Freshness-sensing packaging and produce stickers will provide more precise expiry information than traditional “best by” labels. However, this information has the potential to overload consumers with metrics and considerations that don’t help them make decisions. To truly make this information actionable, people will need solutions that make interacting with the new data intuitive and enjoyable.

In a decade, new technologies of coordination will make it possible to order almost anything from anywhere and have it arrive at a designated place and time. New platforms and smart logistics systems are poised to disrupt the largely untapped market for fresh food delivery. As the cold chain expands in places such as Brazil or China, rapidly urbanizing areas might leapfrog the less efficient supermarket model in favor of streamlined food delivery systems.
Src:
Institute for the Future. October 2013.
“Seeds of Disruption: Forecast Perspectives, Overview.”
“Artifacts from the Future.”
