

Smart Clothing and Fitness Devices
Summary
Smart clothing seems to be just around the corner, with several companies already selling specialty items (athletic wear, baby clothes, etc) embedded with sensors. However, quantitative forecasts describing the prevalence of smart clothing in the next 10 years or so are hard to find. Gartner made a forecast to 2016 back in 2014. Tractica has a forecast to 2020. Both forecasts describe millions of units shipped worldwide. Although it’s difficult to extrapolate market penetration, both reports suggest that smart clothing will be more prevalent than wearable devices. Other research firms and analysts are skeptical of such a swift uptake by smart garments, instead forecasting dominance by other wearable devices.
Research Excerpts
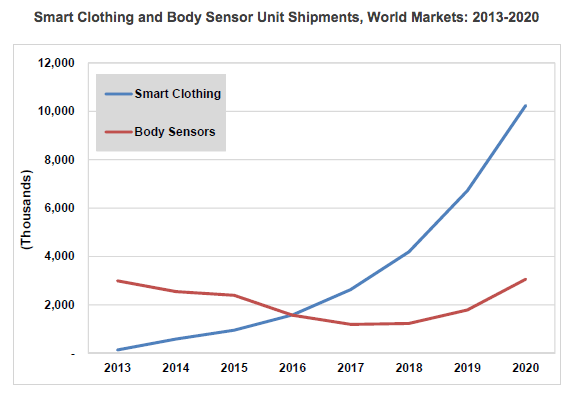
Tractica forecasts that smart clothing shipments will grow from 140,000 units in 2013 to 10.2 million units by 2020, while body sensor shipments will decrease from 3.0 million units in 2013 to 1.2 million by 2017, before rising again to 3.1 million units in 2020.
Src:
Tractica. May 4, 2015. “The Wearable Devices Market is Poised for Expansion into Smart Clothing and Body Sensors.”
Executive Summary
Chart from above report:
[via Global Information]
*
| Worldwide Wearable Electronic Fitness Devices Shipments (millions of units) | ||||
| Device Category | 2013 | 2014 | 2015 | 2016 |
| Smart Wristband | 30 | 20 | 17 | 19 |
| Sports Watch | 14 | 18 | 21 | 24 |
| Other Fitness Monitor | 18 | 20 | 12 | 15 |
| Chest Strap | 11 | 12.1 | 8 | 7.3 |
| Smart Garment | 0.01 | 0.1 | 10.1 | 26 |
| Total Market | 73.01 | 70.2 | 68.1 | 91.3 |
Src:
Gartner. November 18, 2014. “Gartner Says in 2015, 50 Percent of People Considering Buying a Smart Wristband Will Choose a Smartwatch Instead.”
Note: Angela McIntyre, Gartner research director – gave an interview to The Guardian. Might be available for comment.
*
Growth will be “largely driven by the sales of wrist-based trackers, while hundreds of thousands of connected garments used by professional sports teams showcase wearable technology’s most advanced capabilities.” Hundreds of thousands of thousands of connected garments is hardly a drop in the ocean compared to the millions of Fitbits, Xiaomis, Apple Watches, Jawbones and other devices which will be coining in the revenue by 2020. [emphasis mine]
Src:
James Stables. November 18, 2015. “Juniper Report Skeptical on Smart Clothing but Says Fitness Trackers are Set to Soar.” Wearable.com.
*
In our latest smart glasses report, we expect over 3 million smart glasses to be in use in enterprise by 2018, with nearly 6 million users. [worldwide, I think]
Src:
Juniper Research. 2015. “The World In 2020 – A Technology Vision.”
Note: The White paper seems to be referring to this paid research report.
*
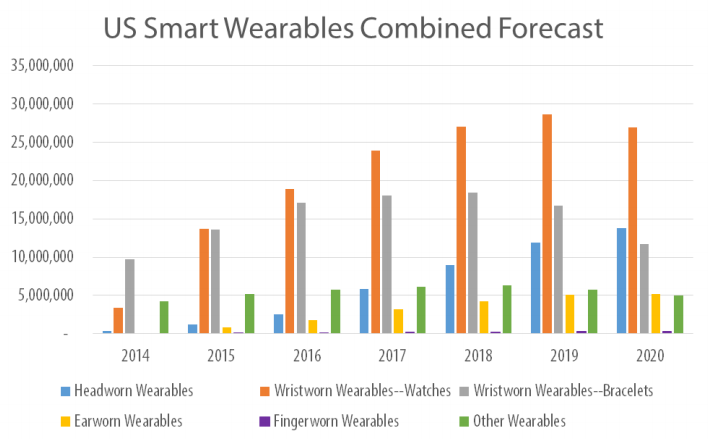
The US market for wearables is forecast to evolve more quickly than worldwide, leading to a peak of 68.3 million units in 2019, then dropping to 62.9 million in 2020.
Smart watches will be the top category as of this year in the US, followed by smart bands/bracelets.
In 2020, headworn wearables are expected to become the number two segment.
Src:
Bob O’Donnell. May 2015. “The Slow Build: Smart Wearables Forecast, 2014-2020.” Technalysis Research.
Note: This report does not include clothing with embedded sensors. Bob O’Donnell is skeptical of the ability of smart clothing to surpass other wearables in the foreseeable future.
Tech Research Firms’ Annual Predictions
NYT’s Bits blog covered the recently released annual prediction reports from IDC, Gartner, and Forrester. IDC and Gartner’s reports include several 35 year predictions. Forrester’s report focuses on 2016, but reinforces the predictions of the other firms.
Although we’re generally after forecasts that address the everyday life of the average American, the forecasts in this set have broad economic and employment implications that certainly will affect a large number of people, and certainly the technology tools we use every day.
IDC’s report features several predictions for the 20182020 period, meant to provide guidance for business and industry strategists in the coming year. Here are a few excerpts via Bits as well as the original report:
•By 2018, corporations pursuing digital transformation strategies would “more than double the size of their software development teams.”
•By 2018, the number of Internet of Things devices will more than double, prompting the development of 200,000 new apps. By 2020, devices will triple and apps will exceed 250,000.
•By 2018, 65% of all IT assets used by companies will be housed offsite in collocation, hosting, and cloud data centers and one third of IT “staff” will actually be employees of organizations’ third party managed service providers.
•By 2020, more than 30 percent of today’s tech suppliers will “not exist as we know them today,” having been acquired or failed.
•By 2020, spending on cloud services and related hardware and software will be more than $500 billion, three times the current level.
•By 2020, providers of underlying cloud infrastructure will significantly consolidate,” with “six or fewer cloud platform vendors” holding 80 percent or so of the market. Probably Amazon, Microsoft, Google, Salesforce, IBM, Alibaba and Tencent.
•By 2020, over 70% of 3rd Platform IT spending will be driven by doing entirely new things, rather than on using new technologies to do traditional things in a new way.
•By 2020, 50% or more of e-commerce transactions will be enabled or influenced by Facebook and other regional social network leaders (e.g., Tencent’s Weibo in China).
•By 2020, one of the more frenetic IoT segments, wearables, will consolidate, as over half of today’s players will exit the market.
Gartner issued a similar set of predictions to 20182020, including the following:
•By 2018, 20 percent of business content will be authored by machines (eg: shareholder reports, legal documents, market reports, press releases, articles and white papers).
•By 2018, six billion connected things will be requesting support.
•By 2018, more than 3 million workers globally will be supervised by a “robo-boss.”
•By year-end 2018, 20 percent of smart buildings will have suffered from digital vandalism.
•By 2018, 45 percent of the fastest growing companies will have fewer employees than instances of smart machines (eg: fully automated supermarket, drone-only surveillance services).
•By year-end 2018, customer digital assistant will recognize individuals by face and voice across channels and partners.
•By 2018, two million employees will be required to wear health and fitness tracking devices as a condition of employment (eg: emergency responders, pro athletes, political leaders, airline pilots, industrial workers, remote field workers).
•By 2020, autonomous software agents outside of human control will participate in five percent of all economic transactions (eg: banking, insurance, markets, exchanges, crowdfunding).
•By 2020, smart agents (virtual personal assistants) will facilitate 40 percent of mobile interactions, and the post-app era will begin to dominate.
•Through 2020, 95 percent of cloud security failures will be the customer’s fault.
Forrester’s report only looks out as far as 2016, and doesn’t offer as many numeric predictions, but the concepts are similar. Excerpts:
•Leaders will understand and anticipate individual needs to deliver personalized experiences, sharply increasing their lead in the market.
•We will see extraordinary leadership disruption as companies adapt to a customer-led market.
•Leaders will invest in culture to accelerate both the pace of change and their speed of business.
•Cutting-edge algorithms will give leaders a leg up over competitors drowning in data and using run-of-the-mill analytical tools.
•Privacy will move from a niche consideration to a value to which customers will respond.
Sources
Steve Lohr. November 4, 2015. “Digital Transformation Going Mainstream in 2016, IDC Predicts”. Bits. New York Times.
Frank Gens. November 2015. “IDC FutureScape: Worldwide IT Industry 2016 Predictions — Leading Digital Transformation to Scale.” IDC #259850.
October 6. “Gartner Reveals Top Predictions for IT Organizations and Users for 2016 and Beyond.” Gartner.
October 2015. “The 2016 Top 10 Critical Success Factors To Determine Who Wins And Who Fails In The Age Of The Customer.” Forrester.
Prosthetic Limbs Forecast to 2050
Summary
In searching for prosthetic device usage rates and forecasts, I’m finding that the most accessible type of data available describes incidence of limb loss and associated prostheses. Data describing usage rates for other types of prostheses and assistive devices has been harder to find (for example, dental prostheses, cochlear implants, artificial heart valves, etc). This summary and set of excerpts focuses on limb loss and associated prostheses.
The CDC, via its National Health Interview Survey, collected data on the number of people using upper and lower limb prostheses. Data was collected in the mid 1990s – I’m not sure if CDC has more recent (or older) figures. (Email inquiry on Oct 6, 2015. No reply as of Oct 8.)
The US Department of Health and Human Services has documented rates of amputation in the US via its Healthcare Cost And Utilization Project (HCUP), although this effort does not document rate of prostheses usage. Estimated rates of prosthesis usage by amputees vary widely.
The National Commission on Orthotic and Prosthetic Education (NCOPE) has published a workforce demand study forecasting prosthesis user figures through 2020. An academic study has forecast amputee figures to 2050. We could apply the usage rate used in the NCOPE study to extrapolate a number of users from that second study.
*
Follow-up Notes
CC emailed CDC. CC emailed reps from SFB’s Devices & Materials Committee and BMES’s Medical Devices Special Interest Group (including someone from FDA).
Donna Lochner (FDA) is not aware of any centralized repositories for overall prosthetics data, but she made a few suggestions by email: check the Center for Medicare and Medicaid Services (CMS) for the Medicare population, and individual registries by product areas (eg: INTERMACS for mechanically-assisted circulatory support devices; the Society for Thoracic Surgeons and the American College of Cardiology for transcatheter heart valves). Lochner thinks the highest volume implants are intraocular lenses, and this might be an area where CMS data would capture the vast majority of the implants.
Emailed William Polglase of CMS for assistance in interpretting data (10/15).
Emailed Medtech Solutions (recommended by BMES) to ask about general tallies.
Research Excerpts
Currently, there are an estimated 1.9 million people living with limb loss in the United States, almost half of whom are non-white. At its peak, an estimated 185,000 amputations occurred in 1996 in the United States.
Amputation rates in the total population (including individuals without diabetes, or with peripheral artery disease alone) are not known and active surveillance efforts do not exist.
Src:
Limb Loss Task Force/Amputee Coalition. 2012. “Roadmap for Preventing Limb Loss in America: Recommendations From the 2012 Limb Loss Task Force.”
*
82% [of amputations] are due to Peripheral Vascular Disease and Diabetes. More than 65 percent of amputations are performed on people age 50 and older.
While diseases such as diabetes and peripheral vascular disease are the leading causes of amputation, accidents and war continue to play a major role in driving the limb prosthetics market.
Technological growth and an increasing consumer base of amputees are bolstering the prosthetics market growth, according to an analysis from the business and research consulting firm Frost & Sullivan. The overall prosthetics market in the United States earned revenues of $1.45 billion in 2006 and estimates that number to reach $1.85 billion by 2013. The global dental prosthetics market is estimated to exceed $5 billion. Hip and knee replacements are big drivers of the orthopedic prosthetic market. Over 100,000 cochlea implants are currently in place globally. The limb future prosthetics devices and the accompanying services market are estimated to exceed $5 billion (of which an estimated $3 billion alone is in amputee patient services) in the U.S.
The lack of common standards, a common lexicon and common data collections negatively impact on the ability to assemble precise market data on limb prosthetics. A National Institutes of Health study concluded, “For example, documented rates of prosthesis use vary from 27 to 56 percent for upper-limb amputation (ULA) and from 49 to 95 percent for lower-limb amputation (LLA). A number of studies have attempted to identify variables that explain inconsistent use rates and identify persons less likely to wear and benefit from a prosthesis. Unfortunately, the existing literature is equivocal and limited by a number of factors.”
Research at the Bioengineering Institute of Worcester Polytechnic Institution, University of Utah, University of Washington and the University of Illinois at Chicago are current leaders in osseointegration and limb transplantation research.
Among the sources for this market analysis are:
Walter Reed Army Medical Center
Henry Jackson Foundation
Amputee Coalition of America
O&P Edge
The Press-Enterprise
Frost & Sullivan
Securities and Exchange Commission
Boston Globe
Aetna Insurance
Atlas of Prosthetics
National Institutes of Health
Disabled-World.com
One Source
ArmDynamics.com
some of the above tallies are from:
Persons Living with Limb Loss, 1996
National Health Interview Survey, Vital Statistics Report, Series 10, No. 200.
New Cases of Limb Loss, 1996
Health Care Utilization Project National Inpatient Sample (HCUP-NIS), 1996.
It is estimated that approximately 199,000 persons in the U.S. were using an artificial limb in 1994, with the majority using an artificial leg or foot (173,000).
Datasource: National Center for Health Statistics,
Disability Report. Table 1
EMAILED nhis@cdc.gov TO SEE IF ITS BEEN UPDATED
Src:
Dr. Grant McGimpsey and Terry C. Bradford. “Limb Prosthetics Services and Devices” [White paper]. Bioengineering Institute Center for Neuroprosthetics, Worcester Polytechnic Institution.
*
The total number of persons with an amputation, and those using a prosthesis, is expected to increase by at least 47% by the year 2020.
The projected number of persons with amputations (excluding tips of fingers and toes) is based on rates by age group and sex determined in the 1993 Health Interview Survey. These projections (Table VII) assume that the rates will remain stable through the year 2020. The total number of persons with an amputation is expected to increase by 47% between 1995 and 2020. Of the total number of persons with amputations it is estimated that 75% use a prosthesis. The population using a prosthesis is also anticipated to increase by 47% during this time period. With the advent of improved prosthetic designs and lighter materials it is likely that the rate of use may increase, particularly if third party payers become more aware of the benefits of these products.
Table VII
Projected Number of Persons with Absence of Extremities
(excluding tips of fingers and toes) 2000-2020
Year — Total Number — No. Of Users of Prostheses*
2000 — 1,752,838 — 1,314,629
2005 — 1,904,035 — 1,428,026
2010 — 2,065,993 — 1,549,495
2015 — 2,224,022 — 1,668,017
2020 — 2,382,413 — 1,786,810
*Based on 75% of total numbers of persons with amputations.
Src:
Caroline C. Nielsen. 2002 May. “Issues Affecting The Future Demand For Orthotists And Prosthetists:Update 2002.” National Commission on Orthotic and Prosthetic Education
Citing:
Benson, V and Marano, MA. Current Estimates for the National Health Interview Survey, 1993. National Center for Health Statistics. Vital Health Statistics 10 (190). 1994.
Estimated number of persons with an amputation using a prosthesis (75%) estimated from data in 1) Current Estimates for the National Health Interview Survey, 1993 ; 2) Scremin, A.M. et al. Effect of Age on Progression Through Temporary Prostheses After Below-Knee Amputation. Am. J. of Phys. Med. and Rehab, 1993, and 3)Nielsen, C.C. A Survey of Amputees: Functional Level and Life Satisfaction, Information Needs and the Prosthetist’s Role, JPO, 1991.
NOTE: An updated version of this report was produced for NCOPE in 2015, but it does not provide estimates for the number of prosthesis users. (Instead it calculates the number of O&P doctors in demand.) I’ve written to the author to inquire if that data is available. The updated report is:
Joan E. DaVanzo, Audrey El-Gamil, Steven Heath, et al. 2015. “Projecting the Adequacy of Workforce: Supply to Meet Patient Demand.” National Commission on Orthotic and Prosthetic Education. p.17, Exhibit 5 – 2014 figures. p.19, Exhibit 6 – 2016, 2025 projections.
*
In the year 2005, 1.6 million persons were living with the loss of a limb. It is projected that the number of people living with the loss of a limb will more than double by the year 2050 to 3.6 million.
Table 3
Projected Prevalence of Limb Loss by Etiology and Age (in thousands)
Year — Total
2005 — 1,568
2010 — 1,757
2020 — 2,213
2050 — 3,627
…Most striking, however, are the projected trends for the number of people living with the loss of a limb. This increase is related to the aging of the population and the associated increase in the number of people living with dysvascular conditions, especially diabetes. The prevalence of diabetes in the United States is projected to nearly double by the year 2030 solely because of changes in the demographic composition of the population. Our estimates of limb loss reflect, and indeed magnify, these trends. Even assuming that age-, sex-, and race-specific rates of both diabetes and diabetes-related amputations remain unchanged, the number of people with diabetes who are living with the loss of a limb will nearly triple by the year 2050. Overall, the prevalence of limb loss will more than double from 1.6 to 3.6 million people. Given the increase in the prevalence of obesity and the known relationship between obesity and diabetes, a projected increase in the incidence of amputations secondary to dysvascular conditions is likely.
…A goal of Healthy People 2010 is to reduce the number of lower-extremity amputations in persons with diabetes by 55%, from 4.1 per 1000 to 1.8 per 1000 persons.
Src:
Ziegler-Graham K, MacKenzie EJ, Ephraim PL, et al. 2008. “Estimating the prevalence of limb loss in the United States: 2005 to 2050.” Archives of Physical Medicine and Rehabilitation, 89(3).
*
UPDATE 10/27: INTERMACS confirmed tallies for ventricular assist devices from 2006-2015. They estimate that their figures cover 90-95% of the market.

[click for larger]
Annual new patient tallies are at the top of the chart area.
China, Ethiopia Traffic Fatality Forecasts
Came across these papers while looking for US injury forecasts.
Haimanot Gebrehiwot Moges and Solomon Meseret Woldeyohannes. 2014. “Trends and Projections of Vehicle Crash Related Fatalities and Injuries in Northwest Gondar, Ethiopia: A Time Series Analysis.”International Journal of Environmental Health Engineering 3 (1): 30. doi:10.4103/2277-9183.139752.
Aichun Tan, Danping Tian, Yuanxiu Huang, Lin Gao, Xin Deng, Li Li, Qiong He, Tianmu Chen, Guoqing Hu, and Jing Wu. 2014. “[Forecast the trend of burden from fatal road traffic injuries between 2015 and 2030 in China].” Zhonghua Liu Xing Bing Xue Za Zhi = Zhonghua Liuxingbingxue Zazhi 35 (5): 547–51.http://www.ncbi.nlm.nih.gov/pubmed/25059365.
Pharmaceutical Sales Through 2020
EvaluatePharma (life science market research firm) releases an annual report of current pharmaceutical sales figures with forecasts looking 5 years out.
According to the 2015 report, Novartis was the number one pharmaceutical company in 2014 and is forecast to maintain its position in 2020
Other indicators reported:
worldwide prescription drug sales (2006-2020)
regional prescription drug sales
Top 20 Companies by Rx sales in 2020
worldwide R&D spending by company
worldwide Rx drug & OTC sales by therapy area in 2020
Src: “World Preview 2015, Outlook to 2020.” 2015. Evaluate.
They also track sales volume and pricing including cost and volume per patient for the U.S. and other regions. Not available in the free report – contact them.
Media Contacts:
Evaluate and EP Vantage (for general questions)
Christine Lindgren
+1 617-866-3906
christine.lindgren@evaluategroup.com
Chempetitive Group (for U.S. media)
Rachel Wallace
+1 781-775-3640
rwallace@chempetitive.com
