

2030 Injury Scenarios
Quantitative injury rate forecasts have been somewhat scarce (short of Pardee’s long-range fatality forecasts to 2100). During the search, I came across the previously mentioned Institute for Alternative Futures’ Public Health Scenarios 2030. Here’s expected scenario from their “Injury Prevention Driver Forecasts”:
- Technological innovations in design and monitoring – and decreased public tolerance – reduce unintentional injury rates for certain types of injuries
- Rates of violence continue to be closely tied to poverty, race, education, and geography
- Some innovative programs prove successful locally but are leadership-dependent and unsustainable
- Injury-related fatalities decrease but injury-related costs – including long-term care and benefits – rise due to inadequate focus on primary prevention
- Political and cultural opposition to a population-based approach hinders the most effective local policies from being embraced on a nationwide level
Src: “Injury Prevention Driver Forecasts.” 2014. Institute for Alternative Futures.
Public Health Scenarios 2030
I’ve been looking for illness-related forecasts and historic statistics for the last couple days. After looking through so much quantitative data (my roundup is here), it’s interesting to finish out the research with a look at some scenarios.
The Institute for Alternative Futures (co-founded by Alvin Toffler in 1977), has a series called Public Health 2030. The “Chronic Disease Driver Forecasts” is of particular interest.
Excerpt:
Forecast Summaries
Expectable: Chronic disease epidemic continues its upward trajectory
• Tobacco use and cancer incidence rates drop
• Aging yields higher rates of dementia and prostate and breast cancer
• Highest-risk populations cannot access new treatments for chronic disease
• Behavioral health programs show varied success/failure rates
• Primary prevention efforts are met by various obstacles, including legal and public relations battles
• About 48 percent (171 million) of U.S. residents live with one or more chronic conditions, i.e., 2% or
30 million people more since 2010
• National health spending accounts for 22 percent of GDP (compared to 18 percent in 2010)Challenging: Chronic disease epidemic escalates
• Improved access to care leads to substantial increase in diagnosed chronic diseases. Widespread
provider shortages and inconsistent quality of self-management support fail to effectively control
and prevent chronic disease
• A major economic downturn worsens psychological and behavioral health; smoking, obesity, heart
disease, cancers, and diabetes become more prevalent among both youth and elders
• Health disparities increase and low-income and minority groups are blamed for their health
problems and scapegoated for overburdening the health care system
• Some communities experience successes in improving behavioral and community health, but most
struggle to replicate this success
• Over half the U.S. population lives with one or more chronic conditions, and all states have obesity
rates above 50 percent
• Cuts in Medicare and Medicaid reduce health spending to 17 percent of GDP as many in the U.S.
forego careAspirational: Widespread conquering and prevention of chronic disease
• Communities address social determinants of health, prevention, and behavioral health; Community
Centered Health Homes are prominent
• Accountable Care Communities (ACCs) expand on the idea of the Accountable Care Organization
(ACO) to coordinate across a range of sectors, including employment, housing, transportation, and
education
• “My code is your code”: apps are tailored and reworked to engage the public in promoting personal
and community wellbeing among neighbors and localities; widespread use of personalized health
informatics, games, and digital agents to assess and change behavior
• People and groups increasingly advocate for healthier community environments
• Less than 40 percent of the U.S. population is living with one or more chronic conditions
Src: “Chronic Disease Driver Forecasts.” 2014. Institute for Alternative Futures.
Sick Days and Chronic Illness
I consulted a few different sources of information for illness statistics. The Bureau of Labor Statistics has a very small sample of sick-leave used data (for 2009). Gallup and Healthways also have a small sample of sick-leave data (for 2012). No forecasts are available. Several think tanks are tracking reported rates of chronic illness. A couple forecasts are available. Results are summarized below.
Sick Days
In 2012, researchers from the Bureau of Labor Statistics conducted a one-time tabulation of sick leave provision and usage. The data used were compiled from the 2009 National Compensation Survey, looking only at full-time workers in private industry.
The researchers averaged the amount of sick leave used in each of 6 industry areas (financial activities; information industry; trade, transportation, and utilities; professional and business services; leisure and hospitality; construction). In the first four of those industries, workers used an average of 4 days of sick leave per year. In the last two industries (leisure and hospitality, and construction), workers used an average of 2 days of sick leave per year.
This was a one-time tabulation. Jason Ford says by email that he’s not aware of any forecasts. To his knowledge, additional years of this data are not available.
Src:
Ross O. Barthold, Jason L. Ford. 2012 February 29. “Paid Sick Leave: Prevalence, Provision, and Usage among Full-Time Workers in Private Industry.” Bureau of Labor Statistics.
*
2012 survey data of workers in 14 job categories found that usage of sick days ranged from 6 days per year to 3 days per year. The survey was conducted by Gallup and Healthways as part of Healthways’ annual Well-Being Index report. The survey was administered to 94,000 Americans who work at least 30 hours per week.
Days missed per month
Physicians: .24
Farmers, Foresters, Fishers: .25
Construction or Mining: .28
Installation/Repair: .35
Sales: .35
Managers/Executives: .36
Professionals: .37
Manufacturing/Production: .38
School Teacher: .39
Transportation: .40
Business Owners: .41
Nurses: .43
Clerical or Office Workers: .44
Service Workers: .47
Note: 24/7 Wall St. performed the analysis of data collected by Gallup-Healthways. Emailed Healthways (9/25) to see if they’re still collecting this data.
Src:
Michael B. Sauter, Samuel Weigley and Alexander E.M. Hess. 2013 May 9. “Workers Taking the Most Sick Days.” 24/7 Wall St.
Well-Being Index
Gallup and Healthways have compiled their Well-Being Index annually since 2008. It’s a “barometer of Americans’ perceptions of their well-being.” The index is compiled based on survey responses to questions about six areas of life: life evaluation, emotional health, work environment, physical health, healthy behavior, basic access.
Physical Health Index
2008 76.9
2009 76.6
2010 76.9
2011 76.7
2012 77.0
2013 76.4
The Physical Health Index is comprised of questions related to: Body Mass Index, disease burden, sick days, physical pain, daily energy, history of disease, and daily health experiences.
Overall Well-Being Score
2008 66.5
2009 66.3
2010 66.8
2011 66.2
2012 66.7
2013 66.2
Over the six years of our well-being measurement, Americans’ life evaluations have improved, emotional health and healthy behaviors have remained stable, and basic access, physical health, and work environment have declined. While there are dozens of trends that have impacted the national score since 2008, the three most prominent ones are:
* Annual decreases in the rate of those with health insurance;
* Rising rates of obesity;
* Declining work environment scores.
Src:
Gallup-Healthways Well-Being Index. 2014. “State of American Well-Being.”
Chronic Disease Rates
In 2008, The Milken Institute found that one third of Americans reported having at least one of seven common chronic diseases, with a total of 162.2 million cases in 2003. They forecasted a 42% increase in cases of those diseases by 2023, for a total of 230.7 million cases.
Of the seven chronic diseases, pulmonary conditions were the most common, with 49.2 million cases recorded. Next in prevalence were hypertension, with 36.8 million recorded cases, and mental disorders, with 30.3 million; followed by heart disease at 19.2 million; diabetes at 13.7 million; cancer at 10.6 million; and stroke at 2.4 million.
Src:
Ross DeVol, Armen Bedroussian. 2007. “An Unhealthy America: The Economic Burden of Chronic Disease.” Milken Institute.
*
In 2009, almost half of Americans, 145 million people, had at least one chronic condition. This represented an increase of 10 million people over the estimate that was made in 2002 for the year 2009.
The number of people with chronic conditions reached 125 million in 2000, forecast to reach 147 million by 2010 and 157 million by 2020. By 2030 half the population will have one or more chronic conditions.
Src:
2010. “Chronic Care: Making the Case for Ongoing Care.” Robert Wood Johnson Foundation.
*
Prevalence of Chronic Disease in the U.S. Population
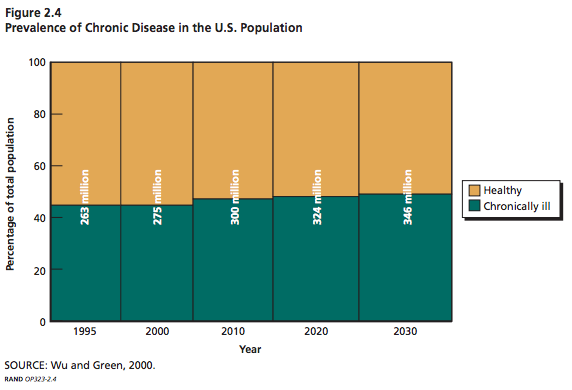
Millions of Americans
Src: Wu, Shin-Yi and Anthony Green. Projection of Chronic Illness Prevalence and Cost Inflation. RAND Corporation; October 2000. (unavailable online)
Cited in:
Soeren Mattke, Lisa Klautzer, Tewodaj Mengistu, et al. 2010. “Health and Well-Being in the Home.” RAND Corporation.
and
The Marshall Protocol Knowledge Base. 2012. “Incidence and Prevalence of Chronic Disease.” Autoimmunity Research Foundation.
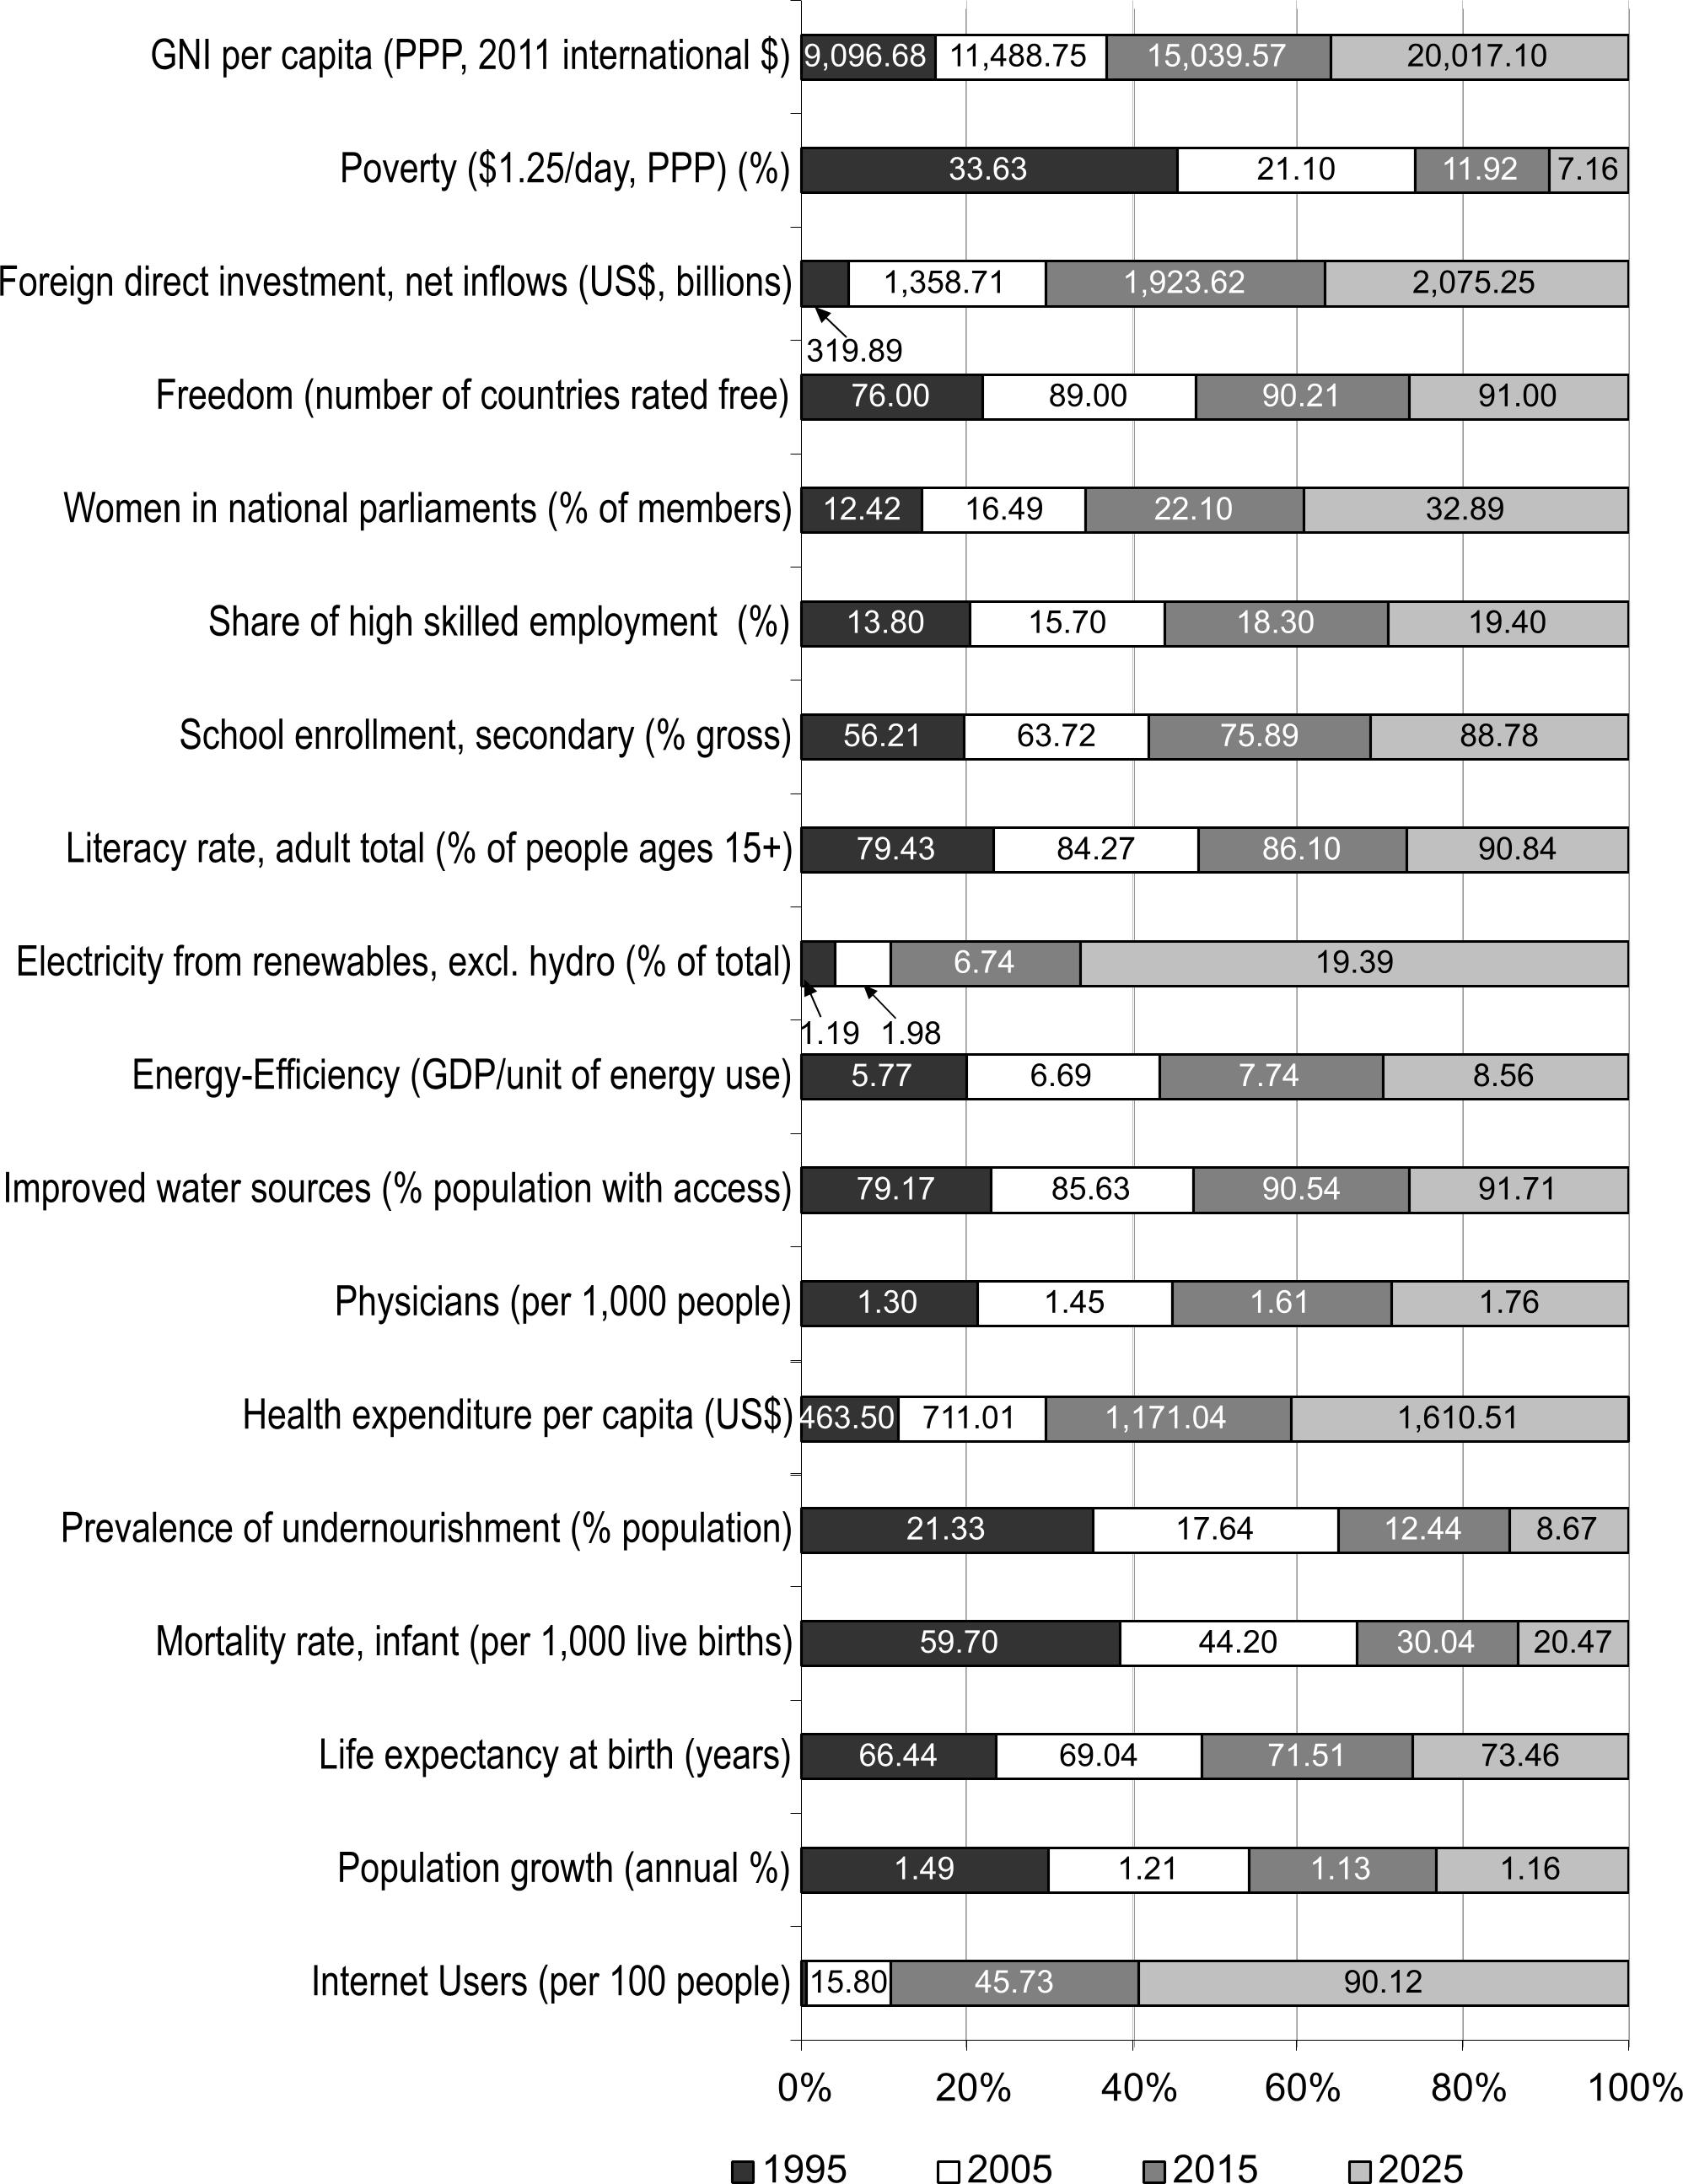
State of the Future Index (28 variables)
Every year, The Millennium Project (MP) computes a “State of the Future Index” looking 10 years into the future, based on data from the previous 20 or more years. The index calculation is based on values for multiple, individually-forecast key variables (28 in 2015). The index is calculated globally, as well as for individual countries. The overall index is intended to show the direction of things to come.
For our purposes the forecasts for the 28 individual variables are of most interest. MP breaks the variables into two groups: those showing improvement, and those showing decline. The values for the individual variables (previous actual, and forecast) are displayed within the shaded area of the charts.
Areas showing improvement in 2015:
Areas showing decline in 2015:
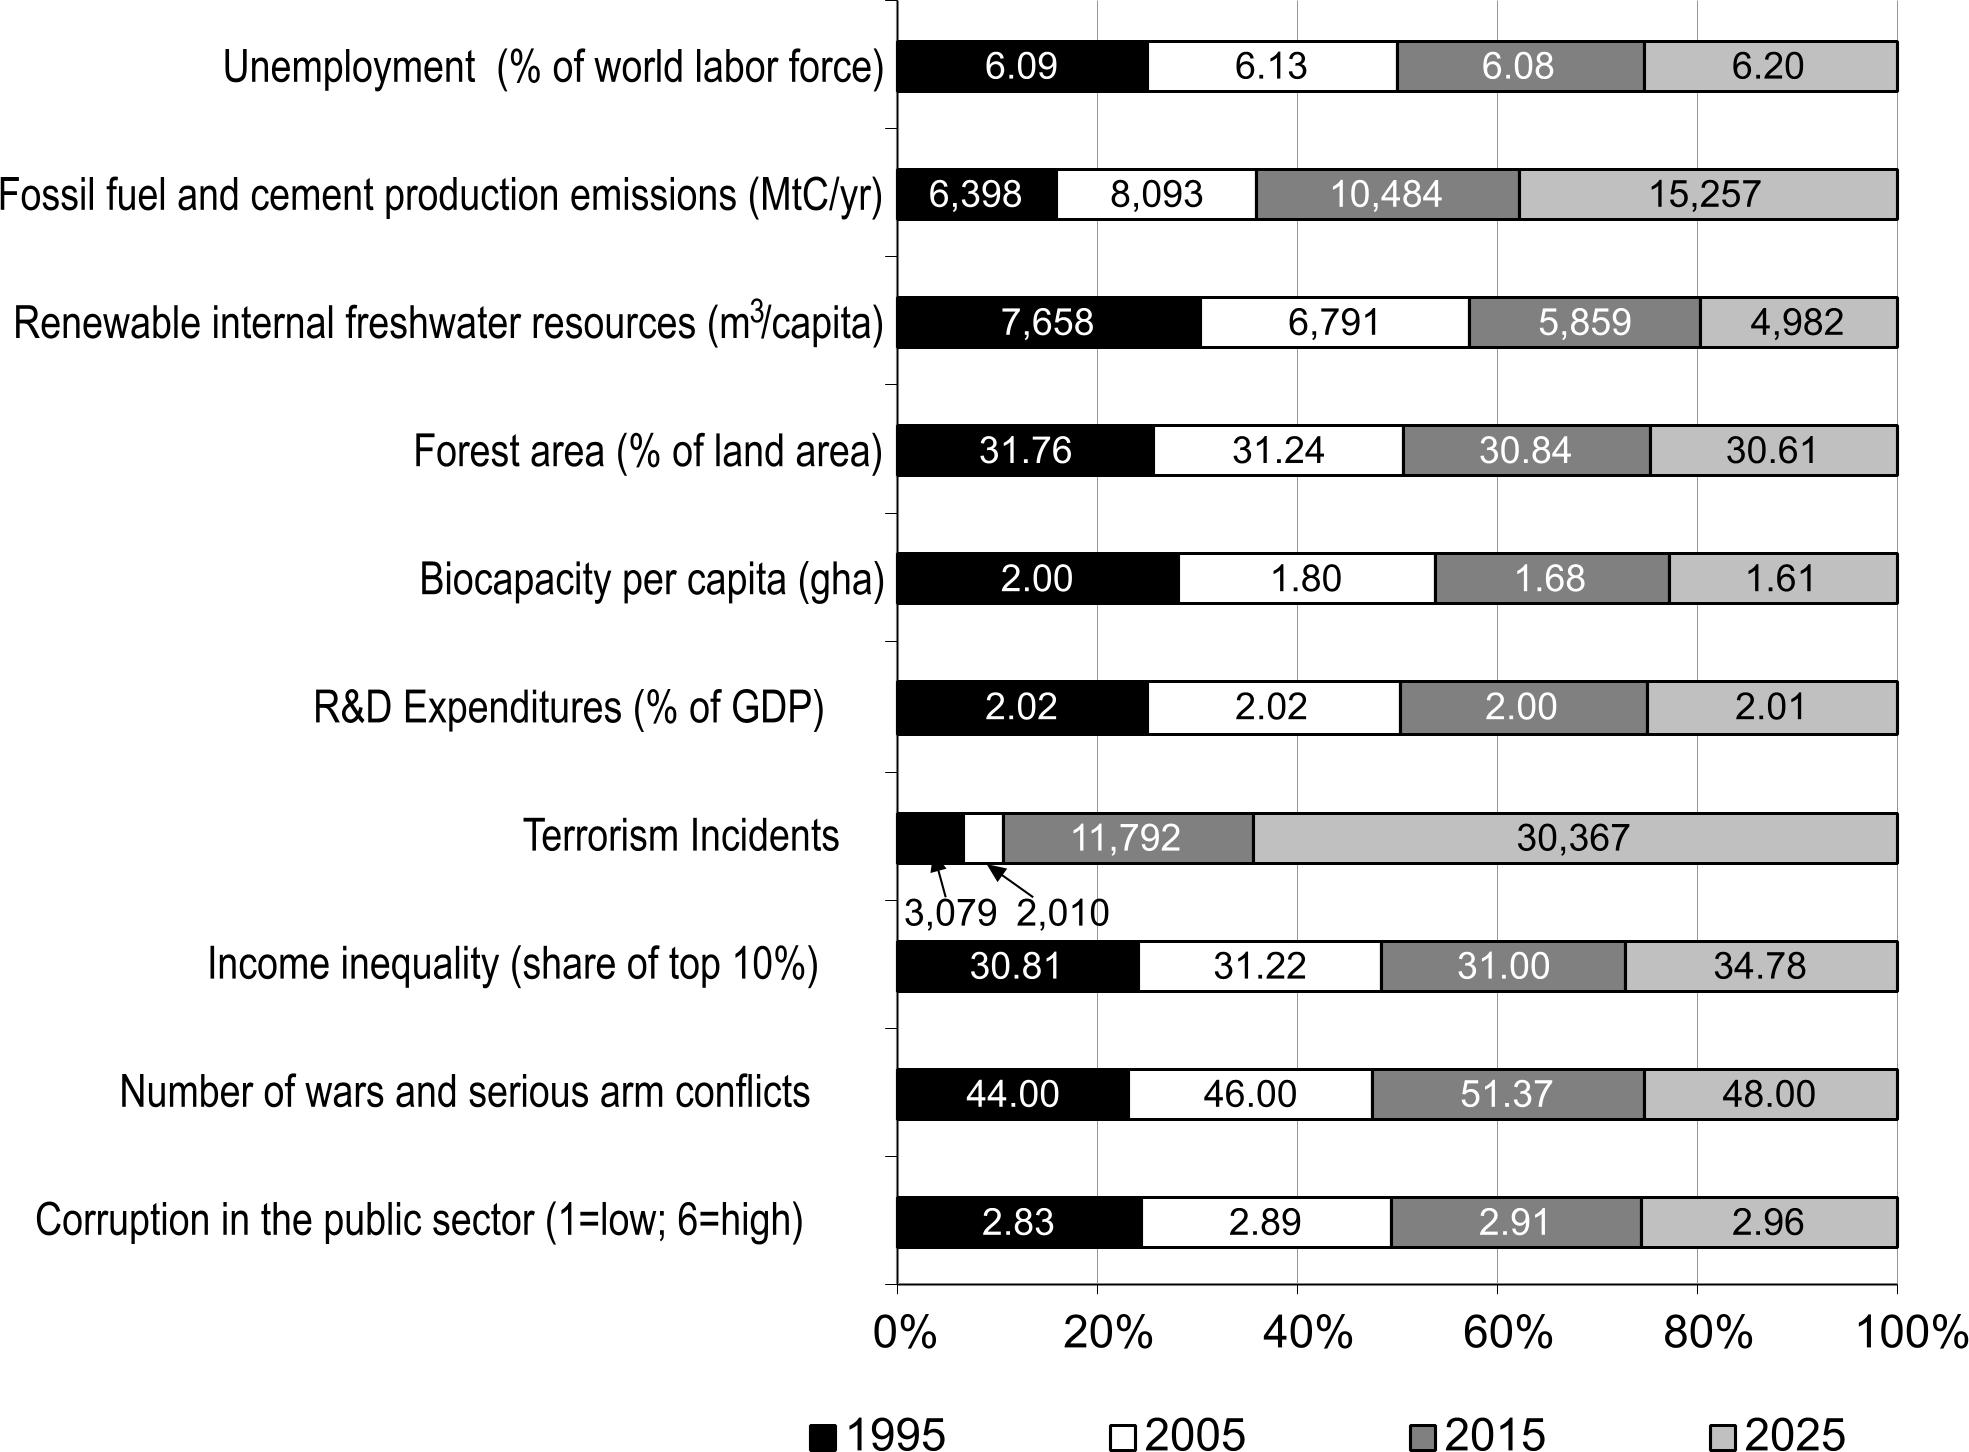
In 2015, the calculated Index looks like this:
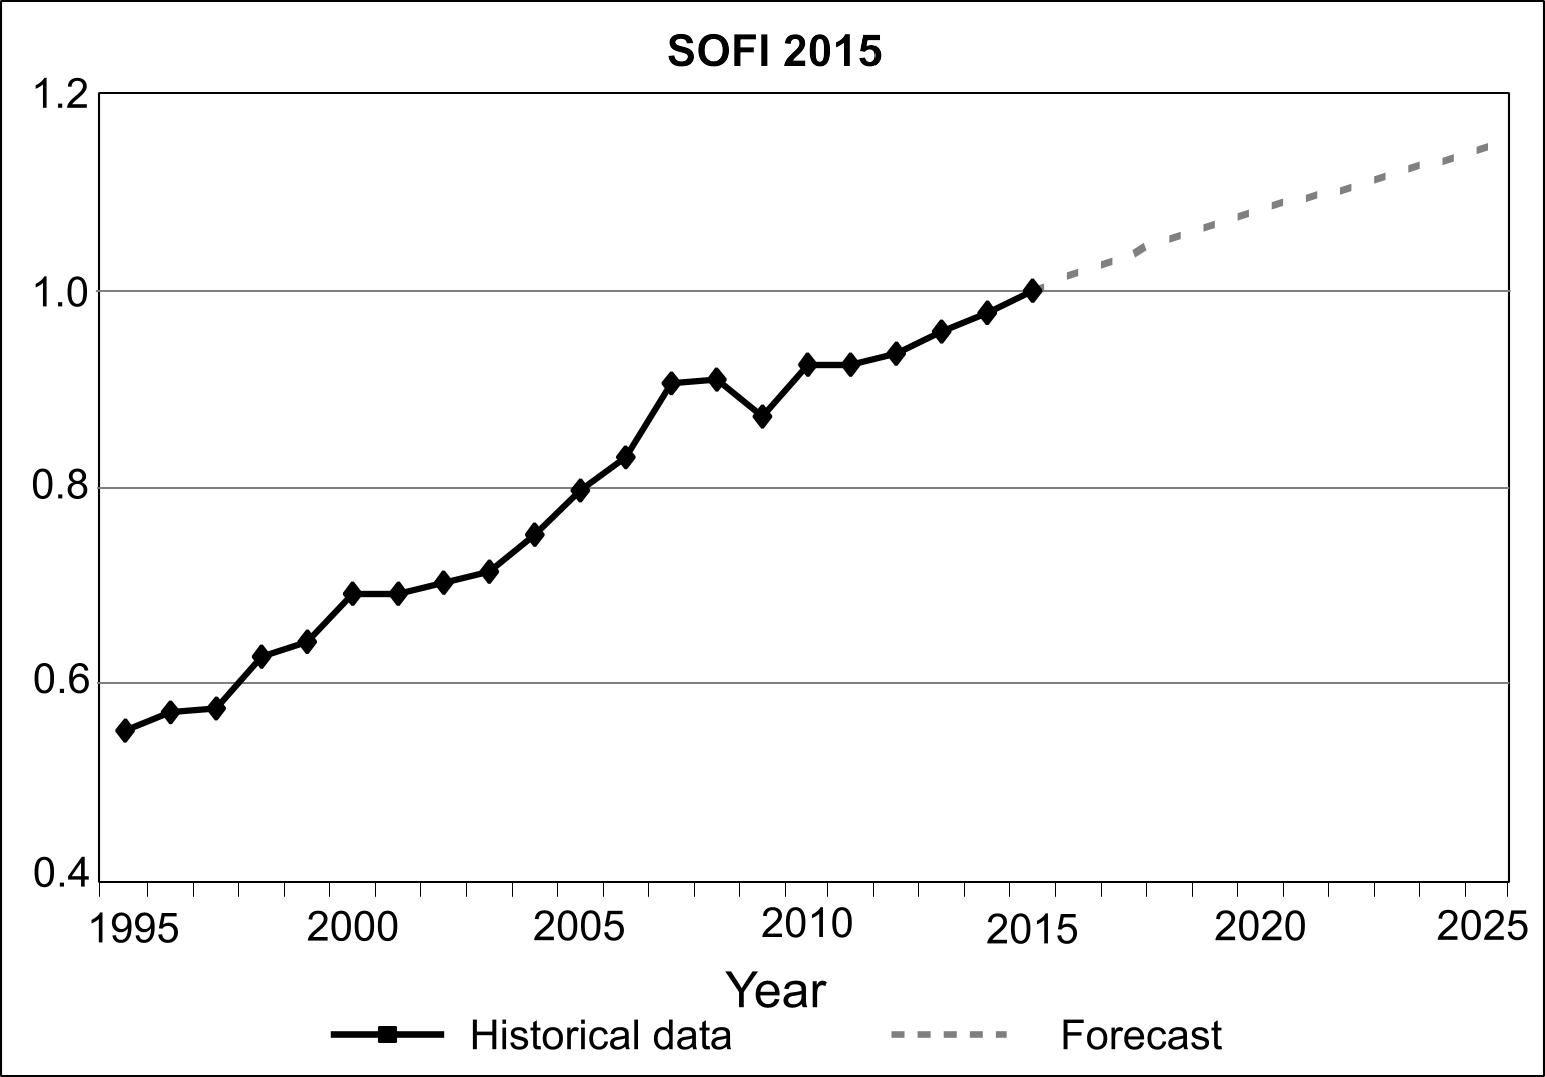
Src: Gordon, Theodore J. 2015. “2015 State of the Future Index.” The Millennium Project.
Charts for each indicator, and a brief indication of the source for the data are in this PDF.
The Millennium Project is an independent non-profit global participatory futures research think tank of futurists, scholars, business planners, and policy makers who work for international organizations, governments, corporations, NGOs, and universities. Their annual report collects and assesses judgments from over 3,000 people selected by its 56 nodes around the world.
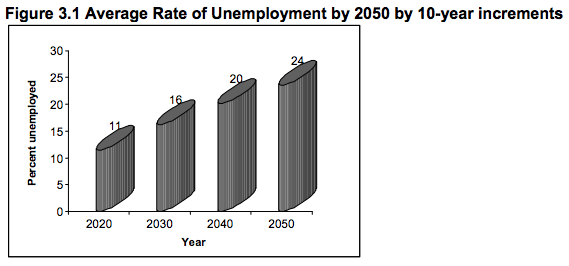
Unemployment Rates to 2050
As part of their 2015-16 State of the Future report (the 18th edition), The Millennium Project conducted a Future Work/Technology 2050 study. Using a Real-Time Delphi survey, the Project asked a panel of 300 experts the following question:
If socio-political-economic systems stay the same around the world, and if technological acceleration, integration, and globalization continue, what percent of the world do you estimate could be unemployed—as we understand being employed today—during each of the following years: 2020; 2030; 2040; 2050?
Their response:
The full chapter (including the responses to 9 other questions also asked of the expert panel) are available here:
Jerome C. Glenn, Elizabeth Florescu, et al. 2015. “Future Work/Technology 2050” in 2015-16 State of the Future.
The Executive Summary for the 2015-16 “State of the Future” report is here:
Jerome C. Glenn, Elizabeth Florescu, et al. 2015. “Executive Summary” in 2015-16 State of the Future.
