

Per Capita Rx Usage
Current data
Evaluate and IMS Health both track current and recent rates of drug prescription per capita.
From Evaluate:
2011: 10
2013: 9
src: 2013. Evaluate. Medical Expenditure Panel Survey. Spreadsheet shared by email, 2015 Sep 10.
From IMS Health:
2010: 11.46
2011: 11.33
2013: 12.2
2014: 2.1% more than 2013
Src (2010, 2011): 2012. IMS Institute for Healthcare Informatics. “The Use of Medicines in the United States: Review of 2011.″
Src (2013): 2014. IMS Institute for Healthcare Informatics. “Medicine use and shifting costs of healthcare: A review of the use of medicines in the United States in 2013.″
Src (2014): 2015. IMS Institute for Healthcare Informatics. “Medicines Use and Spending Shifts: A Review of the Use of Medicines in the U.S. in 2014.″
Michael Kleinrock, of IMS, explains via email that Rx usage rates have been very consistent for a very long time. Their data goes back to the early 90s, but the collection of age-band data is a relatively recent addition. They haven’t yet produced harmonized figures showing all of their historic data.
Forecast data
In 2008, a paper published by the Department of Health and Human Services gave forecasts for prescriptions dispensed per visit to the year 2030. Three forecasts were made for prescriptions per physician office visit, per hospital/clinic outpatient visit, and per emergency visit. The forecasts are divided into age bands for patients aged 0-44, 45 to 64, and 65 years and older. The forecasts are all based on analysis of the CDC’s National Ambulatory Medical Care Survey (NAMCS) from 1995 to 2004, with trend extrapolation from 2005 to 2030.
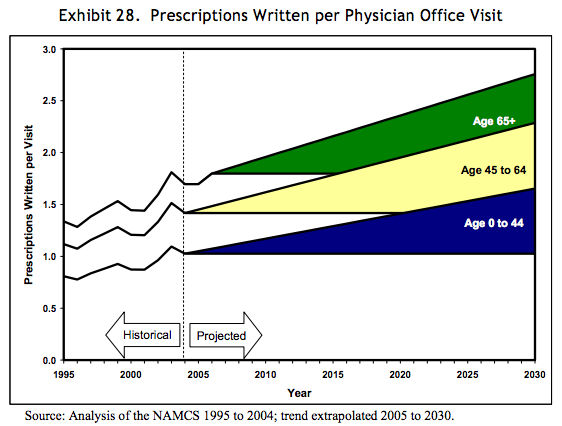
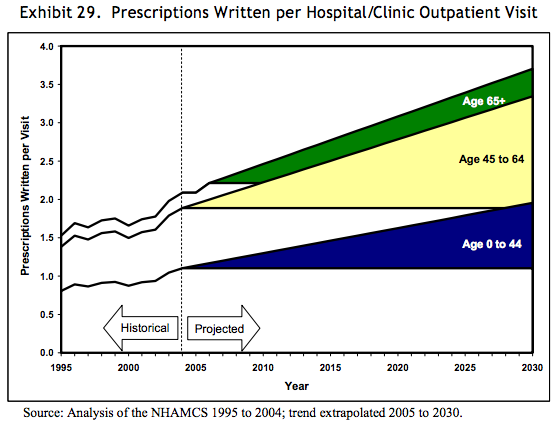

Src: 2008. Department of Health and Human Services. “The Adequacy of Pharmacist Supply: 2004 to 2030.” Exhibits 28-30, pp 31, 32.
