

Transportation: General Transit and Cars
Summary
This collection of data includes the following indicators:
vehicles per household, 1969-2009, Dept. of Transportation
licensed drivers per household, 1969-2009, Dept. of Transportation
vehicles per licensed driver, 1969-2009, Dept. of Transportation
vehicles per worker, 1969-2009, Dept. of Transportation
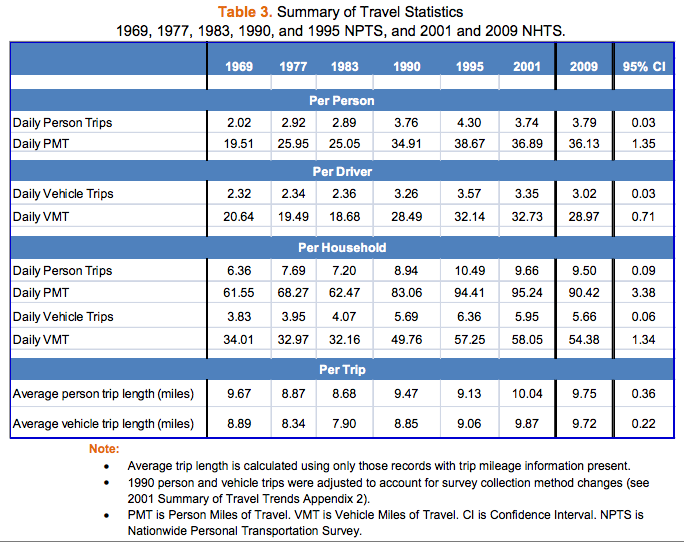
daily person trips, 1969-2009, Dept. of Transportation
daily person miles of travel (PMT), 1969-2009, Dept. of Transportation
daily vehicle trips, 1969-2009, Dept. of Transportation
daily vehicle miles of travel (VMT), 1969-2009, Dept. of Transportation
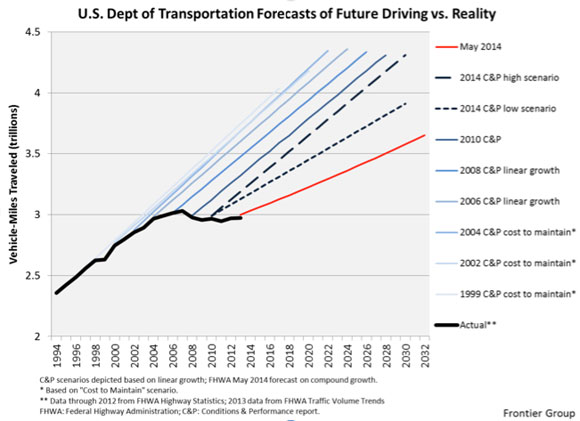
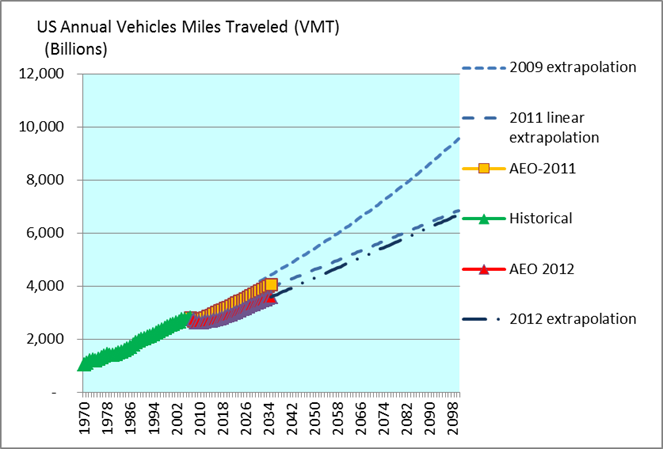
total annual VMT, 1994-2032 & 2014-2044 & 1970-2098, Dept. of Transportation (Frontier Group), Thomas
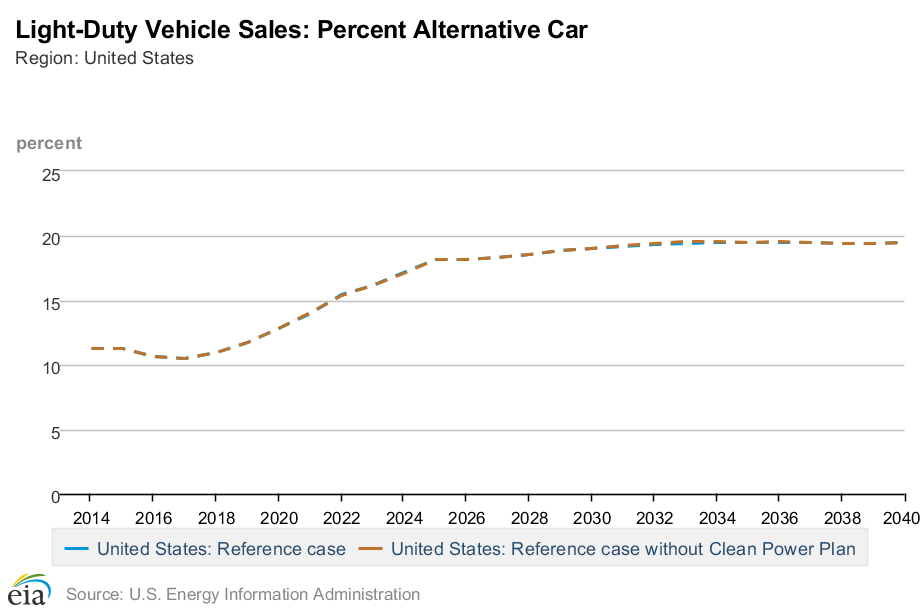
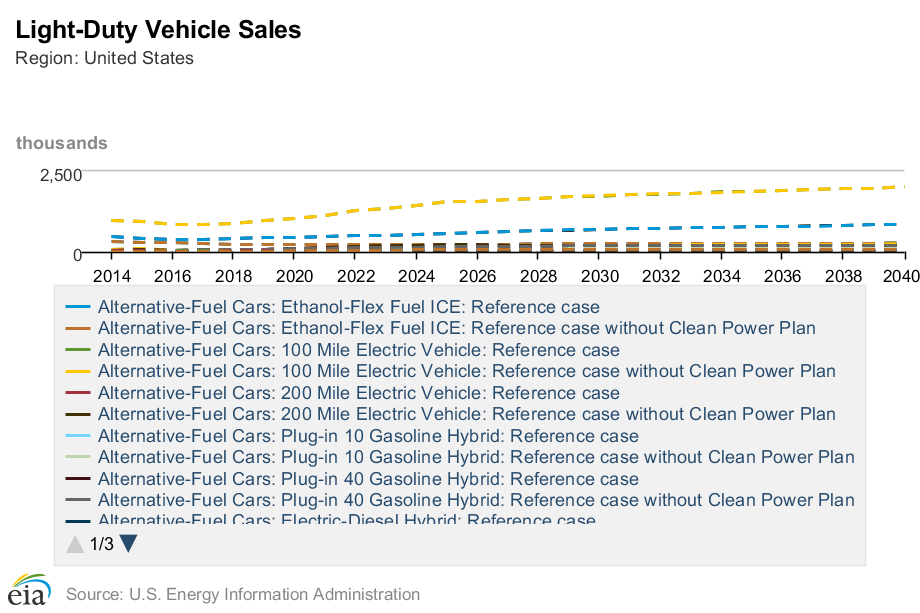
total annual VMT for light-duty vehicles (LDV), 2014-2040, US Energy Information Administration (EIA)
average person trip length (miles), 1969-2009, Dept. of Transportation
average vehicle trip length (miles, 1969-2009, Dept. of Transportation
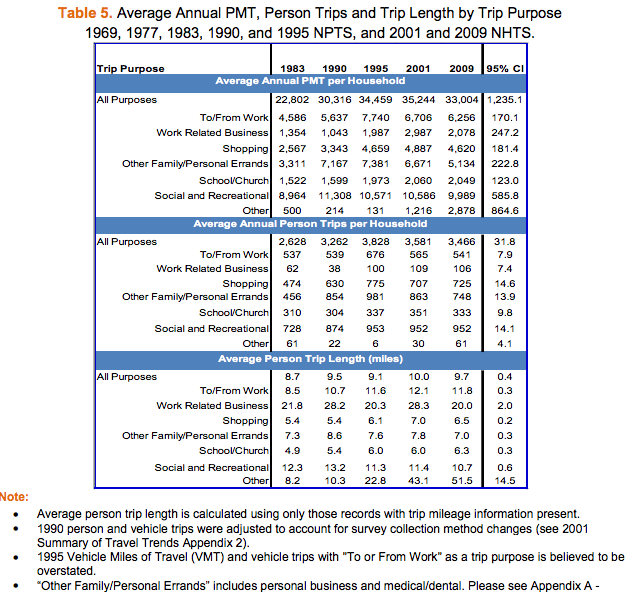
avg annual PMT/household by purpose, 1983-2009, Dept. of Transportation
avg annual person trips/household by purpose, 1983-2009, Dept. of Transportation
avg person trip length (miles) by purpose, 1983-2009, Dept. of Transportation
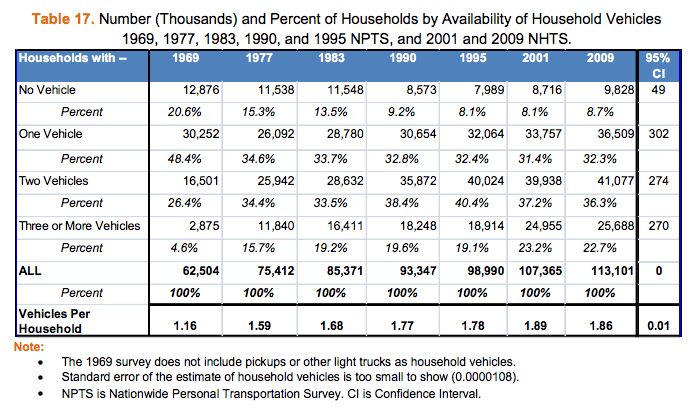
availability of household vehicles, 1969-2009, Dept. of Transportation
vehicle prevalence by age and type, 1977-2009, Dept. of Transportation
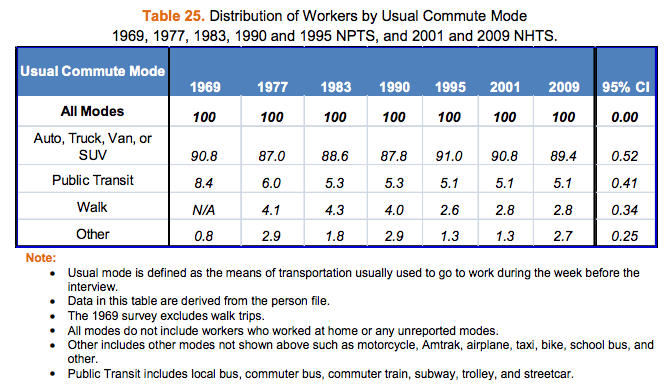
distribution of workers by commute mode, 1969-2009, Dept. of Transportation
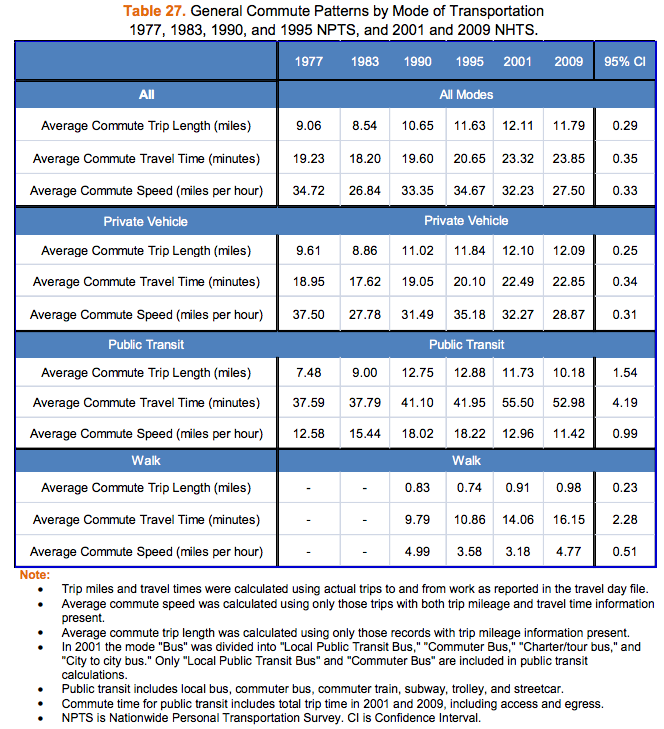
commute patterns by mode of transportation, 1977-2009, Dept. of Transportation
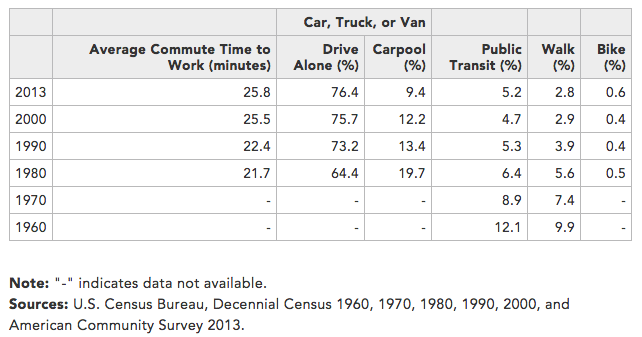
avg commute time to work, 1980-2013 & 2005-2014, Census Bureau
Chicago metro commute, 2000-2030, Alex Anas
LDV sales, 2014-2040 & 1970-2100, EIA, Thomas
vehicle production vs. car sharing, 2015-2030, Morgan Stanley
Alternative-fuel cars sales, 2014-2040 & 2000-2050 EIA, Nat’l Research Council
autonomous vehicle sales, –2035 & 2014-2036 & –2040 IHS, BCG, Jiang, IEEE
autonomous vehicle dev timeline, 2015-2030, PwC
Findings
General
The Department of Transportation has been collecting data about daily personal travel patterns via two different, periodic surveys going back to 1969. Subsequent survey years have been: 1977, 1983, 1990, 1995, 2001, 2009, and 2016 (underway).
Abstract:
The 2009 National Household Travel Survey (NHTS) provides data to characterize daily personal travel patterns across the country. The survey includes demographic data on households, vehicles, people, and detailed information on daily travel by all modes of transportation. NHTS survey data is collected from a sample of households and expanded to provide national estimates of trips and miles of travel by travel mode, trip purpose, and other household attributes. When combined with historical data from the 1969, 1977, 1983,1990, and 1995 NPTS and the 2001 NHTS, the 2009 NHTS serves as a rich source of detailed travel data over time for users. This document highlights travel trends and commuting patterns in eight key areas – summary of travel and demographics, household travel, person travel, private vehicle travel, vehicle availability and usage, commute travel patterns, temporal distribution, and special populations.


src:
A. Santos, et al. 2011.
“Summary Of Travel Trends: 2009 National Household Travel
Survey.”
U.S. Department of Transportation.
NOTE: 2016 SURVEY IS UNDERWAY
*
The Bureau of Transportation Statistics publishes historic data on annual passenger-miles in aggregate, broken down by method of transportation. The chart currently shows data from 1960-2014.
Src:
Department of Transportation. Bureau of Transportation Statistics. Accessed November 8, 2016.
“Table 1-40: U.S. Passenger-Miles (Millions).”
XLS
TO DO: EXTRACT DATA
Commute
The Census Bureau (in addition to the Dept. of Transportation) has asked survey questions about daily travel patterns going back to 1980 (and back to 1960 for a couple of very specific questions). Questions have been asked during the decennial census (since 1980, maybe 1960), and during the “American Community Survey” (going back to 2005).
src:
Beth Jarosz and Rachel T. Cortes. September 2014.
“In U.S., New Data Show Longer, More Sedentary Commutes.”
Population Reference Bureau.
citing:
U.S. Census Bureau, Decennial Census 1960, 1970, 1980, 1990, 2000, and American Community Survey 2013.
Mean Travel Time to Work (minutes)
2005 – 25.1
2006 – 25.0
2007 – 25.3
2008 – 25.5
2009 – 25.1
2010 – 25.3
2011 – 25.5
2012 – 25.7
2013 – 25.8
2014 – 26.0
src:
United States Census Bureau. 2005-2014.
“American Community Survey.” Table S0802: Means of Transportation to Work by Selected Characteristics.
links above
*
This article presents data and extrapolations explaining why urban commute times have not increased more dramatically, despite decades of urban sprawl.
One study (Alex Anas, SUNY Buffalo) extrapolates commute times for the Chicago metro area from 2000 to 2030. In that time, there is a 24% jump in population, leading to 19% more urbanized land (sprawl), but only a 4.5% rise in commute time (from 30 minutes to 31.7 minutes).
Another study (MIT Senseable City Lab) examines cell phone data to track commutes around the world. The study finds travel time, on average across the world, to be largely independent of distance.
The article says that these studies seems to support the theory of “travel time budgets,” developed first by Yacov Zahavi and further by Cesar Marchetti (that travel budgets have averaged about an hour throughout history, and across the world). Both studies seem to support the idea that people adapt their lifestyles to accommodate an average travel time budget, whether by changing mode of transportation (e.g.: switching to public transportation), moving closer to their jobs, or reducing trips that aren’t commutes.
src:
Eric Jaffe. June 2014.
“Why Commute Times Don’t Change Much Even as a City Grows.”
The Atlantic: CityLab
More information about Anas’ extrapolation model, which includes several complex indicators, can be found on this page at his personal website:
“The RELU-TRAN Model and its applications”
TO-DO: ANAS’ MODEL MAY BE IN THE PROCESS OF BEING APPLIED TO LOS ANGELES AND OTHER METROS. INQUIRE ABOUT GENERALIZATION TO THE US.
Total Vehicle Miles Traveled
The new report’s 30-year estimates predict even less rapid growth in driving, forecasting that total driving miles will increase only 0.75 percent annually from 2012 to 2042. With population growth estimated to average 0.7 percent each year, this leaves per-person driving miles essentially flat. “This represents a significant slowdown from the growth in total VMT experienced over the past 30 years, which averaged 2.08% annually,” says the report.
src:
Phineas Baxandall. January 2015.
“The Feds Quietly Acknowledge the Driving Boom Is Over.”
StreesBlogUSA.
citing:
Federal Highway Administration. May 2014.
“FHWA Forecasts of Vehicle Miles Traveled (VMT): May 2014.”
and:
U.S. PIRG/Frontier Group (graphic src)
*
The Federal Highway Administration’s spring 2016 forecast revises the growth outlook even further downward.
Excerpt:
Growth in total VMT by all vehicle types is projected to average 0.92% annually over the next 20 years (2014-2034). Over the entire 30-year forecast period (2014-2044) the average annual growth rate is projected to be 0.61% annually, as growth is projected to slow to 0.30% annually during the last decade (2034-2044). This outlook represents a significant slowdown from the growth experienced over the past 30 years, when growth in total VMT averaged 2% annually, although more detailed analysis shows that growth in overall motor vehicle travel per Capita was already slowing throughout most of that period.
[Emphasis mine]
src:
Federal Highway Administration. May 2016.
“FHWA Forecasts of Vehicle Miles Traveled (VMT): Spring 2016.”
Department of Transportation.
*
Transportation: Travel Indicators: Light-Duty Vehicles = 8,500 lbs
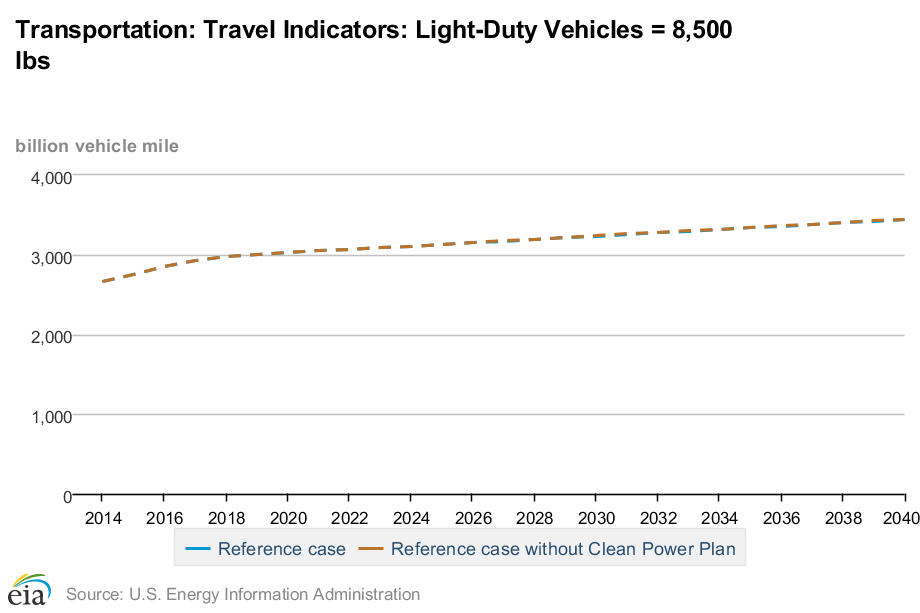
Visit the source URL for data (many export options).
src:
US Energy Information Administration. 2016.
“Annual Energy Outlook 2016”
Transportation Sector
Table: Light-Duty Vehicle Energy Consumption by Technology Type and Fuel Type
NOTE: ONLY THE DATA TABLES ARE CURRENTLY AVAILABLE. THE EXECUTIVE SUMMARY AND OTHER NARRATIVE PARTS OF THE REPORT WILL BE AVAILABLE AFTER JULY 21, 2016. CHECK BACK HERE.
*
The National Hydrogen Association created a few projections of US Annual Vehicle Miles Traveled (VMT) between 2007 and 2012. Their model performs a linear extrapolation from the EIA’s Annual Energy Outlook (AEO) for 2012, which projects VMT through 2023. Their extrapolation goes through the end of the 21st century. (Results are published at the lead author’s website, “Alternative Vehicles”.)
src:
C.E. Thomas. 2013.
“LDV VMT & Sales.” Alternative Vehicles.
contact: thomas@cleancaroptions.com, faq@cleancaroptions.com
TO DO: CONTACT DR. C.E. (SANDY) THOMAS TO ASK IF THERE HAS BEEN A RECENT UPDATE.
LDV Sales Projection
Light-Duty Vehicle Sales: Total Sales, Cars and Light Trucks

Light-Duty Vehicle Sales: Percent Alternative Cars
Light-Duty Vehicle Sales: Alternative-Fuel Cars
Visit the source URL for data (many export options).
src:
US Energy Information Administration. 2016.
“Annual Energy Outlook 2016”
Transportation Sector
Table: Light-Duty Vehicle Energy Consumption by Technology Type and Fuel Type
*
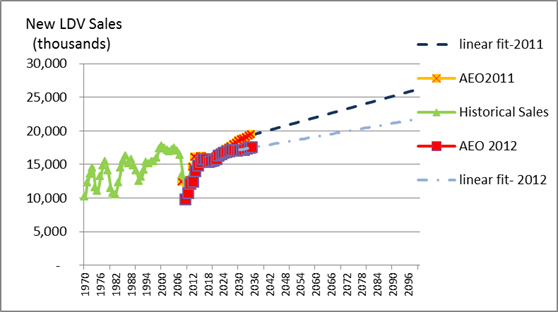
src:
C.E. Thomas. 2013.
“LDV VMT & Sales.” Alternative Vehicles.
contact: thomas@cleancaroptions.com, faq@cleancaroptions.com
TO DO: CONTACT DR. C.E. (SANDY) THOMAS TO ASK IF THERE HAS BEEN A RECENT UPDATE.
*
5.3.1 Baseline Cases
Excerpt:
In the [business as usual] case, new-vehicle sales increase to 22.2 million in 2050 from 10.8 million units in 2010 (a year in which sales were severely depressed due to the recession). Diesel, hybrid, and plug-in hybrid vehicles make modest gains in market share (Figure 5.1). The total stock of LDVs increases from about 220 million in 2010 to 365 million in 2050.
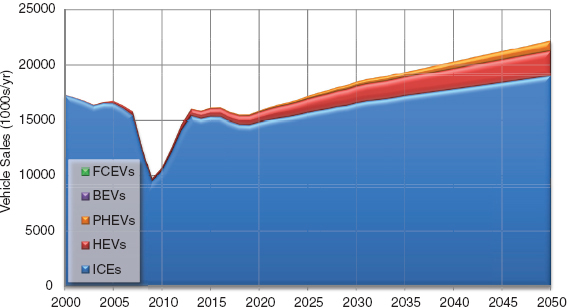
FIGURE 5.1 Vehicle sales by vehicle technology for the business as usual scenario.
FCEVs: fuel cell electric vehicles
BEVs: battery electric vehicles
PHEVs: plug-in hybrid electric vehicles
HEVs: hybrid electric vehicles
ICEs: internal combustion engines
Note: In this model total new car sales and annual vehicle miles traveled (VMT) are assumed to be the same as in the projections from the Annual Energy Outlook 2011
src:
National Research Council. 2013.
Transitions to Alternative Vehicles and Fuels.
Chapter: 5 Modeling the Transition to Alternative Vehicles and Fuels.
The National Academies Press.
*
Production Vs. Sharing
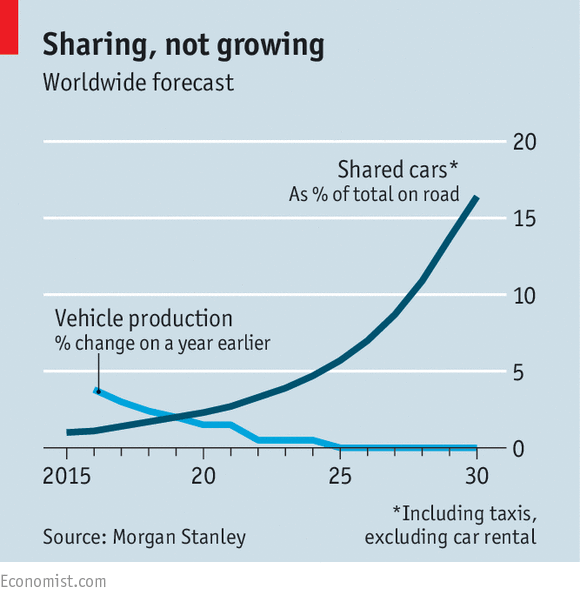
Src:
The Economist. January 2016.
“The driverless, car-sharing road ahead.”
Autonomous Vehicle Sales
IHS forecasts 76 million autonomous vehicles will have been sold globally through 2035, with 21 million of those being sold that year.
“The U.S. market is expected to see the earliest deployment of autonomous vehicles as it works through challenges posed by regulation, liability and consumer acceptance. Deployment in the U.S. will begin with several thousand autonomous vehicles sold in 2020, which will grow to nearly 4.5 million vehicles sold in 2035, according to IHS Automotive forecasts. As in many other markets, a variety of use cases and business models are expected to develop around consumer demand for personal mobility.”
IHS expects a global CAGR of 43% between 2025 and 2035.
src:
IHS. June 2016.
“CORRECTING and REPLACING IHS Clarifies Autonomous Vehicle Sales Forecast – Expects 21 Million Sales Globally in the Year 2035 and Nearly 76 Million Sold Globally Through 2035.”
contacts:
Michelle Culver michelle.culver@ihs.com
press@ihs.com
TO DO: ASK IF THEY CAN SHARE ANNUAL DATA POINTS.
*
“In 2035, AV sales will account for 25% of the market.”
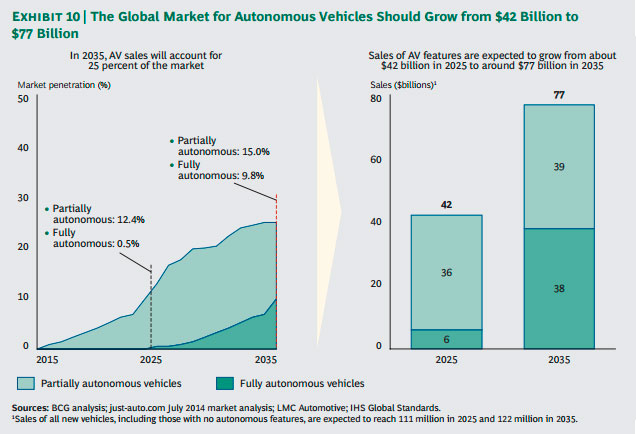
src:
Boston Consulting Group. April 2015.
“Revolution in the Driver’s Seat.”
P.18
Note: The report uses expectations for the U.S. as an accurate proxy for the global market-penetration. This is based on adoption rates in the U.S. for adaptive cruise control being in line with overall global adoption.
*
Cars sold globally 2014-2036
2014 – total 90M+, autonomous or self-driving 15M+
2030 – 50% autonomous or self-driving
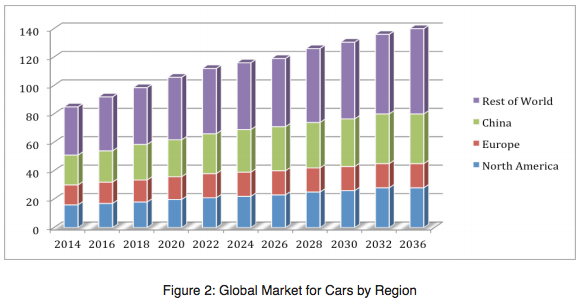
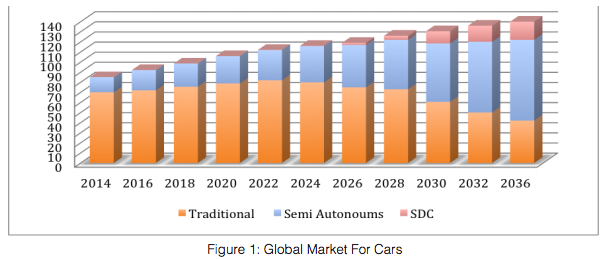
src:
Tao Jiang et al. 2015
“Self-Driving Cars: Disruptive or Incremental?”
Applied Innovation Review, 1. P.6
NOTE: The authors are from Google, Samsung, Yahoo, and Altera, but the data above is not sourced.
TO DO: CONFIRM SOURCES FOR ABOVE DATA. (HAVEN’T BEEN ABLE TO FIND EMAIL ADDRESSES FOR ANY OF THE AUTHORS – MIGHT HAVE TO REACH OUT VIA LINKEDIN, OR THE JOURNAL’S EDITORS.)
*
In 2012, IEEE said that it expected autonomous vehicles to account for up to 75% of cars on the road (globally) by 2040.
TO DO: TRACE THE SOURCE. POSSIBLY ALBERTO BROGGI, UNIV. PARMA, ITALY.
src:
IEEE. September 2012.
“Look Ma, No Hands!”
IEEE News Releases
Autonomous Vehicle Development Timeline
Exhibit 7: Possible time line of autonomous car innovation
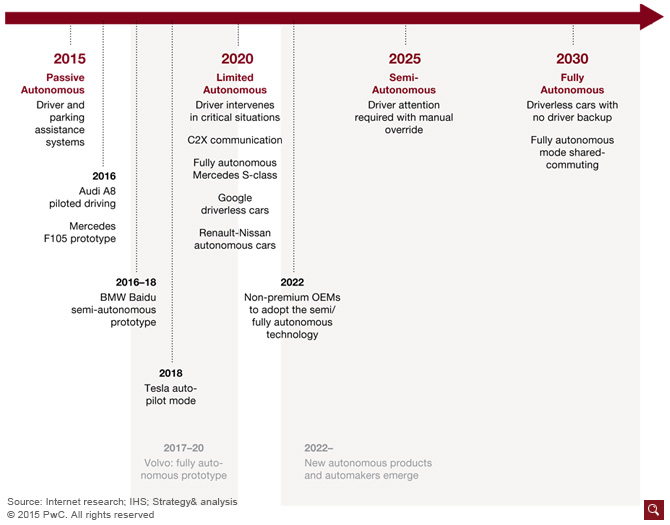
src:
Richard Viereckl et al. September 2015.
“Connected Car Study 2015: Racing ahead with autonomous cars and digital innovation.”
Strategy&. PwC.
NOTE: Although this paper is focused on the European Union, I believe this timeline is general to the industry as a whole.
