

Charts: Monotheism, Retail, Urbanity, Home Size
Ask
Make extrapolated charts for the following:
Monotheism vs. Other & non-affiliated
Ecommerce vs. Physical retail sales
Global urban population
Average house size
Results
Extrapolate: Monotheism vs. other & non-affiliated
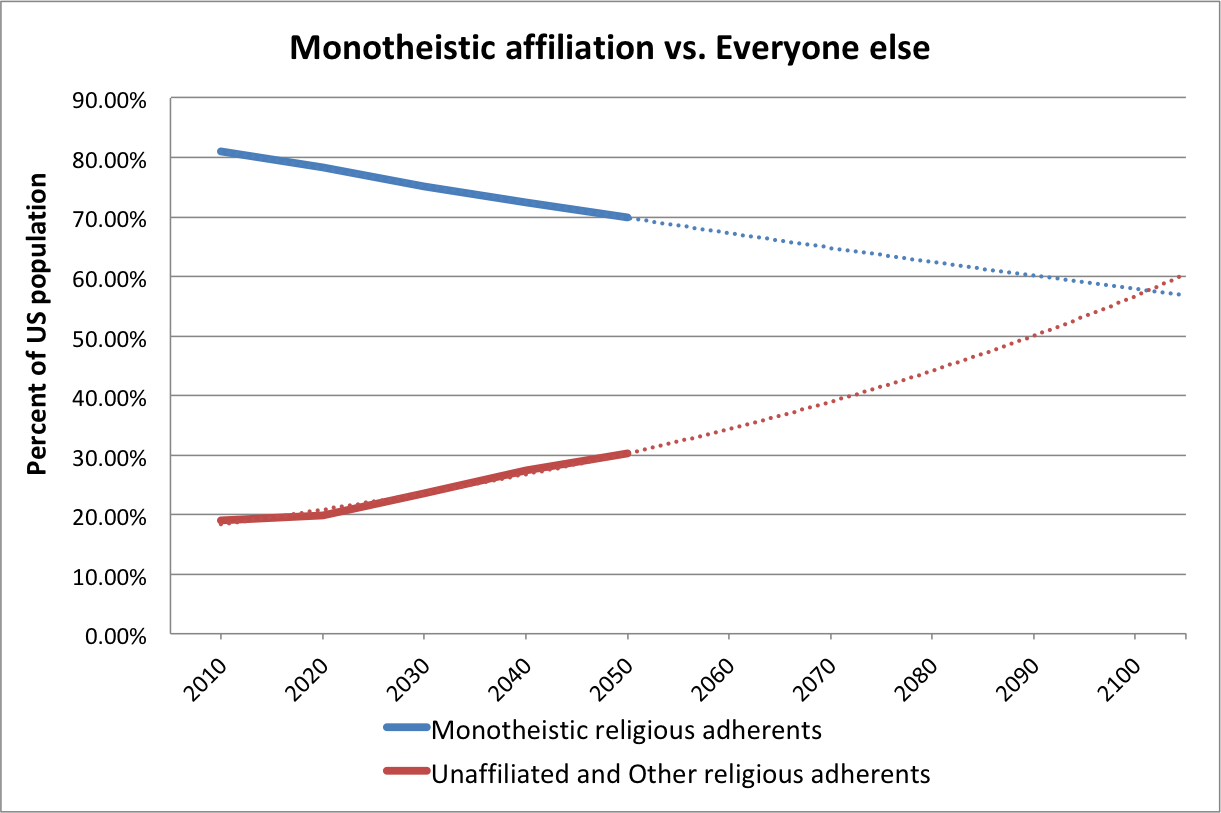
KEVIN: I’M HAVING TROUBLE UNDERSTANDING WHY THESE LINES DON’T CROSS AT 50%. THESE CURVES DON’T SEEM TO BE DIRECTLY CORRELATED.
In this chart, Christians, Muslims, and Jewish adherents are grouped in the Monotheistic adherents category. The red line includes the religiously unaffiliated, Buddhists, Hindus, followers of folk religions, and other religious adherents. Additional methodology on how Pew defined religious groups is available here.
Data for extrapolation (percentage of US population)
2010
Monotheistic religions
Christians 78.3
Jews 1.8
Muslims 0.9
Other
Unaffiliated 16.4
Buddhists 1.2
Folk Relions 0.2
Hindus 0.6
Other Religions 0.6
2020
Monotheistic religions
Christians 75.5
Jews 1.7
Muslims 1.1
Other
Unaffiliated 18.6
Buddhists 1.2
Folk Relions less than 1
Hindus less than 1
Other Religions less than 1
2030
Monotheistic religions
Christians 72.2
Jews 1.6
Muslims 1.4
Other
Unaffiliated 21.2
Buddhists 1.3
Folk Relions less than 1
Hindus less than 1
Other Religions 1.1
2040
Monotheistic religions
Christians 69.1
Jews 1.5
Muslims 1.8
Other
Unaffiliated 23.6
Buddhists 1.4
Folk Relions less than 1
Hindus 1.1
Other Religions 1.3
2050
Monotheistic religions
Christians 66.4%
Jews 1.4
Muslims 2.1
Other
Unaffiliated 25.6
Buddhists 1.4
Folk Relions 0.5
Hindus 1.2
Other Religions 1.5
Sources
Pew Research Center. April 2, 2015.
“The Future of World Religions: Population Growth Projections, 2010-2050.”
US Decadal data
NOTE: Figures for the “less than 1%” values are available for 2010 and 2050 (but not the intervening decades) in the full report
Table: Religious Composition by Country, 2010 and 2050, p.244
*
Extrapolate: Ecommerce Retail
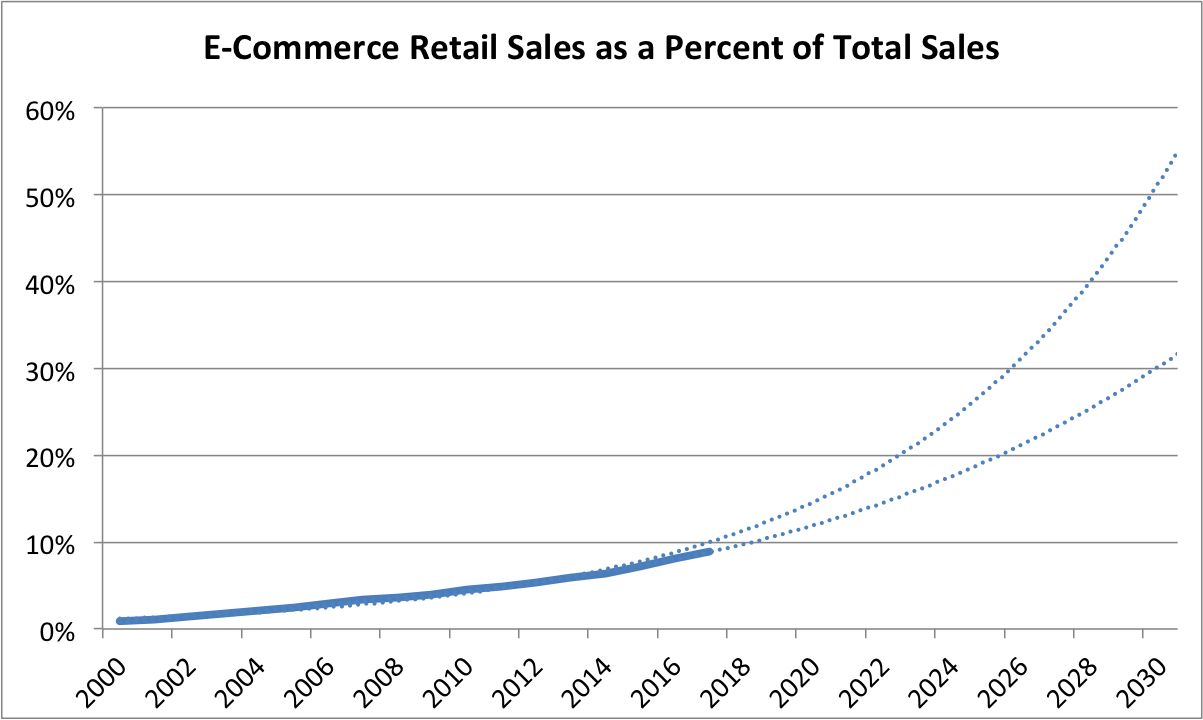
KEVIN – THE STEEPER CURVE IS AN EXPONENTIAL TREND LINE, BUT I FEEL THE POLYNOMIAL TREND LINE LOOKS LIKE A BETTER FIT. AGREE?
Source
U.S. Bureau of the Census, E-Commerce Retail Sales as a Percent of Total Sales [ECOMPCTSA], retrieved from FRED, Federal Reserve Bank of St. Louis; February 28, 2018.
ECOMPCTSA
Frequency: Annual
FRED Graph Observations
Federal Reserve Economic Data
*
Extrapolate: Urbanization

Source
United Nations, Department of Economic and Social Affairs, Population Division (2014). World Urbanization Prospects: The 2014 Revision, custom data acquired via website.
From the FAQ
How do we define “urban”?
We do not use our own definition of “urban” population but follow the definition that is used in each country. The definitions are generally those used by national statistical offices in carrying out the latest available census. When the definition used in the latest census was not the same as in previous censuses, the data were adjusted whenever possible so as to maintain consistency. In cases where adjustments were made, that information is included in the sources listed online. United Nations estimates and projections are based, to the extent possible, on actual enumerations. In some cases, however, it was necessary to incorporate other estimates of urban population size. When that is done, the sources of data indicate it.
*
Extrapolate: Home Size
Kevin, the following paper on US housing stock and floor space is very good. I’ll excerpt generously from it, but you may like to review the original article, “120 Years of U.S. Residential Housing Stock and Floor Space.”
I DON’T HAVE ACCESS TO THE DATA TO BE ABLE TO EXTRAPOLATE, BUT PERHAPS WE COULD REQUEST IT FROM THE AUTHORS.
Excerpts:
Excerpted Discussion:
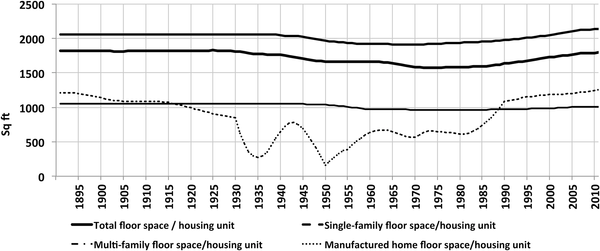
Fig 7 shows the estimated aggregated floor space average over the 120-year period, for each building type, calculated as the ratio of the two estimated time–series, total U.S. floor space and housing stock. Average floor space per unit remained approximately constant throughout the period. A slight ‘dip’ occurred in the 1940–2000 period, but the average returned to pre-1940’s values in the 2000’s, and so floor space per unit averages played a relatively minor role in overall floor space evolution over the very long term.
Excerpted Discussion:
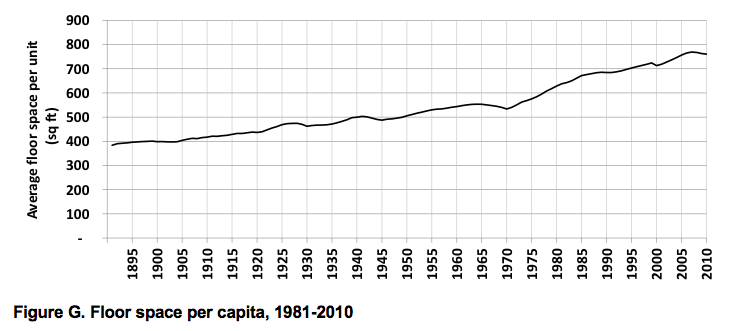
The number of U.S. homes and their associated total floor space have risen dramatically over the last century. From the end of the 19th to the mid-20th century, a net average of half a million homes was added annually to the country’s stock, corresponding to over 850 million square feet added annually. In the last half century, the net average of homes added annually doubled to one million, which led to a tripling of floor space growth, with 2,700 million square feet added annually, with new construction far exceeding retirements. Over the 1891–2010 period, floor space increased almost tenfold, which corresponds to a doubling of floor space per capita (from approximately 400 to 800 square feet (Fig G in S6 File).
Excerpted Conclusion:
Our results show that over the last 120 years floor space and housing stock in the U.S. increased approximately tenfold, while population increased approximately fivefold and household size decreased by a dramatic 50%. Average floor space has remained approximately constant. But can these long-term trends be expected to continue into the future? The interplay between the evolution of population, household size, average floor space growth, as well as other factors, such as the construction rate of single-family homes and the retirement of older smaller vintages, could become significant in future dynamics.
In order to look ahead, it is important to distinguish between short-and long-term trends. The 2008 housing crisis is a recent event from which the housing market is still recovering, so trends in the last decade may not be representative of future developments. Taking the last 30 years into account, however, allows for a better insight into the near future. It is particularly instructive to examine the two factors that have evolved differently over the last three decades, compared to their previous evolution, namely household size and average floor space.
Decreasing household size is a trend with roots in a combination of factors: increased national income, increased mobility, demographic factors such as the aging of the population and the proportion of young adults who are potential homebuyers, and cultural factors such as changing family structures (ex. the increase of the median age at first marriage, family size and the overall decline in the number of married adults, [24]. These factors could contribute to a further long-term decrease of household size, but compared to the decrease in household size since the late 19thC, household size in the U.S. has been decreasing at a slower pace since the 1980’s. In 2007–2010 there was a slight increase from 2.31 to 2.34 persons per household (Fig 6, top), which could either be immediate consequence of the housing crisis, or could indicate a more fundamental change in the long-term trends. A slow economic recovery, with still relatively high unemployment, a rising student debt and the difficulty of obtaining mortgage credits, are all factors that may contribute to a slower decrease or an increase in household size, as young adults are less able to move out of their parents’ homes [25].
In the last 30 years floor space averages have been increasing, as older post-1940 vintages consisting of smaller units, such as those built in the post-war “baby boom” years progressively retire, while larger units are added to the stock. New single family homes built in the first decade of the 21st century averaged 2,673 square feet, while those built in the 1980’s averaged 2,162 square feet (see Table 1). The overall average floor space for units of all building types increased by 13% in the last 30 years, reaching almost 1,800 square feet per unit in 2010 (see Fig 9).
These two factors–household size and floor space averages—have the potential to drive floor space in opposite directions. The observed increase in average floor space is a clear trend, which might only be attenuated if the rate of construction of single-family homes or retirement of older units also slows down. On the other hand, if the tendency for household size to decrease more slowly or increase is indeed a new trend, then both the number of housing units and floor space might accompany population growth more closely than has been the case in the past.
Src:
Maria Cecilia P. Moura, Steven J. Smith, David B. Belzer. August 2015.
“120 Years of U.S. Residential Housing Stock and Floor Space.” PLOS ONE
Note: Figure G (floorspace per capita) is from the supporting document:
S6 File. Results: Floor space time-series.
