Shopping
Summary
This collection of data includes the following indicators, dates, and sources:
Retail Space
shopping center growth, 1975-2014, Int’l Council of Shopping Centers
number of private retail establishments, 2001-2015, Bureau of Labor Statistics (BLS)
store count by category, 2010/2015/2020, Kantar Retail
store square footage by category, 2010/2015/2020, Kantar Retail
Consumer Spending
indexed personal spending, 1950-2016, Trading Economics
percent personal spending, 2016/2017/2020, Trading Economics
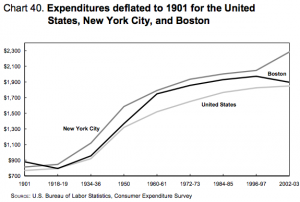
personal expenditures deflated, 1901-2003, BLS
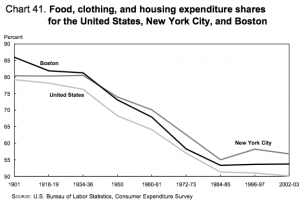
food, clothing, and housing expenditures, 1901-2003, BLS
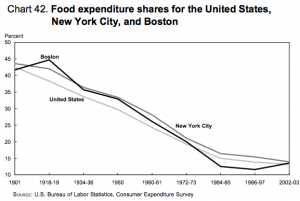
food expenditures, 1901-2003, BLS
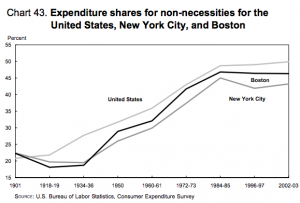
non-necessities expenditures, 1901-2003, BLS
Time Spent Shopping
avg hours per day purchasing consumer goods, 2003-2015, BLS
avg % of people purchasing consumer goods per day, 2003-2015, BLS
avg hours per day for persons so-engaged purchasing consumer goods, 2003-2015, BLS
Online Shopping
retail ecommerce sales as a percent of total US retail sales, 2014-2019, eMarketer
worldwide ecommerce sales growth, 2013-2019, eMarketer
US retail sales as a % of worldwide retail, 2014-2019, eMarketer
US ecommerce sales as a % of total worldwide retail sales, 2014-2019, eMarketer
retail formats % distribution, 2010/2015/2020, Kantar Retail
online share of sales by category, 2009/2014/2020, Kantar Retail
Mall Habits
avg mall visits per month, ~2012, ICSC
avg length of mall visits, ~2012, ICSC
avg monthly spending at malls, 2010/2012, ICSC
Findings
Retail Space
With the U.S. having an estimated 48 square feet of retail space per citizen, the footprint is poised to decline “pretty fast,” Jan Kniffen said.
“On an apples-to-apples basis, we have twice as much per-capita retail space as any other place in the world. The U.K. is second. They’re half of what we are. So, yes, we are the most over-stored place in the world,” he told CNBC’s “Squawk Box.”
In his view, about 400 of America’s 1,100 enclosed malls will fail in the coming years. Of the survivors, about 250 will thrive and the rest will struggle. Likewise, Macy’s probably needs 500 of its roughly 800 existing stores, he said.
src:
Tom DiChristopher. May 12, 2016.
“1 in 3 American malls are doomed: Retail consultant Jan Kniffen.”
CNBC.
Note: This article, though published a year earlier, takes a completely opposite tone of the one above.
Amanda Kolson Hurley. March 2015.
“Shopping Malls Aren’t Actually Dying.”
The Atlantic: CityLab.
*
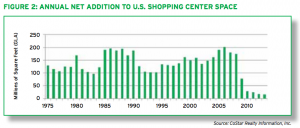
Between 2000 and 2008, U.S. shopping center space – gross leasable area – grew by an annual average rate of 2.6% or a net addition of 169 million square feet (sq. ft.) of retail space per year. However, beginning in 2009, the supply increment slowed dramatically to about one-tenth of that pace. In 2013, the addition of new retail supply grew at its slowest pace in more than 40 years. According to Cushman & Wakefield, over the next three years (2014-2016), the addition of new supply will pick up somewhat as 120.5 million sq. ft. are added to U.S. shopping center inventory. This moderated supply growth is a positive sign going forward (see Figure 2).
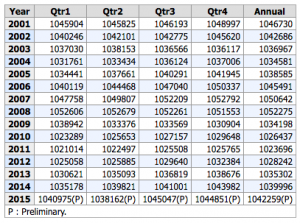
According to the U.S. Bureau of Labor Statistics, the total number of U.S. private retail establishments grew from 1,023,696 in 2011 to 1,028,242 in 2012 – an increase of 4,546 establishments. Preliminary 2013 figures show a further increase of 7,887 retail establishments over 2012 figures to 1,036,129.
src:
International Council of Shopping Centers. 2014.
“Shopping Centers: America’s First and Foremost Marketplace.”
citing:
[CoStar]
and BLS
*
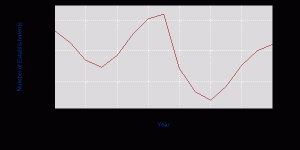
The Bureau of Labor Statistics tracks the number of establishments as part of its Workplace Trends tracking. The following chart and data reflect the number of private retail establishments from 2001 through 2015.
src:
Bureau of Labor Statistics. Accessed August 8, 2016.
“Quarterly Census of Employment and Wages”
Series Id: ENUUS00020544-45
Area: US Total
Industry: NAICS 44-45 Retail trade
Owner: Private
Type: Number of Establishments
linked via “IAG: Retail Trade – NAICS 44-45”
*
Over the next five years, Kantar Retail forecasts that U.S. retail square footage will grow more slowly than the number of stores; in other words, the average store built will be smaller. Conversely, in the previous five years, square footage grew more quickly than stores, resulting in the addition of relatively larger stores (Figure 7).
As Figure 7 indicates, nearly half of new stores over the next five years will be smaller footprint drug, discounter, and convenience stores. As a result, retailers will need to deliver even greater differentiation and specialization from this growth in available points of commerce. Shrunken versions of larger boxes will not suffice. Shoppers will demand that small formats earn their reason for being. Going forward, we expect greater efforts toward differentiation in the small-box space, with in-store marketing (versus simply merchandising) gaining traction.
src:
Kantar Retail. 2015.
“REinvent Format: Adapting to 21st-Century Retailing”
Pp.9, 15
Press contact: Victoria Bradshaw, victoria.bradshaw@kantarretail.com
EMAILED KANTAR RETAIL 8/9/16 TO INQUIRE ABOUT ADDITIONAL DATA POINTS (FOR THIS AND ALL OTHER KANTAR CHARTS MENTIONED IN THIS RESEARCH ROUNDUP).
Consumer Spending
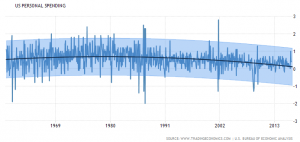
Trading Economics make a short, five-year forecast (currently, to 2020) of various US consumption indicators, based on US Bureau of economic Analysis (BEA) data going back to 1969.
Each indicator has its own page summarizing current data and the forecast to 2020, along with a chart which can be expanded to show data back to ~1950. Each indicator’s page also includes a summary of the forecasts for related indicators. For example, the data on the “United States Personal Spending Forecast 2016-2020” page.
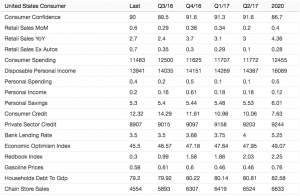
(Note: No units are given in this summary. Generally, the much larger numbers are billions of USD, and the smaller numbers are percentages or index values.)
Trading Economics forecasts are frequently updated (several times per week).
src:
Trading Economics. Accessed August 6, 2016.
“United States Personal Spending: Forecast 2016-2020.”
*
The Bureau of Labor Statistics published a 100-year compilation of national consumer spending data from 1901 through 2003.
Excerpts:
While no two families spend money in exactly the same manner, indicators suggest that families allocate their expenditures with some regularity and predictability. Consumption patterns indicate the priorities that families place on the satisfaction of the following needs: Food, clothing, housing, heating and energy, health, transportation, furniture and appliances, communication, culture and education, and entertainment.
In this report, economic and demographic profiles of U.S. households in the aggregate, as well as profiles of households in New York City and Boston, are presented. New York City and Boston are included because they are two of the country’s oldest urban areas. The report examines how, over a 100-year period, standards of living have changed as the U.S. economy has progressed from one based on domestic agriculture to one geared toward providing global services.
The report provides an in-depth assessment of U.S. households at nine points in time, beginning with 1901 and ending with 2002–03. The text highlights changes in family structure and economic conditions and examines factors that have altered and influenced both society and households. (P.1)
During the 100-year period, household expenditure patterns also demonstrated great variability. … In real dollars, calculated with 1901 as the base, expenditures also demonstrated a notable increase. In 1901, as noted, the average U.S. family had $769 in expenditures. By 2002–03, that family’s expenditures would have risen to $1,848, a 2.4-fold increase. (Chart 40, pp.66-67)
The material well-being of families in the United States improved dramatically, as demonstrated by the change over time in the percentage of expenditures allocated for food, clothing, and housing. In 1901, the average U.S. family devoted 79.8 percent of its spending to these necessities. By 2002–03, allocations on necessities had been reduced substantially, for U.S. families to 50.1 percent of spending. (Chart 41, pp.66, 68)
The continued and significant decline over the century in the share of expenditures allocated for food also reflected improved living standards. In 1901, U.S. households allotted 42.5 percent of their expenditures for food; by 2002–03, food’s share of spending had dropped to just 13.2 percent. (Chart 41, p.68-69)
In 2002–03, the average U.S. family could allocate 49.9 percent ($20,333) of total expenditures for a variety of discretionary consumer goods and services, while the average family in 1901 could allocate only 20.2 percent, or $155, for discretionary spending [eg: family car, reading and education, personal care products, recreation and entertainment, healthcare, alcohol, charitable giving, etc]. (Chart 43, p.70)
src:
US Bureau of Labor Statistics. May 2006.
“100 Years of U.S. Consumer Spending: Data for the Nation, New York City, and Boston.”
Time Spent Shopping
The American Time Use Survey has been conducted annually since 2003. Among many other indicators, it tracks the amount of time Americans age 15 and older spend purchasing goods and services.
src:
Bureau of Labor Statistics. 2003-2015.
American Time Use Survey. ATUS Tables.
“Table A-1. Time spent in detailed primary activities and percent of the civilian population engaging in each activity, averages per day by sex, annual averages.” All years, 2003-2015
NOTE: The “Purchasing goods and services” section of the source table is further itemized. The full itemization is as follows:
Purchasing goods and services
>Consumer goods purchases
>>Grocery shopping
>Professional and personal care services
>>Financial services and banking
>>Medical and care services
>>Personal care services
>Household services
>>Home maintenance, repair, decoration, and construction (not done by self)
>>Vehicle maintenance and repair services (not done by self)
>Government services
>Travel related to purchasing goods and services
The itemization follows from greatest to smallest use of time, EXCEPT for travel, which is the second largest use of time. Grocery shopping generally accounts for about a quarter of the broader consumer goods category, and this is true over the full time period with a slight increase over time (groceries generally hold steady, but the broader category total slowly decreases over time).
Online Shopping
Retail Ecommerce Sales as a Percent of Total Retail Sales in the US, 2014-2019
2014 — 6.4%
2015 — 7.1%
2016 — 7.8%
2017 — 8.4%
2018 — 9.1%
2019 — 9.8%
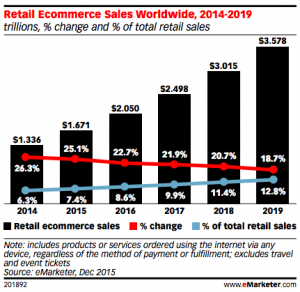
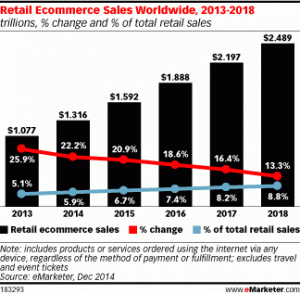
Retail Ecommerce Sales Worldwide, 2014-2019
Showing total ecommerce retail sales, percent change, and percent of total retail sales.
Retail ecommerce sales in North America will rise 14.4% this year to reach $367.44 billion, largely due to increased spending from existing digital shoppers. The region will see consistent double-digit growth through 2019, fueled by expanding online categories, increased average order values and growing mcommerce sales.
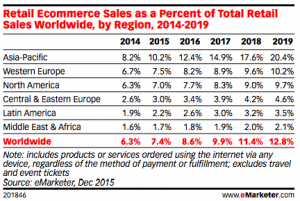
Total Retail Sales Share Worldwide, by Region, 2014-2019
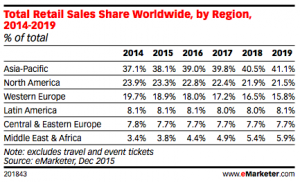
Total Ecommerce Sales as a Percent of Total Retail Worldwide, by Region, 2014-2019
src:
eMarketer. 2015
“Worldwide Retail Ecommerce Sales: Emarketer’s Updated Estimates And Forecast Through 2019.”
*
eMarketer’s previous forecasts
US online retail spending
2015 — 7.1%
2016 — 7.7%
2017 — 8.3%
2018 — 8.9%
src:
eMarketer. December 2014.
“Retail Sales Worldwide Will Top $22 Trillion This Year.”
*
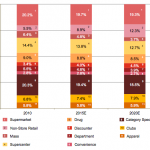
Figure 3: Percent Sales Importance of Retail Formats – 2010 to 2020 [US]
Non-store retail, driven by online today, and likely mobile and tablet commerce in 2020, is projected to be the fastest growing retail channel in the future. Conversely, Supermarket, Drug and especially Mass channel retailers are likely to face a tough growth environment in the coming 2015-2020 period—even if job and income growth surmount global pressures. Likewise, Supercenters, as a percent of total US sales, will decrease to 12.7% from 14.4% today.
src:
PwC/Kantar Retail. 2012.
“Retailing 2020: Winning In A Polarized World.”
P.9
*
src:
Kantar Retail. 2015.
“REinvent Format: Adapting to 21st-Century Retailing”
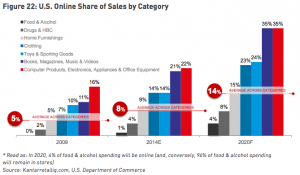
Figure 22: U.S. Online Shares of Sales by Category
P. 21.
Mall Habits
CC’s Note: I’m trying to flesh these single-year data points out. Hoping to get more data from ICSC on the items they’re responsible for below.
*
JCDecaux is an international, outdoor advertising company. They have collected and published the following statistics on mall shopping (most stats seem to be from 2012).
75% of all Americans visit a mall at least once a month. [2]
On average, shoppers visit 3.4 times per month and stay
1 hour and 24 minutes. [1]
Average Time Spent Shopping by Age [1]
Ages 14-17: . . . . . . . . 95 minutes
Ages 18-24: . . . . . . . . 81 minutes
Ages 25-34: . . . . . . . . 79 minutes
Ages 35-44: . . . . . . . . 86 minutes
Ages 45-54: . . . . . . . . 88 minutes
Ages 55-64: . . . . . . . . 87 minutes
Ages 65+: . . . . . . . . . 89 minutes
Average Money Spent Per Visit [4]
Specialty Stores — $109.91
Anchor Stores — $92.80
Monthly Shopping Frequency by Age [4]
Ages 12-17: . . . . . . . . 3.7 times
Ages 18-24: . . . . . . . . 3.2 times
Ages 25-34: . . . . . . . . 3.0 times
Ages 35-44: . . . . . . . . 2.9 times
Ages 45-54: . . . . . . . . 2.9 times
Ages 55-64: . . . . . . . . 3.0 times
Ages 65+: . . . . . . . . . 3.6 times
Shopper spending at malls per month increased from $316.80
in 2010 to $330.82 in 2012. [1]
src:
JCDecaux. Accessed August 8, 2016.
“The Mall Phenomenon.”
citing
1 – ICSC (International Council of Shopping Centers)
PR: Noelle Malone, nmalone@icsc.org
EMAILED 8/8/16 – GOT A REPLY – EXPECTING UPDATED DATA SOON.
2 – Journal of Shopping Center Research
1994-2007 full text archives freely available, but no search
http://jrdelisle.com/JSCR/
Couldn’t track the source
3 – Glimcher Reality Trust
4 – Alexander Babbage, Inc.
Predictions/Scenarios
2030: Half of America’s shopping malls have closed
“For much of the 20th century, shopping malls were an intrinsic part of American culture. At their peak in the mid-1990s, the country was building 140 new shopping malls every year. But from the early 2000s onward, underperforming and vacant malls – known as “greyfield” and “dead mall” estates – became an emerging problem. In 2007, a year before the Great Recession, no new malls were built in America, for the first time in half a century. Only a single new mall, City Creek Center Mall in Salt Lake City, was built between 2007 and 2012. The economic health of surviving malls continued to decline, with high vacancy rates creating an oversupply glut.*
A number of changes had occurred in shopping and driving habits. More and more people were living in cities, with fewer interested in driving and people in general spending less than before. Tech-savvy Millennials (also known as Generation Y), in particular, had embraced new ways of living. The Internet had made it far easier to identify the cheapest products and to order items without having to be physically there in person. In earlier decades, this had mostly affected digital goods such as music, books and videos, which could be obtained in a matter of seconds – but even clothing was eventually possible to download, thanks to the widespread proliferation of 3D printing in the home.* Many of these abandoned malls are now being converted to other uses, such as housing.”
src:
FutureTimeline.net. Accessed August 1, 2016.
“Half of America’s shopping malls have closed.”
*
The Future Real Estate Shopping Experience [undated scenario]
Highlights:
No real estate agents.
VR-based anytime tours that let you see what your stuff would look like in the new place, try different landscaping and remodels.
A machine-learning algorithm monitors your experience to learn your likes and dislikes, recommending other homes to visit.
An AI helps you to write your bid and contact your bank to make an offer on the spot.
src:
Peter Diamandis. March 2015.
“Disrupting Real Estate.”
*
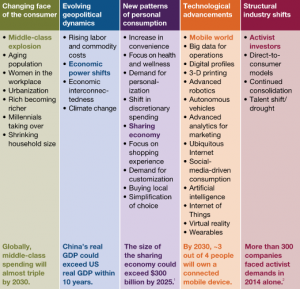
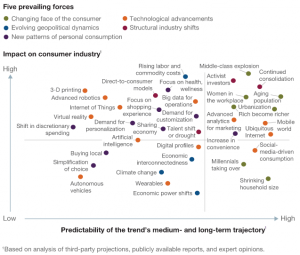
Global forces affecting the consumer sector in 2030
Exhibit 1
Five dominant forces — and an underlying set of trends — will drive change in the consumer landscape over the next 15 years.
Exhibit 2
Trends that could most affect consumer companies.
src:
Richard Benson-Armer, Steve Noble, and Alexander Thiel. December 2015.
“The Consumer Sector In 2030: Trends And Questions To Consider.”
McKinsey & Company.
*
PwC conducts an annual consumer survey, “Total Retail.” The results of the survey published in 2015
PwC. February 2015.
“Physical Store Beats Online as Preferred Purchase Destination for U.S. Shoppers, According to PwC.”
*
Harvard Business Review presented a near-future shopping scenario in the opening of it’s 2011 article on the future of shopping. The article predicted that the scenario would arrive within a handful of years (not quite).
The article closes with some suggestions for how retail stores can use digital technologies innovatively to meet emerging consumer desires.
src:
Darrell K. Rigby. December 2011.
“The Future of Shopping.”
Harvard Business Review.
Other Possible Sources/Contacts
Maureen McAvey
Maureen McAvey is the Bucksbaum Family Chair for Retail at the Urban Land Institute (ULI) in Washington, D.C. She concentrates on urban retail and has led several special projects around demographics and future urban development. She is also a senior staff adviser to ULI’s Building Healthy Places Initiative. [Src]
Email: Maureen.McAvey@uli.org
AT Kearney
Conducts surveys of consumer shopping preferences and behaviors.
EG: “The Omnichancel Consumer Preferences Study”


