

homes
Size of Homes, Global
Ask
What’s the size of average homes around the world?
Results
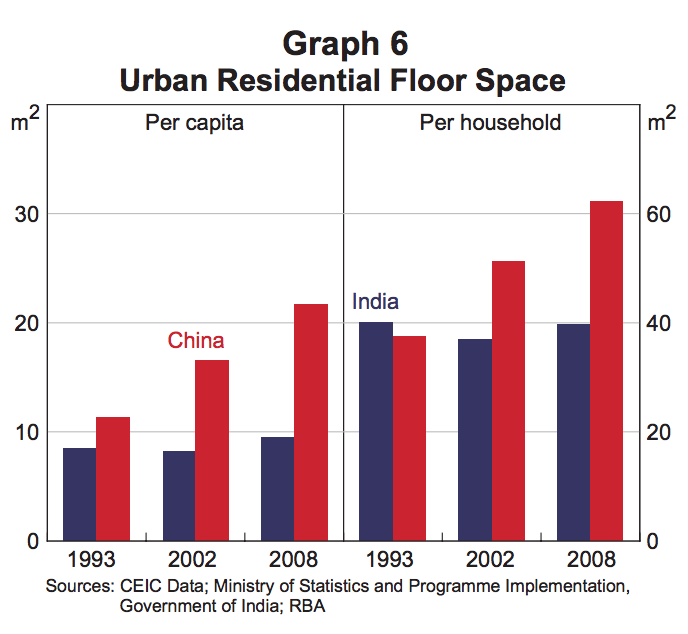
China & India Urban Residential Floor Space in 1993, 2002, 2008
Excerpt:
Average income growth has been a key reason behind these different trends in the quality of the housing stock. The urbanisation process in China has transferred large numbers of workers from relatively low productivity jobs in the rural sector to higher productivity jobs in urban areas. This movement has been a driver of the rapid growth in incomes in China over the past three decades, which has far exceeded the growth in incomes in India (Graph 7). Over time, Chinese households have chosen to spend their higher income on higher quality dwellings and dwellings with larger floor space and, as a consequence, the share of concrete dwellings and residential floor space per capita has increased.
src:
Reserve Bank of Australia, March 2014
“Housing Trends in China and India”
p.66
*
Europe Compared with US Home Sizes, 1950, 1984, 2005, 2015
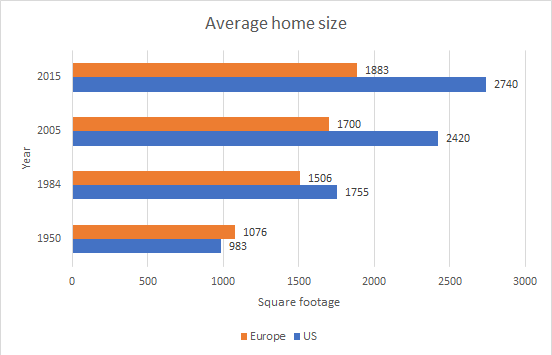
Note: This graphic is a very rough assembly of data reported in mass media publications (not well-cited).
src:
Reddit user chyken
“Comparing average house size in US to Europe, 1950-2015 [OC]”
citing US Census, Elle Decor, Apartment Therapy, Not Buying Anything
*
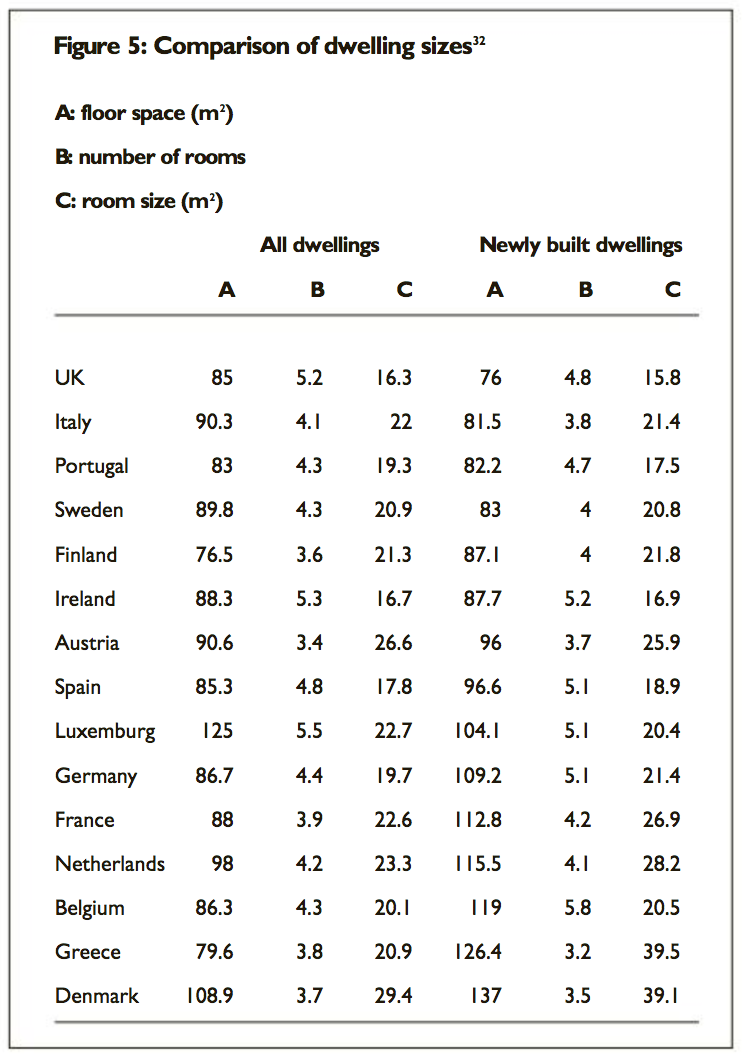
Europe Home Sizes (all vs. newly built)
src:
Evans & Hartwich, 2005
“Unaffordable housing: Fables and myths”
p. 41
*
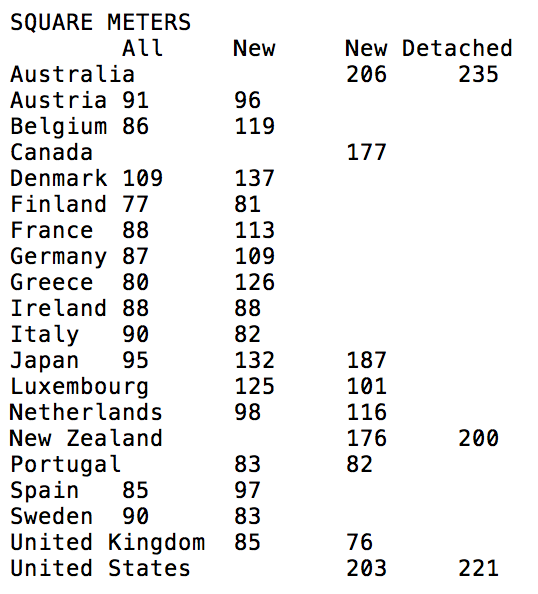
Europe, Australia, Canada, US, Japan (single year)
src:
Demographia (Wendell Cox), 2006 (data via IA)
“International House Sizes”
citing Japan Statistical Yearbook, European Housing 2002, Australian Bureau of Statistics, Canadian Home Builders Association, Infometrics.
*
Home Sizes: Select Europe, US, Canada, China, Australia, Japan (single year)
Note: Lots of overlap with Demographia set, above, but some additional countries
src:
Shrink That Footprint, 2013 (date via IA)
“How big is a house? Average house size by country”
Charts: Monotheism, Retail, Urbanity, Home Size
Ask
Make extrapolated charts for the following:
Monotheism vs. Other & non-affiliated
Ecommerce vs. Physical retail sales
Global urban population
Average house size
Results
Extrapolate: Monotheism vs. other & non-affiliated
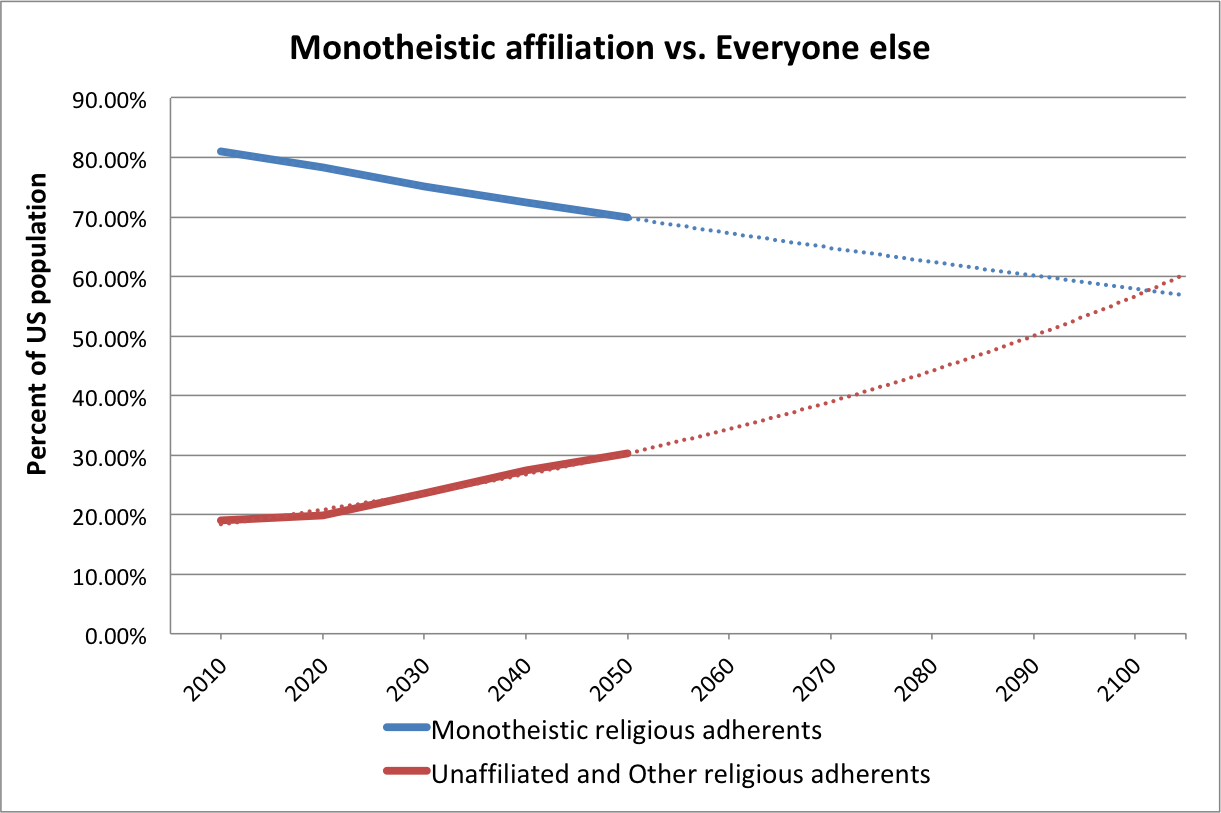
KEVIN: I’M HAVING TROUBLE UNDERSTANDING WHY THESE LINES DON’T CROSS AT 50%. THESE CURVES DON’T SEEM TO BE DIRECTLY CORRELATED.
In this chart, Christians, Muslims, and Jewish adherents are grouped in the Monotheistic adherents category. The red line includes the religiously unaffiliated, Buddhists, Hindus, followers of folk religions, and other religious adherents. Additional methodology on how Pew defined religious groups is available here.
Data for extrapolation (percentage of US population)
2010
Monotheistic religions
Christians 78.3
Jews 1.8
Muslims 0.9
Other
Unaffiliated 16.4
Buddhists 1.2
Folk Relions 0.2
Hindus 0.6
Other Religions 0.6
2020
Monotheistic religions
Christians 75.5
Jews 1.7
Muslims 1.1
Other
Unaffiliated 18.6
Buddhists 1.2
Folk Relions less than 1
Hindus less than 1
Other Religions less than 1
2030
Monotheistic religions
Christians 72.2
Jews 1.6
Muslims 1.4
Other
Unaffiliated 21.2
Buddhists 1.3
Folk Relions less than 1
Hindus less than 1
Other Religions 1.1
2040
Monotheistic religions
Christians 69.1
Jews 1.5
Muslims 1.8
Other
Unaffiliated 23.6
Buddhists 1.4
Folk Relions less than 1
Hindus 1.1
Other Religions 1.3
2050
Monotheistic religions
Christians 66.4%
Jews 1.4
Muslims 2.1
Other
Unaffiliated 25.6
Buddhists 1.4
Folk Relions 0.5
Hindus 1.2
Other Religions 1.5
Sources
Pew Research Center. April 2, 2015.
“The Future of World Religions: Population Growth Projections, 2010-2050.”
US Decadal data
NOTE: Figures for the “less than 1%” values are available for 2010 and 2050 (but not the intervening decades) in the full report
Table: Religious Composition by Country, 2010 and 2050, p.244
*
Extrapolate: Ecommerce Retail
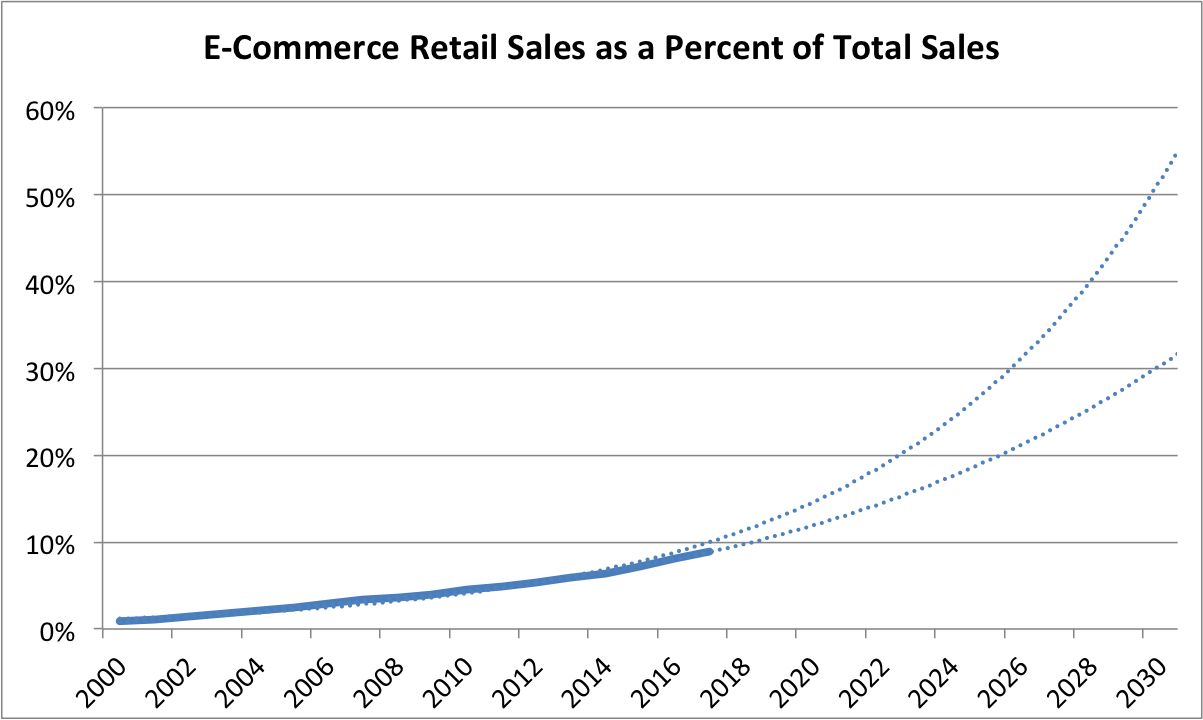
KEVIN – THE STEEPER CURVE IS AN EXPONENTIAL TREND LINE, BUT I FEEL THE POLYNOMIAL TREND LINE LOOKS LIKE A BETTER FIT. AGREE?
Source
U.S. Bureau of the Census, E-Commerce Retail Sales as a Percent of Total Sales [ECOMPCTSA], retrieved from FRED, Federal Reserve Bank of St. Louis; February 28, 2018.
ECOMPCTSA
Frequency: Annual
FRED Graph Observations
Federal Reserve Economic Data
*
Extrapolate: Urbanization

Source
United Nations, Department of Economic and Social Affairs, Population Division (2014). World Urbanization Prospects: The 2014 Revision, custom data acquired via website.
From the FAQ
How do we define “urban”?
We do not use our own definition of “urban” population but follow the definition that is used in each country. The definitions are generally those used by national statistical offices in carrying out the latest available census. When the definition used in the latest census was not the same as in previous censuses, the data were adjusted whenever possible so as to maintain consistency. In cases where adjustments were made, that information is included in the sources listed online. United Nations estimates and projections are based, to the extent possible, on actual enumerations. In some cases, however, it was necessary to incorporate other estimates of urban population size. When that is done, the sources of data indicate it.
*
Extrapolate: Home Size
Kevin, the following paper on US housing stock and floor space is very good. I’ll excerpt generously from it, but you may like to review the original article, “120 Years of U.S. Residential Housing Stock and Floor Space.”
I DON’T HAVE ACCESS TO THE DATA TO BE ABLE TO EXTRAPOLATE, BUT PERHAPS WE COULD REQUEST IT FROM THE AUTHORS.
Excerpts:
Excerpted Discussion:
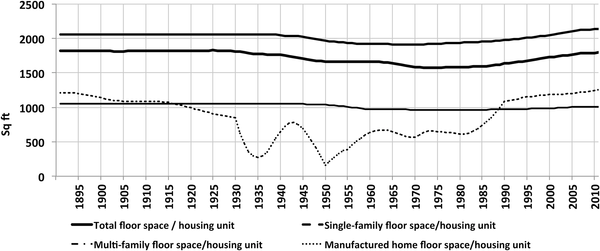
Fig 7 shows the estimated aggregated floor space average over the 120-year period, for each building type, calculated as the ratio of the two estimated time–series, total U.S. floor space and housing stock. Average floor space per unit remained approximately constant throughout the period. A slight ‘dip’ occurred in the 1940–2000 period, but the average returned to pre-1940’s values in the 2000’s, and so floor space per unit averages played a relatively minor role in overall floor space evolution over the very long term.
Excerpted Discussion:
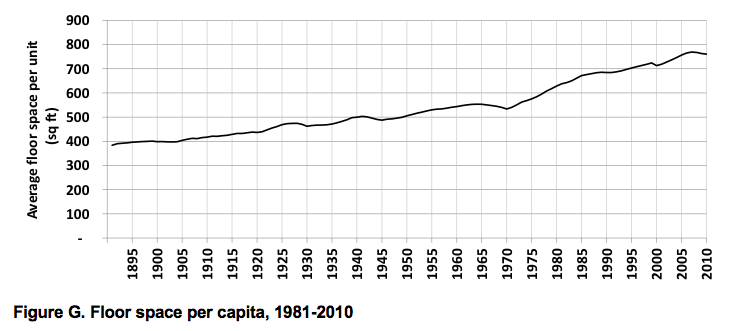
The number of U.S. homes and their associated total floor space have risen dramatically over the last century. From the end of the 19th to the mid-20th century, a net average of half a million homes was added annually to the country’s stock, corresponding to over 850 million square feet added annually. In the last half century, the net average of homes added annually doubled to one million, which led to a tripling of floor space growth, with 2,700 million square feet added annually, with new construction far exceeding retirements. Over the 1891–2010 period, floor space increased almost tenfold, which corresponds to a doubling of floor space per capita (from approximately 400 to 800 square feet (Fig G in S6 File).
Excerpted Conclusion:
Our results show that over the last 120 years floor space and housing stock in the U.S. increased approximately tenfold, while population increased approximately fivefold and household size decreased by a dramatic 50%. Average floor space has remained approximately constant. But can these long-term trends be expected to continue into the future? The interplay between the evolution of population, household size, average floor space growth, as well as other factors, such as the construction rate of single-family homes and the retirement of older smaller vintages, could become significant in future dynamics.
In order to look ahead, it is important to distinguish between short-and long-term trends. The 2008 housing crisis is a recent event from which the housing market is still recovering, so trends in the last decade may not be representative of future developments. Taking the last 30 years into account, however, allows for a better insight into the near future. It is particularly instructive to examine the two factors that have evolved differently over the last three decades, compared to their previous evolution, namely household size and average floor space.
Decreasing household size is a trend with roots in a combination of factors: increased national income, increased mobility, demographic factors such as the aging of the population and the proportion of young adults who are potential homebuyers, and cultural factors such as changing family structures (ex. the increase of the median age at first marriage, family size and the overall decline in the number of married adults, [24]. These factors could contribute to a further long-term decrease of household size, but compared to the decrease in household size since the late 19thC, household size in the U.S. has been decreasing at a slower pace since the 1980’s. In 2007–2010 there was a slight increase from 2.31 to 2.34 persons per household (Fig 6, top), which could either be immediate consequence of the housing crisis, or could indicate a more fundamental change in the long-term trends. A slow economic recovery, with still relatively high unemployment, a rising student debt and the difficulty of obtaining mortgage credits, are all factors that may contribute to a slower decrease or an increase in household size, as young adults are less able to move out of their parents’ homes [25].
In the last 30 years floor space averages have been increasing, as older post-1940 vintages consisting of smaller units, such as those built in the post-war “baby boom” years progressively retire, while larger units are added to the stock. New single family homes built in the first decade of the 21st century averaged 2,673 square feet, while those built in the 1980’s averaged 2,162 square feet (see Table 1). The overall average floor space for units of all building types increased by 13% in the last 30 years, reaching almost 1,800 square feet per unit in 2010 (see Fig 9).
These two factors–household size and floor space averages—have the potential to drive floor space in opposite directions. The observed increase in average floor space is a clear trend, which might only be attenuated if the rate of construction of single-family homes or retirement of older units also slows down. On the other hand, if the tendency for household size to decrease more slowly or increase is indeed a new trend, then both the number of housing units and floor space might accompany population growth more closely than has been the case in the past.
Src:
Maria Cecilia P. Moura, Steven J. Smith, David B. Belzer. August 2015.
“120 Years of U.S. Residential Housing Stock and Floor Space.” PLOS ONE
Note: Figure G (floorspace per capita) is from the supporting document:
S6 File. Results: Floor space time-series.
Homes: Space Use, Moves, Bandwidth
The following indicators describe how people use the space in their homes, how frequently they move, and how internet-connected households are.
Descriptions of the way people use the space in their homes are largely qualitative and general. Some historical surveys describe general differences in home design and space use from one historic period to another, but these surveys are not quantitative. In the early 20th century, there were a few time-use and space-use studies conducted by home economists, but I’ve not seen a single source that aggregates the data from different geographic zones, and I’m not aware of any contemporary surveys. These early 20th-century studies, which mostly focused on kitchens, informed the development of minimum standards, which continued to evolve into the middle and later part of the century. Again, I’ve found single instances of minimum standard recommendations, but no historical quantitative comparisons of how the standards have evolved. I’ve come across one 10-year and one 20-year outlook describing general changes in housing plans, which may be on-going.
Historic fixed-line broadband subscriptions are available from the UN’s International Telecommunication Union (ITU), 2000-2014. Pew surveys going back to 2000 show that home broadband adoption has plateaued between 2013 and 2015. A 2009 Technology Futures broadband forecast to 2020 also shows predicts plateauing starting from about 2015. Cisco has published a four-year forecast of broadband speeds to 2019.
The US Census Bureau estimated the number of times a typical American will move in 2007. FiveThirtyEight updated that estimate in 2013. It may be possible to calculate this figure for previous years using older Census data. Historic estimates of the number of people moving each year are available from the Census going back to 1948.
Use of Rooms/Space
Moya K. Mason. 2009.
“Housing: Then, Now, and Future”
(date inferred via Internet Archive)
This is a general overview describing changes in the size and utilization of residential spaces, from the 18th century to present. The author has also collected excerpts from their sources here.
Ebby Halliday, REALTORS. 2009.
“Residential Housing 2030 and Beyond”
This is an outline of a focus group conversation among 25-to-40-year-olds discussing their present housing needs, and anticipated needs in the next 20 years. Very rough notes. Appears to be a consensus for smaller square footage of homes with larger, multi-purpose rooms, and larger back yards. This document was presented at the 2009 conference “North Texas Alternative Futures” in Irving, Texas, an on-going series sponsored by the Urban Land Institute.
“Residential: Embracing New Lifestyles”
Section in 2016 Gensler Design Forecast — Lifestyle
Gensler is a global architecture, design, and planning firm.
10-year outlook for trends in residential building. Brief, and highly qualitative. Communal housing (cohousing), with shared amenities, will become acceptable to post-college adults, single parents, and the elderly. Changes in work style and lifestyle will increase the need for part-time housing. Mixed-use developments will increasingly include housing. “Uburbs,” midway between the city and suburbs, are an emerging residential market.
TO-DO: CONTACT GENSLER TO INQUIRE IF THIS IS AN ON-GOING FORECAST, AND THE DATE OF THE OLDEST.
*
EMAILED ARTHUR C. NELSON
Professor of Urban Planning and Real Estate Development, Univ. Arizona
HE WAS INTERESTED IN THE TOPIC, BUT NOT AWARE OF ANY SOURCES
*
Other possible sources:
The American Institute of Architects
Virginia Tech College of Architecture & Urban Studies
Georgia Institute of Technology College of Architecture
Design Futures Council (DFC)
American Society of Interior Designers
contact:
David Krantz
Vice President, Research and Knowledge Management
dkrantz@asid.org
EMAILED 6/1 – REPLIED SAYING NO IMMEDIATE LEADS, BUT HE’LL LOOK INTO IT
Interior Design Society
Designer Society of America
Certified Interior Decorators
University of Illinois Small Homes Council-Building Research Council
US Minimum Property Standards
Best Interior Design Graduate Schools, Design Intelligence (DFC)
Savannah College of Art and Design
Pratt Institute
Rhode Island School of Design
EMAILED LILIANE WONG 6/2, HEAD OF THE INTERIOR ARCH DEPT
Kansas State University
New York School of Interior Design
Best Architecture Graduate Schools, Design Intelligence (DFC)
Harvard Univ
Cornell Univ
EMAILED KATHLEEN GIBSON 6/2, WHO MAINTAINS THEIR INTYPES DATABASE
SHE’S ON SABATICAL THROUGH 2017
EMAILED JAN JENNINGS 6/2, WHO FOUNDED THE INTYPES DB
SHE HAS NO SUGGESTIONS
Yale Univ
Columbia Univ
MIT
UC Berkeley
EMAILED PAUL GROTH 6/2
HE RECOMMENDS ASKING Richard Longstreth (GWU) AND URBAN LAND INST
TO-DO: FOLLOW UP WITH THESE LEADS
U. Michigan
Rice Univ.
Virginia Tech
EMAILED KATHLEEN PARROTT 6/1
Washington Univ. St. Louis
*
Interior Designer Jobs
Number of Jobs, 2014 — 58,900
Job Outlook, 2014-24 — 4% (Slower than average [which is about 7%])
Employment Change, 2014-24 — 2,200
src:
“Interior Designers.” 2014. Bureau of Labor Statistics, U.S. Department of Labor, Occupational Outlook Handbook, 2016-17 Edition.
Note: This 4% growth is a significant slowing from the BLS’s 2010 estimate of 19% job growth from 2010 to 2020 [average at the time].
Number of Jobs, 2010 — 56,500
src:
“Interior Designers.” 2012. Bureau of Labor Statistics, U.S. Department of Labor, Occupational Outlook Handbook, 2012-13 Edition. Via Internet Archive.
*
Virginia Tech conducted survey-based research in 2000 examining what people do in their kitchens, they have in them, what kind of cooks they are, and what they want from their kitchens.
I don’t think the survey has been updated, and the research summary does not contain much specific historic information, but I’ve written to the lead author to inquire about historic data and forecasts. EMAILED 6/1.
Excerpts:
What do people do in their kitchens? What types of cooks are they? What do they have in their kitchens and how do they react to the design, layout, convenience, and function of their existing kitchens? And perhaps most importantly, what does this tell us about how to plan and design the kitchens of the future?
In an effort to answer these questions, a multi-stage research project was developed. First, a content analysis of shelter, design, and kitchen magazines investigated current trends and features of kitchen design. Then a local sample of over 75 cooks was brought to the Center for Real Life Kitchen Design at Virginia Tech. These cooks were interviewed about their home kitchens and how they used them. The cooks were measured and then videotaped cooking a meal. Finally, a national telephone survey with 630 respondents gathered broad information about kitchens and cooks from around the country.
Household Characteristics
Who participated in the research project? The local and national samples were similar in their demographic make-up. In addition:
*A majority of the respondents in both samples (over 90%) were from households of fewer than four people. The most common types of households were a family or adult couple (approximately 1/3 each).
*Both samples included more females than males, within a wide variety of age and income brackets.
*Approximately 75% of each sample lived in single-family residences they owned. There was not a dominance of any particular age or size of residence.
*The national sample was equally divided among small town, rural, city and suburban residences.
Key conclusions from the study can be grouped into categories: what people do in their kitchens, who is cooking, how people cook, what people have in their kitchens, and what people want in their kitchens.
People have many small appliances (an average of 12 per household).
Some small appliances are stored on counter tops (four is typical).
src:
“Someone’s in the Kitchen… – A summary of the Findings of the Kitchen Space and Storage Research Projects.”
Kathleen Parrott, Ph.D., CKE
JoAnn Emmel, Ph.D.
Julia Beamish, Ph.D., CKE
Center for Real Life Kitchen Design
Department of Apparel, Housing, and Resource Management
Virginia Tech
Accessed June 1, 2016. This page was published in 2015, but the research was conducted in 2000, per this new release. The research informed a 2007 text book, Kitchen Planning, referenced below.
contact:
Kathleen Parrott — homes@vt.edu
*
One-off study from 1963 with household storage minimums (specific recommended minimums for closets, clothes closets, linen closets, kitchen storage, access, and general storage). Unable to find a contemporary equivalent.
src:
Rudard A. Jones. July 1963.
“Household Storage Study.”
Research Report 13-1
University Of Illinois
Small Homes Council — Building Research Council
Several other “universal design” papers and recommendations have been published throughout the 20th century (for example, DeMerchant & Beamish, 1995).
This trend toward recommended standards began in the 1930s when home economists with USDA started systematically researching and documenting the use of time and space in homes (especially kitchens) as a way of improving rural housing conditions. Results of many early USDA time-use surveys are available here.
Some home design books include discussion of recent home design trends. For example, Kitchen Planning (NKBA, 2013), includes discussion of general housing trends and consumer preferences, drawing upon recent surveys by NAHB, Better Homes and Gardens, and the American Institute of Architects. This work also includes a very general description of older kitchen and work-area research studies (like the USDA’s, mentioned above). However, the discussion focuses on the current demand, and does not give detailed attention to the pace of the change. TO-DO: IT MIGHT BE POSSIBLE TO MINE THE SURVEYS AND REPORTS REFERENCED IN NKBA 2013 FOR SPECIFIC STANDARDS FROM THE 1930S, 1950S, 1970S, 1990S, AND 2000S TO CHART THE METRIC EVOLUTION OF THE STANDARDS. THE CHAPTER DOES INCLUDE A NARRATIVE SUMMARY OF CHANGES BY DECADE FROM 1900 THROUGH THE 21ST CENTURY (MY PREVIEW TOPS OUT AFTER THE 1920S SUMMARY).
References include:
Beecher & Stowe 1869
Frederick 1913
Deane G. Carter 1932 — AES bulletin
Maud Wilson 1938 “The Willamette Valley Farm Kitchen”
Maud Wilson 1947b “Considerations in Planning Kitchen Cabients”
Heiner and McCullough 1948 “Functional Kitchen Storage”
Small Homes Council (SHC) 1949 “Cabinet Space for the Kitchen”
McCullough 1949
Heiner and Steidel 1951
Howard 1965
Kapple 1964; Wanslow 1965
Jones and Kapple 1975
Yust and Olsen 1992 “Residential Kitchens: Planning Principles for the ‘90s”
Cheever 1992 “Utensil Survey Project”
NOTE: THIS WORK FOUND THAT THE NUMBER OF ITEMS STORED IN THE KITCHEN HAD INCREASED 110% FROM THE NUMBER REPORTED IN 1948 (BY HEINER AND MCCULLOUGH).
Emmel, Beamish and Parrott 2001 “Someone’s in the Kitchen”
NAHB 2011
“New Homes in 2015 Will be Smaller, Greener and More Casual.”
Sullivan 2010
“Home Sizes Continue to Shrink.”
Better Homes and Gardens survey
Baker 2010
“Small Talk: Kitchens and Baths Do More With Less”
search for ref to AIA survey
Frequency of Moves
How many times will a typical American move in their life?
2007 – 11.7
2013 – 11.3
US Census Bureau doesn’t ask directly, but it calculates this figure based on which age groups are most likely to move in a given year and the overall composition of the US population.
src:
Mona Chalabi. January 29, 2015.
“How Many Times Does The Average Person Move?”
FiveThirtyEight
TO-DO: FIND/COMPUTE THIS FIGURE USING CENSUS DATA FOR PREVIOUS YEARS.
The Census Bureau describes their methodology here.
The move data comes from the American Community Survey, questions about “State-to-State Migration Flows.”
Tables are available from 2005 through 2014 at the American Factfinder portal.
Data is also available from the decennial censuses going back to 1940, links below.
1980 (page 85+)
*
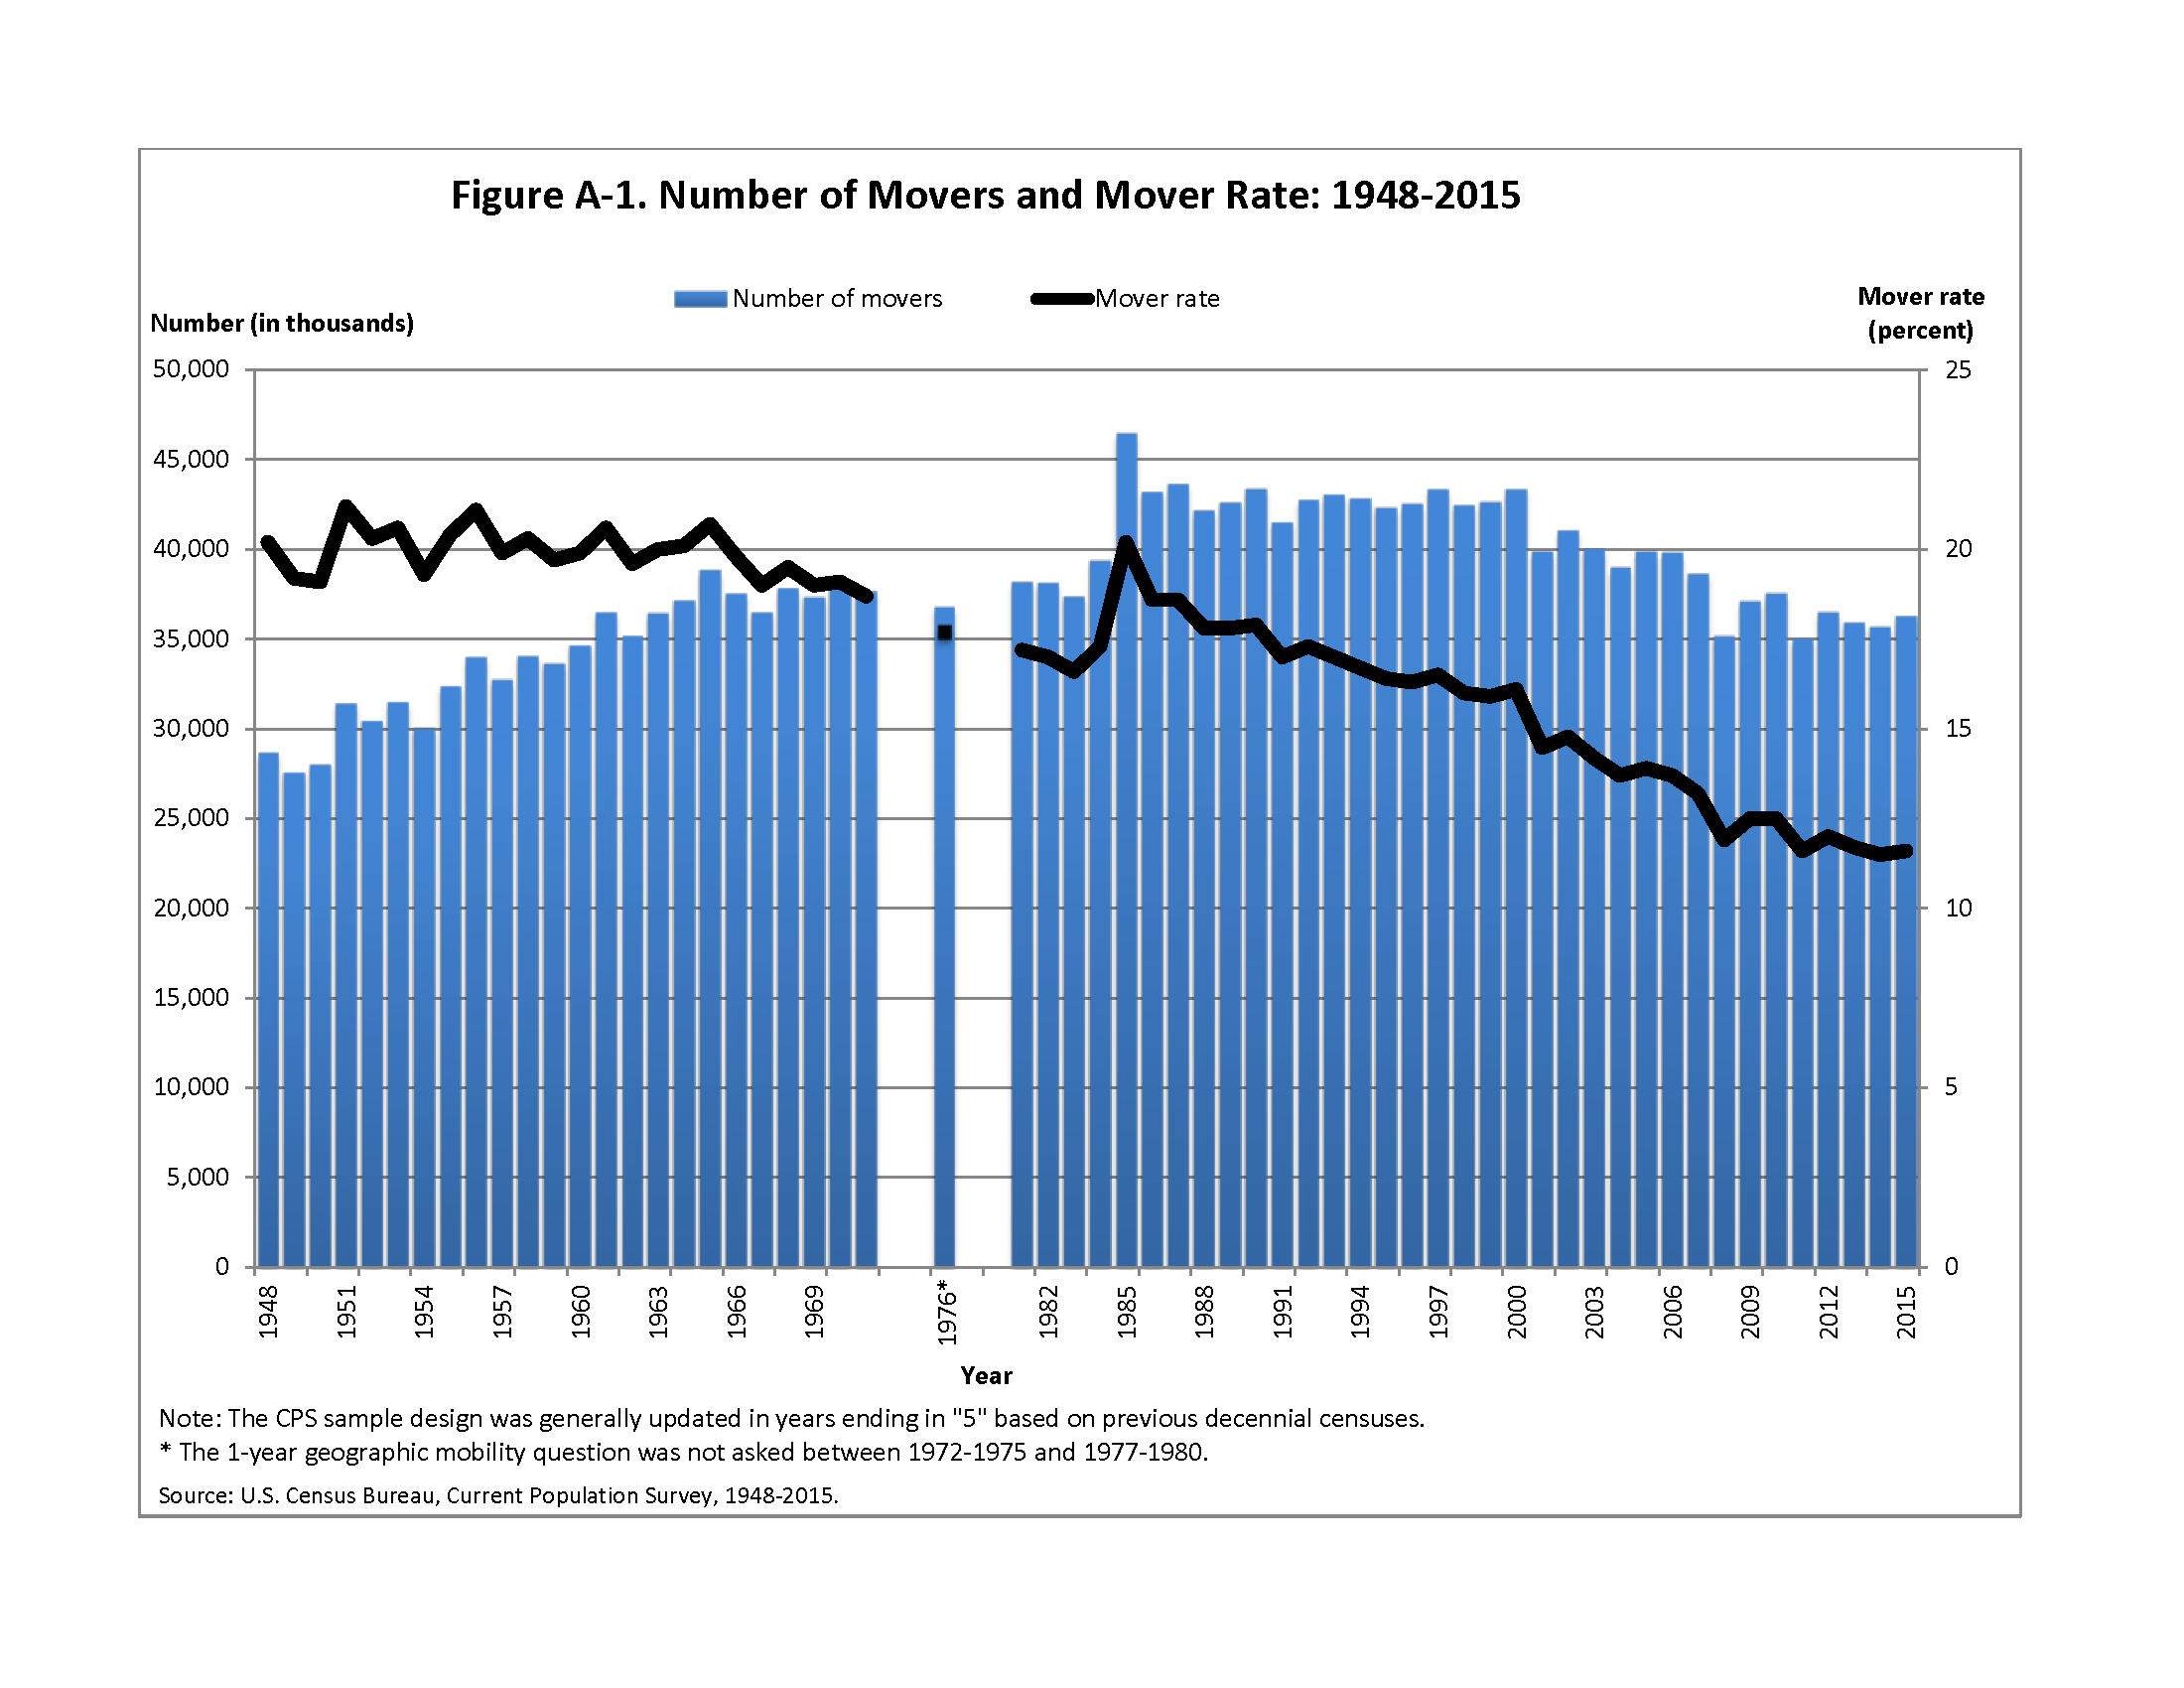
Note: Slightly different from 2007 and 2013 values suggested above
src:
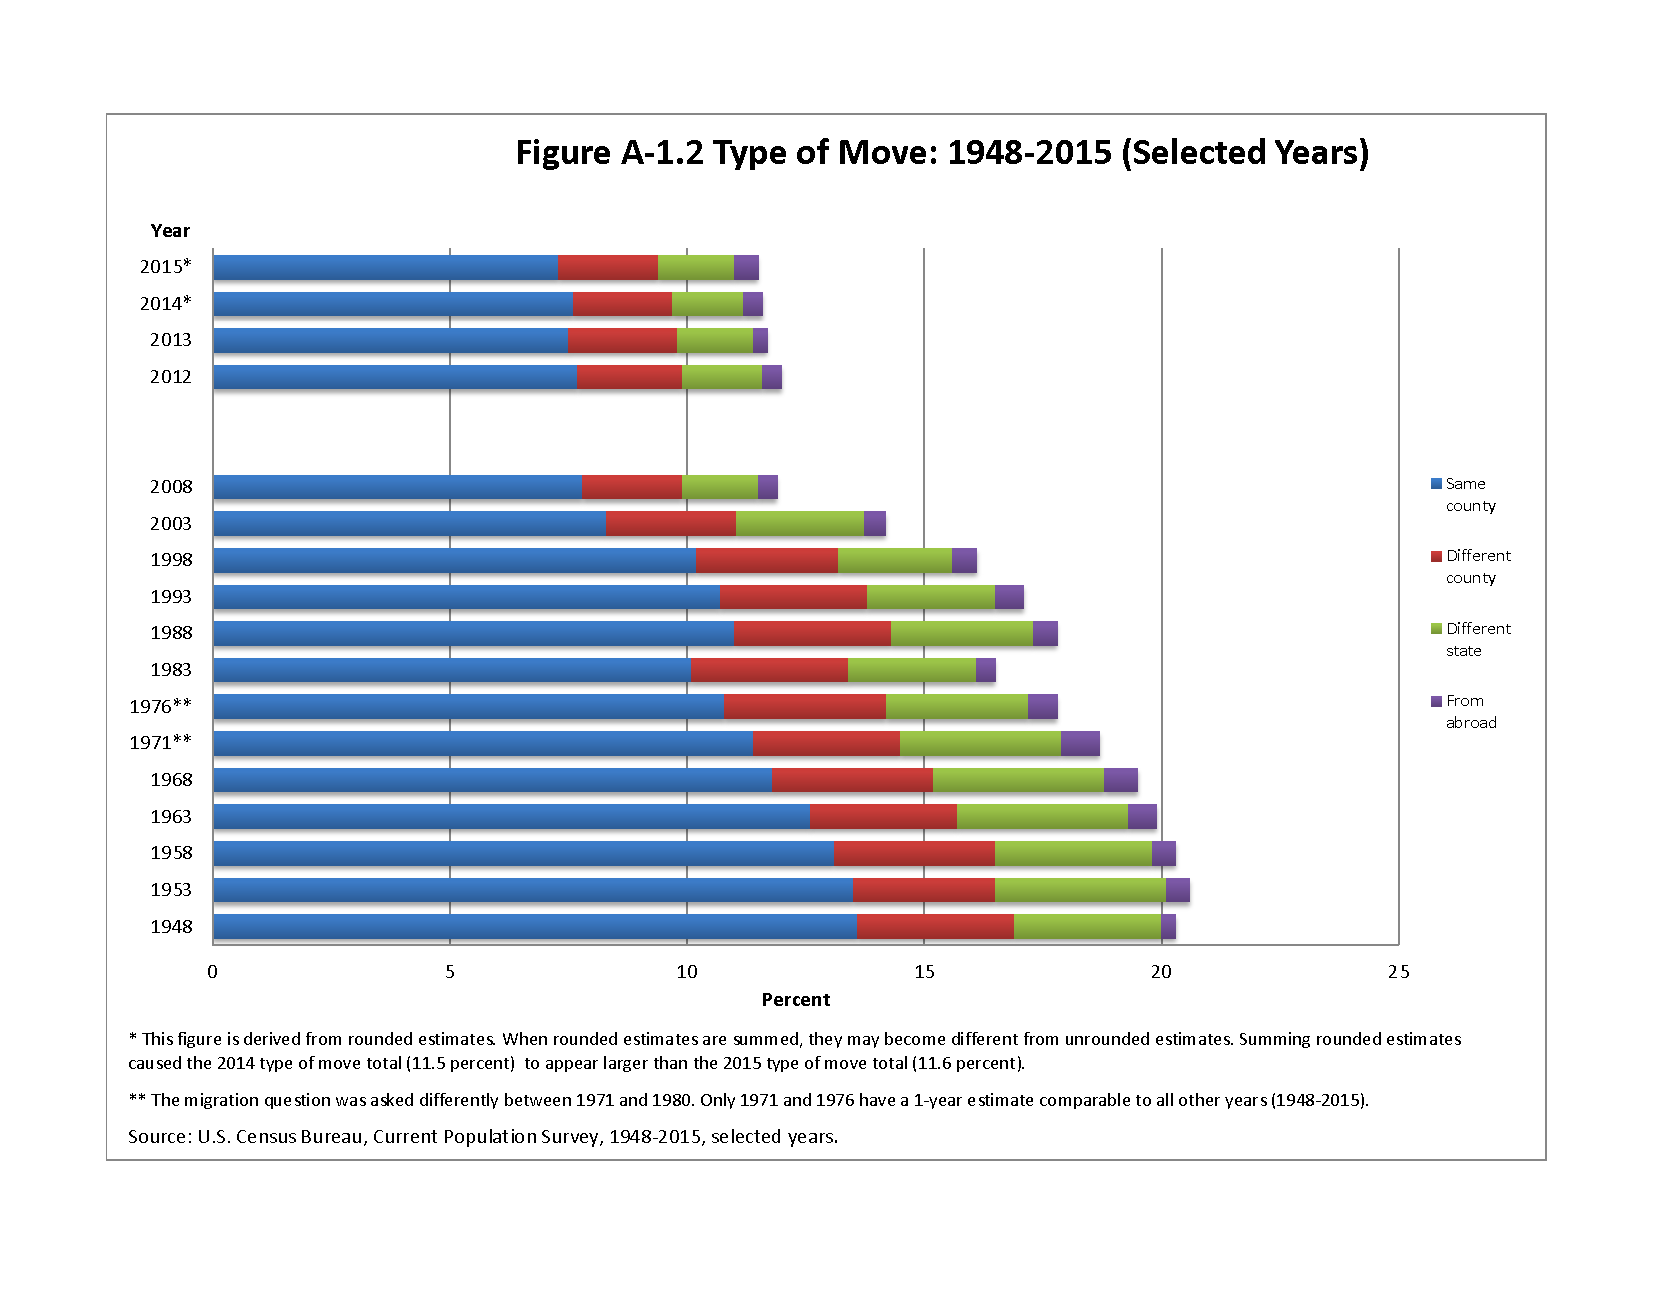
“CPS Historical Migration/Geographic Mobility Tables” 2015.
US Census Bureau.
Figure A-1.1
Figure A-1.2
*
A 2014 white paper by the National Bureau of Economic Research argues that, since the 1980s, Americans are moving less because they’re changing jobs less often.
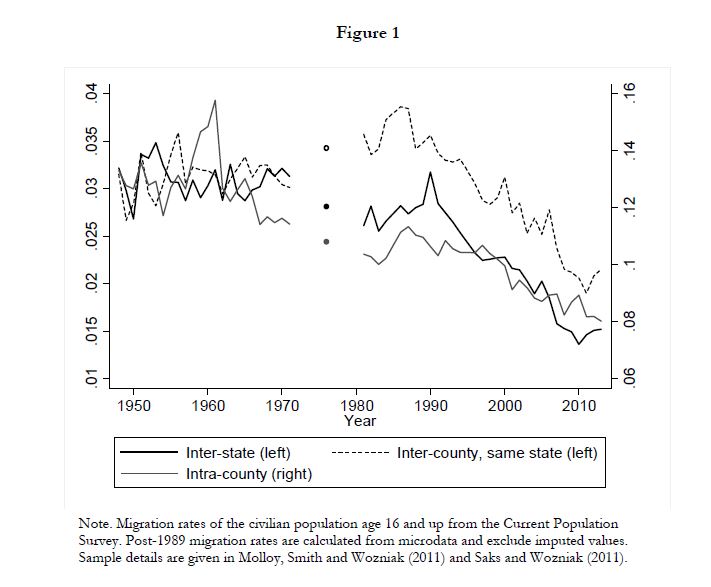
Using data from the Current Population Survey, US Census.
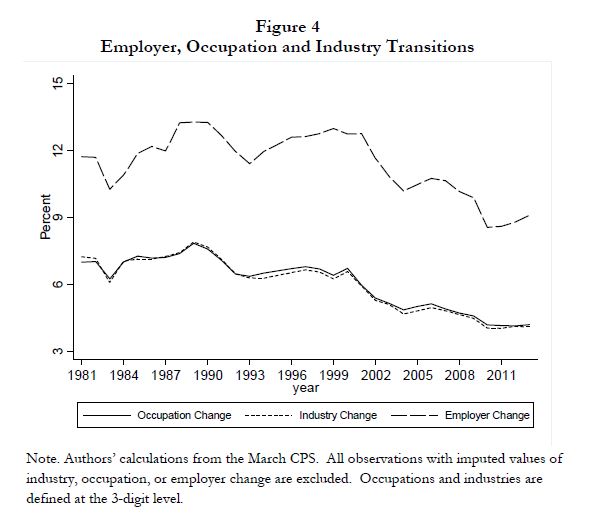
Using data from National Longitudinal Surveys of Youth from the late 1970s to the late 2000s
TO-DO: CHECK IF THE ANNUAL DATA ARE AVAILABLE IN THE NBER PAPER. THE PAPER IS FREE FOR JOURNALISTS TO DOWLOAD, BUT WE NEED TO COMPLETE REGISTRATION (PENDING AS OF 6/2).
src:
Raven Molloy, et al. April 2014.
“Declining Migration within the U.S.: The Role of the Labor Market”
National Bureau of Economic Research (NBER)
via:
Richard Florida. April 28, 2014.
“Why Americans Are Moving Less: New Jobs Aren’t Worth It.”
CityLab — The Atlantic
Bandwidth to Homes
U.S. Fixed-broadband subscriptions, 2000-2014
Aggregated in the following Google Sheet:
src:
ITU. 2015.
“U.S. Fixed-broadband subscriptions.”
via the ITU Statistics page
*
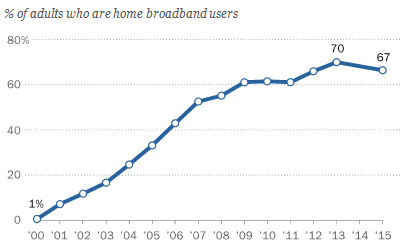
Pew finds that home broadband use has plateaued
Pew also finds that several groups are shifting their home internet connectivity away from broadband and toward smartphones.
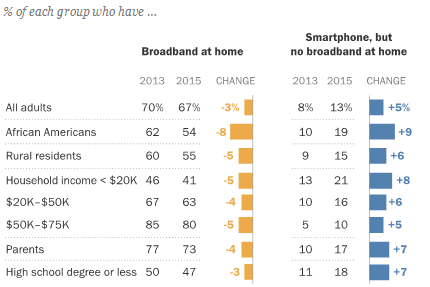
src:
Pew Research Center. December 2015.
“Home Broadband 2015.”
*
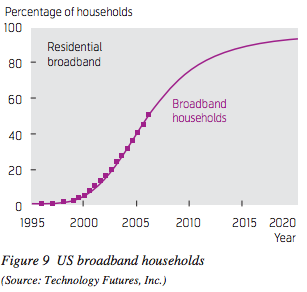
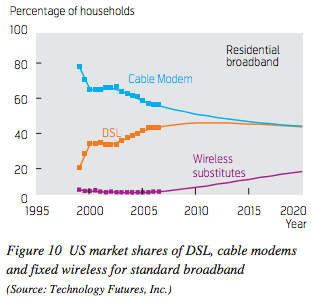
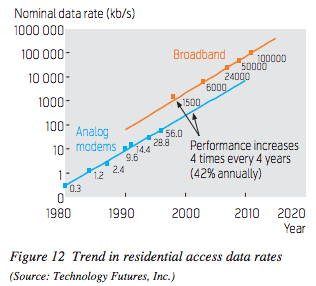
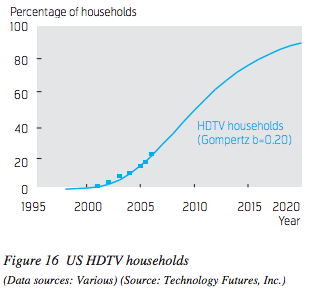
In 2002, Technology Futures published several forecasts of residential broadband subscriptions and speeds looking out to 2020. The base model forecast is informed by the Gompertz model, which is usually followed by major consumer adoptions.
The forecasts are notably off from the Pew and ITU reports above. However, one of the historical comparisons in the paper, to Pay Cable adoption, might help to explain the problem with their own forecast for broadband subscriptions.
Pay Cable’s adoption figures from 1973-1981 do not follow the Gompertz model because of a disruption by VCR adoption. Home broadband subscriptions may be experiencing a similar disruption by mobile devices with internet subscriptions.
src:
Lawrence K. Vanston, et al. 2002.
“Residential Broadband Forecasts.”
Technology Futures Inc.
contact: lvanston@tfi.com
In 2009, Technology Futures published an updated broadband forecast to 2020:
src:
Lawrence K. Vanston, Ray L. Hodges. February 2009.
“Forecasts for the US Telecommunications Network.”
Telektronikk 3/4.2008.
*
Chart 3: Actual download speeds by ISP, 2011 to 2014
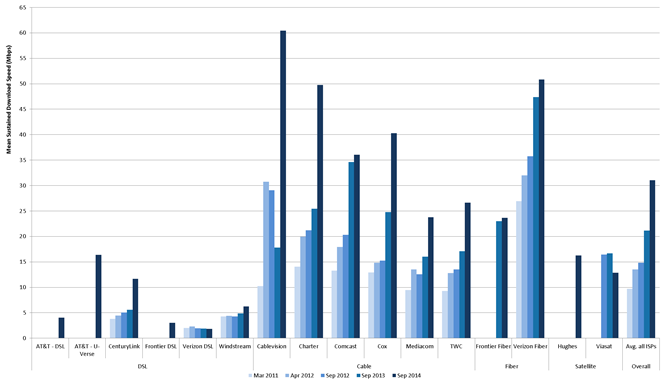
Excerpt:
Chart 3 shows the actual download speeds experienced by each participating ISP’s subscribers — averaged across all analyzed speed tiers, geography, and time — from 2011 to 2014. The actual download speed, averaged across all participating ISPs, has tripled during this period, from approximately 10 Mbps in March 2011, to approximately 15 Mbps in September 2012, to nearly 31 Mbps in September 2014.
src:
FCC. December 30, 2015.
“2015
Measuring Broadband America Fixed Broadband Report.”
*
Table 4. Fixed Broadband Speeds (in Mbps), 2014–2019, North America
2014 — 21.8
2015 — 25.4
2016 — 28.7
2017 — 33.7
2018 — 38.7
2019 — 43.7
CAGR 2014-2019 — 15%
Excerpt:
Broadband speed is a crucial enabler of IP traffic. Broadband speed improvements result in increased consumption and use of high-bandwidth content and applications. The global average broadband speed continues to grow and will more than double from 2014 to 2019, from 20.3 Mbps to 42.5 Mbps. Table 4 shows the projected broadband speeds from 2014 to 2019. Several factors influence the fixed broadband speed forecast, including the deployment and adoption of fiber to the home (FTTH), high-speed DSL, and cable broadband adoption, as well as overall broadband penetration. Among the countries covered by this study, Japan, South Korea, and Sweden lead in terms of broadband speed largely due to their wide deployment of FTTH.
Note: North America is tied with Central and Eastern Europe for the lowest CAGR.
src:
Cisco. June 23, 2015.
“The Zettabyte Era—Trends and Analysis.”
*
Census – Type of Household Internet Connection
2013 data here.
2013 is the first year of tracking
done under the American Community Survey (ACS)
Only other year with this data available is 2014.
The Current Population Survey (CPS) has asked about internet access since 1997.
*
src:
Statista (original source hidden behind paywall)
Homes
Summary
This is a roundup of basic statistics describing American homes including homeownership rates, housing starts, second home ownership, urban vs. rural home distribution, housing features distribution, total households, and home sales/spending. Most of the data are historic, with a couple forecasts (for housing starts and total households).
Historic home ownership rates are available from the US Census Bureau from the present going back to 1965. Statistics broken down by age-group are available back to 1982.
Forecasts for housing starts are available to 2025 from Forisk. Much shorter one-year forecasts are available from the National Association of Home Builders. Historic housing starts data are available from the UC Census Bureau at least to 2000, possibly as far back as 1959 (TO DO: CHECK FOR OLDER DATA)
Decadal historic data for the number of vacation homes are available from 1940 to 2000 from the US Census Bureau. Biennial data for the number of seasonal homes from 1973 through 2005 have been aggregated by the US Department of Housing and Urban Development (HUD). These figures just describe the number of second homes, but I’ve found a couple sources describing the number of households that own second homes (second home ownership rates). Statista has data for the number of people living in households that own second homes from 2008 to 2015. The US Federal Reserve (Fed) has “other residential real estate” ownership rates broken down by a variety of demographic characteristics going back to 1989 (their survey is conducted every three years). The Joint Center for Housing Studies Harvard University (JCHS) has a comparison of second homeownership by age for 1995 and 2004 (using data from the Fed).
HUD has aggregated figures on the distribution of urban vs. rural housing from 1973 to 2005.
The US Census Bureau has a collection of housing features data for new single family homes, multifamily units, and multifamily buildings. Many of the data points go back to 1973, some only to 2005. Features tracked include square footage, number of stories, number of bedrooms, number of bathrooms, number of fireplaces, type of heating system, type of heating fuel, type of foundation, type of parking, outdoor features, lot size, number of units sold by price. Figures include the total number of houses/units, and the percentage distribution.
Statista has figures on the total number of US households from 1960 to 2015. The JCHS has a forecast (based on Census data) to 2035 for total households, as well as households by age, race, and occupancy relationships (single, married, families, etc).
NAHB has a line chart showing the number of new single-family homes sold from 1978-2012. Annual numeric values for 2011-2015 are available in a separate NAHB document. Data points for previous individual years may be available from NAHB upon request. In any case, the Census has data on new residential sales going back to 1963. Census also has median and average sales prices for new homes sold back to 1963, and type of financing for houses sold back to 1988. NAHB has an indexed comparison between residential construction spending for single-family homes, multifamily units, and improvements from 2000 through 2016.
Findings
Ownership vs Renting
Homeownership Rates for the US and Regions: 1965 to Present
src:
US Census Bureau. Accessed May 16, 2016.
Housing Vacancies and Homeownership (CPS/HVS)
Historical Tables
“Table 14. Quarterly Homeownership Rates for the U.S. and Regions: 1965 to Present”
and imported to this Google Sheet.
*
Annual Homeownership Rates for the United States and Regions, 1968-2015
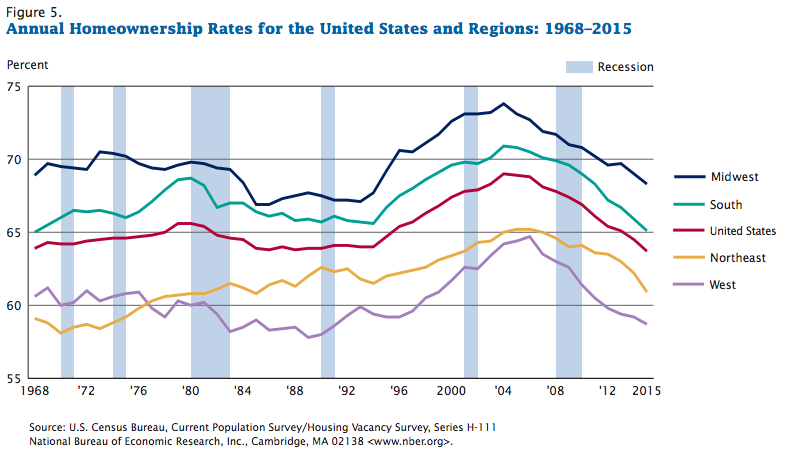
src:
US Census Bureau. Accessed May 16, 2016.
Current Population Survey/Housing Vacancy Survey, Series H-111.
*
Annual Homeownership Rates for the United States by Age Group, 1982-2015

src:
US Census Bureau. Accessed May 16, 2016.
Current Population Survey/Housing Vacancy Survey, Series H-111.
Housing Starts
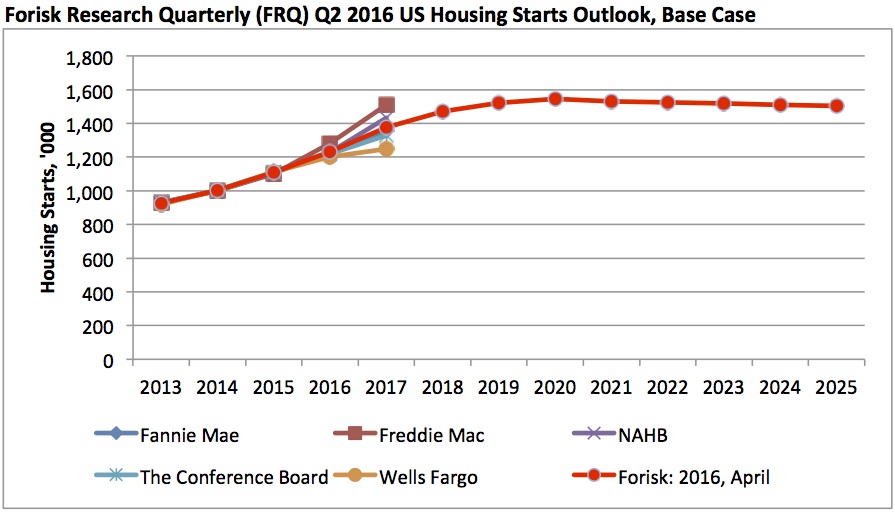
Forisk provides consulting services to the forest industry, wood bioenergy and timberland investing sectors.
src:
Brooks Mendell. April 22, 2016. “Forisk Forecast: US Housing Starts Outlook, Q2 2016 Update.” Forisk.
*
2011-2017 Housing Starts, New Single Family Sales, Existing Single-Family Home Sales, Interest Rates
src:
NAHB. “Housing and Interest Rate Forecasts”
Accessed May 16, 2016 via the NAHB Forecasts page.
Exported to this Google Sheet.
*
New Housing Units Started in the United States
Note: Possible to infer multifamily starts from this chart by subtracting the single-family starts from total starts.
src:
“New Residential Construction”
US Census Bureau. Accessed May 18, 2016.
Data likely comes from one of these time series, for example, which go back to 1959.
Second Homes
Vacation Homes – United States, 1940-2000 (decadal data only)
Aggregated in the following Google Sheet.
src:
US Census Bureau. Accessed May 20, 2016.
“Historical Census of Housing Tables: Vacation Homes”
Note: the Census Bureau has annual data in individual annual reports, but this is the best aggregation I’ve found so far.
*
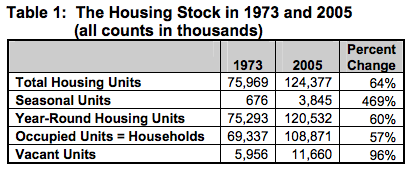
Excerpt:
Year-round units are either occupied or vacant. Note that “occupied” and “vacant” have precise definitions that do not coincide exactly with the common understanding of these words. A house may have one or more persons living in it, but if those persons typically reside somewhere else, the house is considered vacant from the perspective of the AHS. The decennial censuses use the same logic because this approach ensures that every household has one and only one place where it “resides,” and the approach also results in the number of households being equal to the number of occupied housing units.
Using this logic, a unit is vacant if it is not the “usual residence” of some household. Defined this way, a vacant unit is in some sense an excess unit—like having more chairs than children in a game of musical chairs. Table 1 shows that vacant units grew almost twice as fast as households between 1973 and 2005. This fact, combined with the growth in seasonal units, accounts for the increase in the ratio of housing units to households.
Data points aggregated in the following Google Sheet.
src:
Frederick J. Eggers, et al. October 2007.
“32 Years of Housing Data.” P.4-5, A2-A8
U.S. Department of Housing and Urban Development
*
Second home ownership: Number of people living in households that own a second home in the United States (USA) from spring 2008 to spring 2015 (in millions)
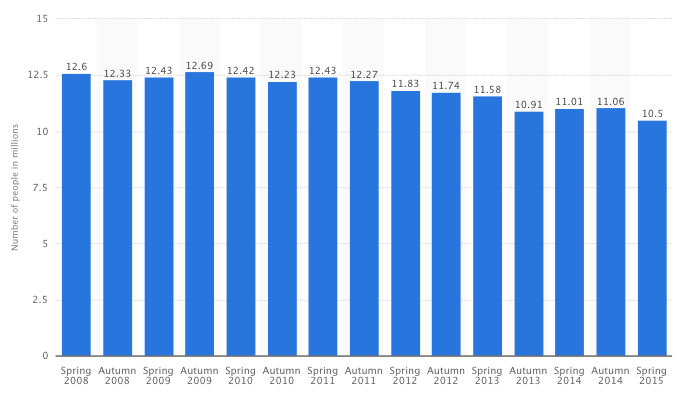
This statistic illustrates the number of people living in households that own a second home in the United States (USA) from spring 2008 to spring 2015. In spring 2008, the number of people who said they live in a household that own a second home in the United States (USA) amounted to around 12.60 million.
src:
Statista (source hidden). Accessed May 23, 2016.
“Second home ownership: Number of people living in households that own a second home in the United States (USA) from spring 2008 to spring 2015 (in millions)”
Note: I suspect the data either comes from the Census Bureau or the Survey of Consumer Finances, but I haven’t found the exact report/indicator.
*
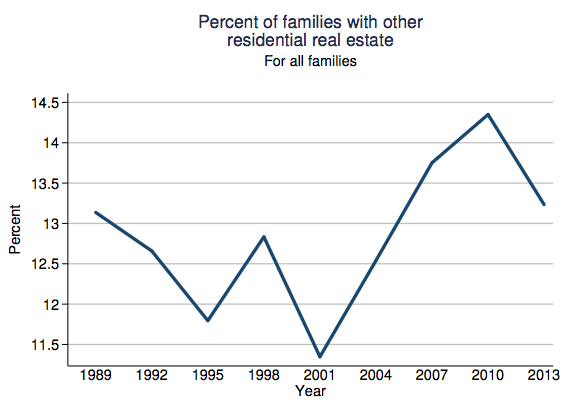


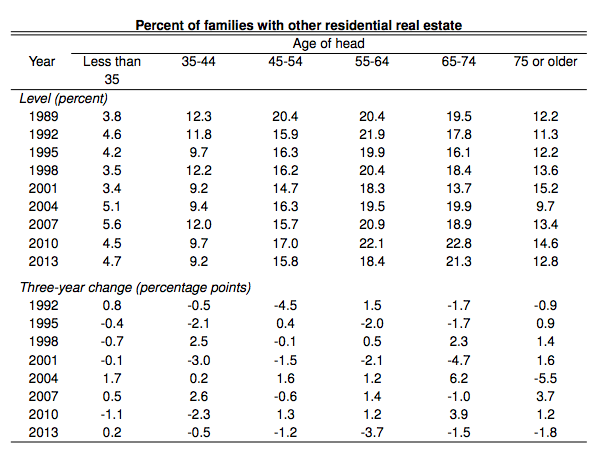

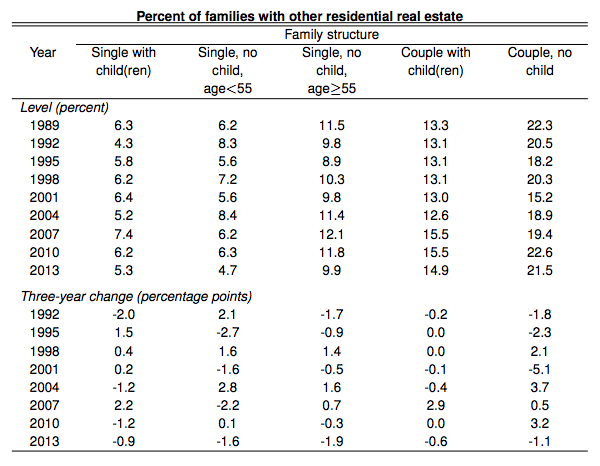

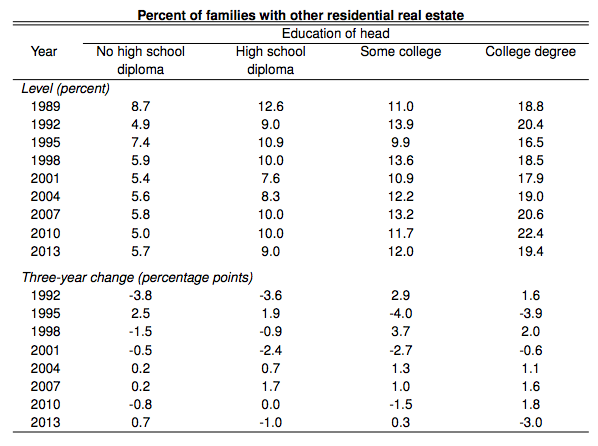
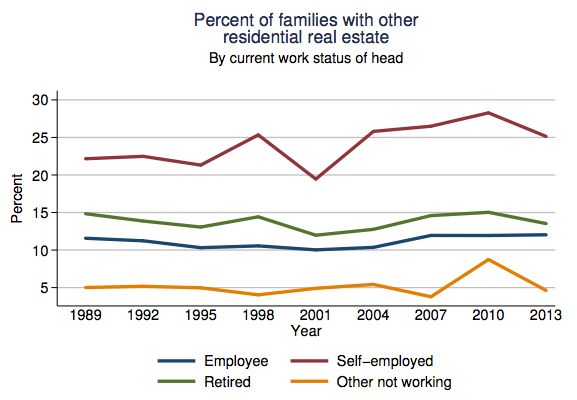


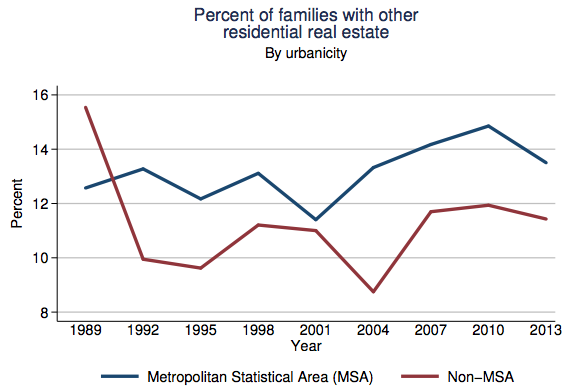


src:
Survey of Consumer Finances. September 2, 2014.
“2013 SCF Chartbook.” The 2013 Survey of Consumer Finances.
The Federal Reserve.
P.651-683
*
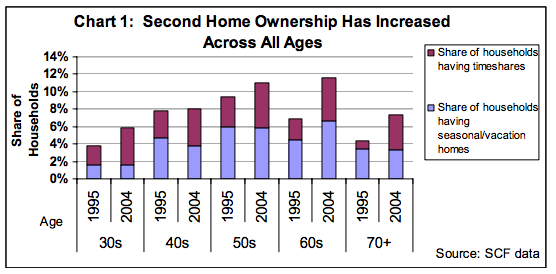
src:
Eric S. Belsky, et al. 2006.
“Multiple-Home Ownership and the Income Elasticity of Housing Demand.”
Joint Center for Housing Studies Harvard University.
citing Survey of Consumer Finances
Note: The source explains that the American Household Survey, the Housing Vacancy Survey, and the decennial Census all include estimates of the number of second home units. Surveys that ask households about whether they own additional properties include: The American Housing Survey; the Survey of Consumer Finances (SCF); the Survey of Income and Program Participation (SIPP), the Panel Study of Income Dynamics (PSID), and industry surveys such as one of new homebuyers conducted by the National Association of Home Builders (2000) and by the National Association of Realtors® (NAR) of homebuyers and homeowners. However, the SCF, conducted by the Federal Reserve Bank, is the only survey conducted on a regular basis (every three years).
Urban/Rural Distribution of Homes
Excerpt:
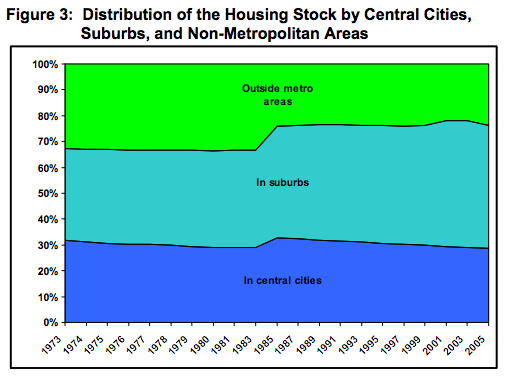
Figure 3 traces the changing shares of the housing stock in “outside metropolitan” areas, in suburbs, and in central cities. The over-the-period changes coincide with expectations; the suburban share is substantially larger in 2005, while the shares in central cities and outside metropolitan areas are smaller. However, the trends are not smooth. The share outside metropolitan areas falls sharply between 1983 and 1985, and the central city share generally declines except for a one-time increase between 1983 and 1985. The discontinuities between 1983 and 1985 result from the introduction of new definitions of metropolitan area—changes that increased the population in central cities and suburbs at the expense of the non-metropolitan population. By 2005, suburbs accounted for 47 percent of the housing stock, central cities for 29 percent, and outside metropolitan areas for 24 percent.
src:
Frederick J. Eggers, et al. October 2007.
“32 Years of Housing Data.” P.7.
U.S. Department of Housing and Urban Development
Housing Features
Highlights of Annual 2014 Characteristics of New Housing
Summary of characteristics for new single family homes, multifamily units, and multifamily buildings in 2014.
src:
US Census Bureau. Accessed May 18, 2016.
“Highlights of Annual 2014 Characteristics of New Housing”
*
For the data from the US Census Bureau below, the following definitions may be relevant:
RSE/SE – Relative Standard Error (percent), Standard Error (percentage points)
NA – Not available
A – Represents an RSE or SE that is greater or equal to 100 percent or could not be computed
Z – Less than 500 units or less than 0.5 percent
S – Withheld because estimate did not meet publication standards on the basis of response rate
or a consistency review
The Census data below is all also accessible through the Census Bureau’s “New Single-Family Homes in 2014” interactive graphic. Data for completed (but not necessarily sold) home are also available via that graphic.
Principal Type of Exterior Wall Material of New Single-Family Houses Sold, 1978-2014
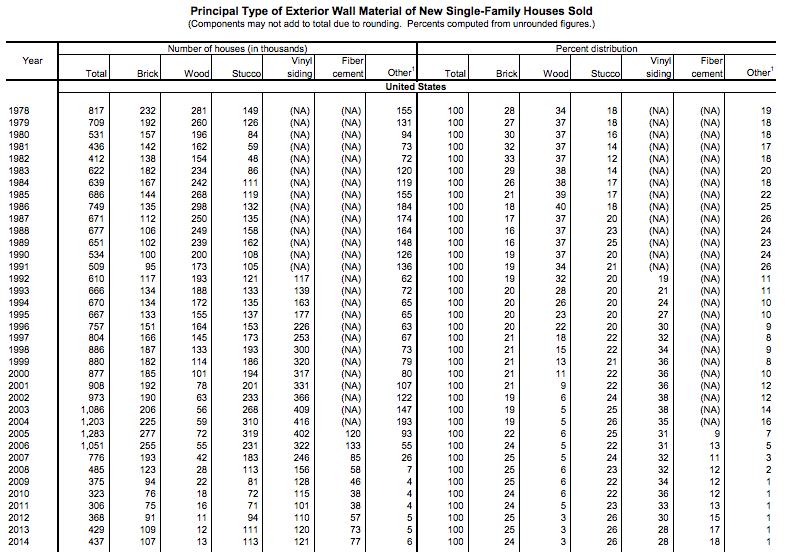
Note 1: Includes concrete block, stone, aluminum siding, and other types.
Data prior to 2005 include fiber cement. Data prior to 1992 include vinyl siding.
src:
US Census Bureau. Accessed May 16, 2016.
“Principal Type of Exterior Wall Material of New Single-Family Houses Sold.” P.1.
*
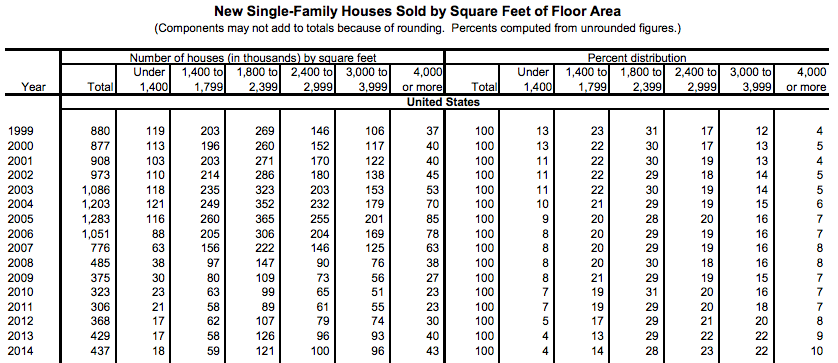
Square Feet of Floor Area in New Single-Family Houses Sold, 1999-2014
src:
US Census Bureau. Accessed May 16, 2016.
“Square Feet of Floor Area in New Single-Family Houses Sold.” P.1.
*
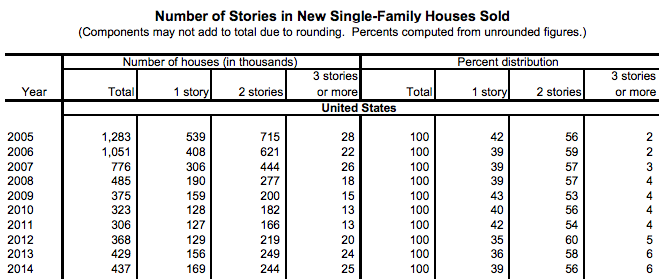
Number of Stories in New Single-Family Houses Sold, 2005-2014
src:
US Census Bureau. Accessed May 16, 2016.
“Number of Stories in New Single-Family Houses Sold.” P.1.
*
Number of Bedrooms in New Single-Family Houses Sold
1973-2014
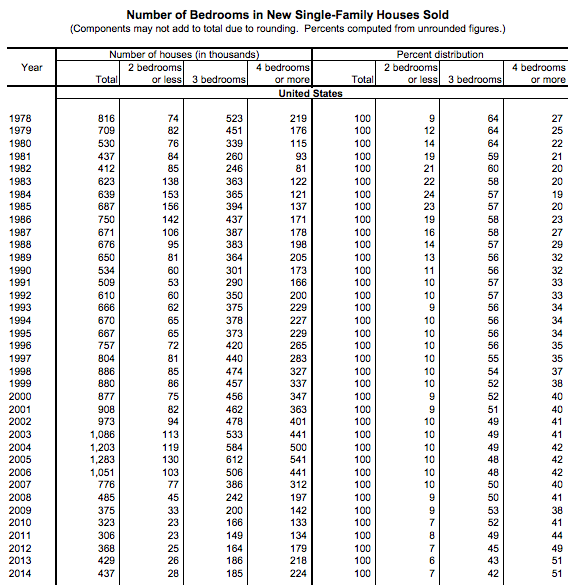
src:
US Census Bureau. Accessed May 16, 2016.
“Number of Bedrooms in New Single-Family Houses Sold.” P.1.
*
Number of Bathrooms in New Single-Family Houses Sold, 1978-2014
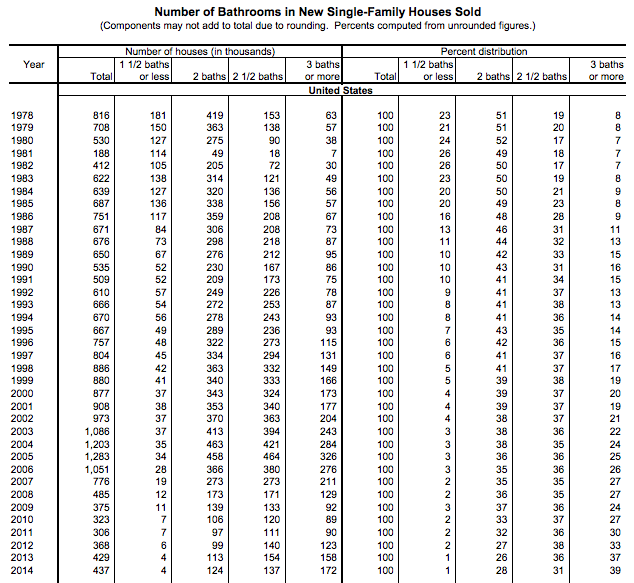
src:
US Census Bureau. Accessed May 16, 2016.
“Number of Bathrooms in New Single-Family Houses Sold.” P.1.
*
Presence of Air-Conditioning in New Single-Family Houses Sold, 1978-2014
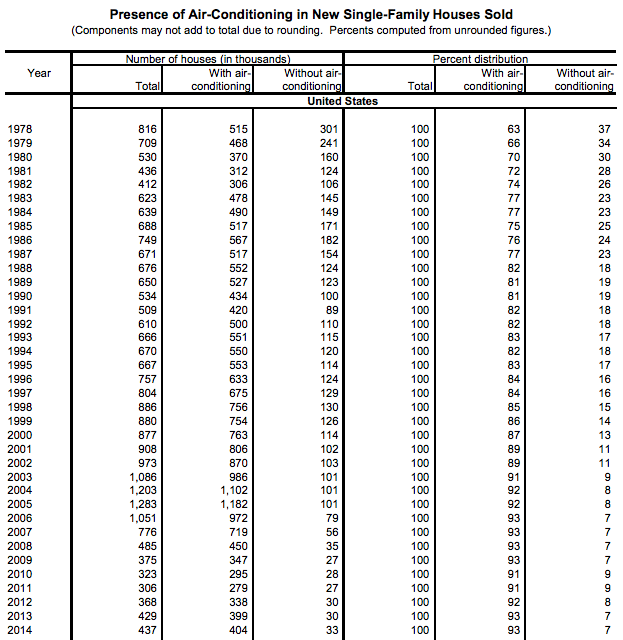
src:
US Census Bureau. Accessed May 16, 2016.
“Presence of Air-Conditioning in New Single-Family Houses Sold.” P.1.
*
Number of Fireplaces in New Single-Family Houses Sold, 1978-2014
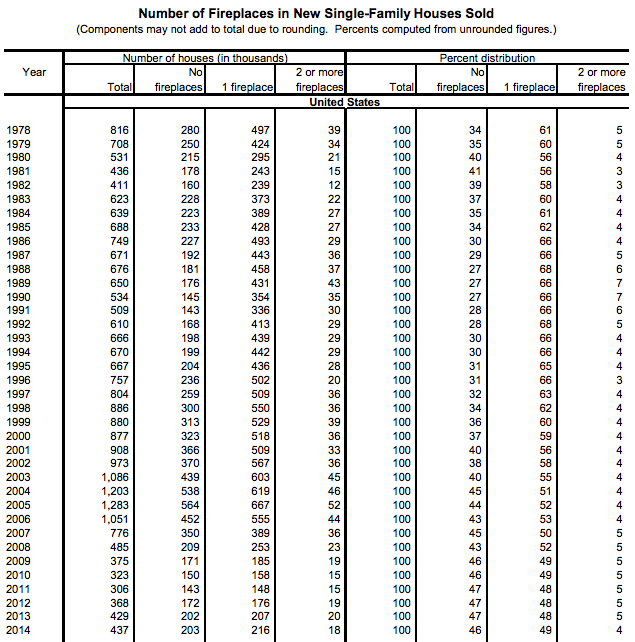
src:
US Census Bureau. Accessed May 16, 2016.
“Number of Fireplaces in New Single-Family Houses Sold.” P.1.
*
Type of Heating System Used in New Single-Family Houses Sold, 1978-2014
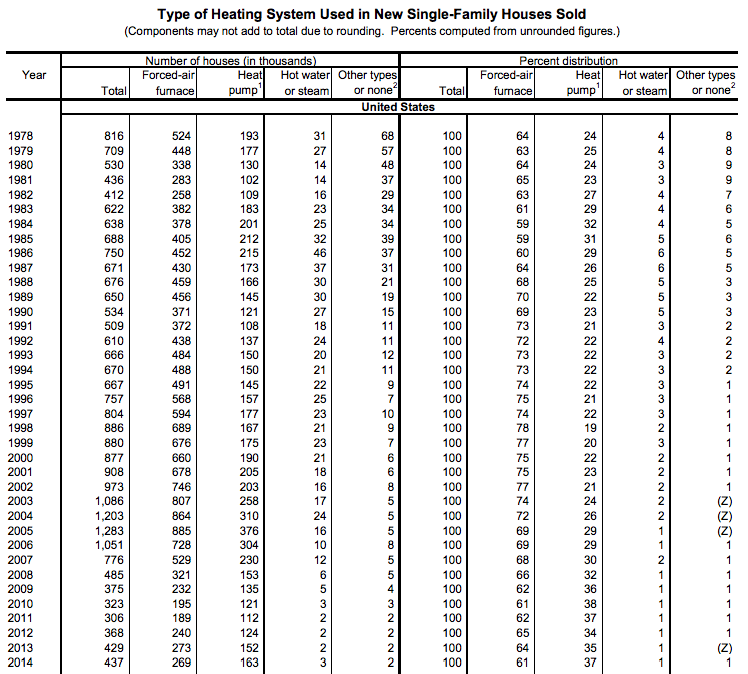
Note 1: Includes both air source and geothermal (ground source) versions.
Note 2: Includes electric baseboard, panel, radiant heat, space heater, floor or wall furnace, solar, and other types.
src:
US Census Bureau. Accessed May 16, 2016.
“Type of Heating System Used in New Single-Family Houses Sold.” P.1.
*
Type of Heating Fuel Used in New Single-Family Houses Sold, 1985-2014
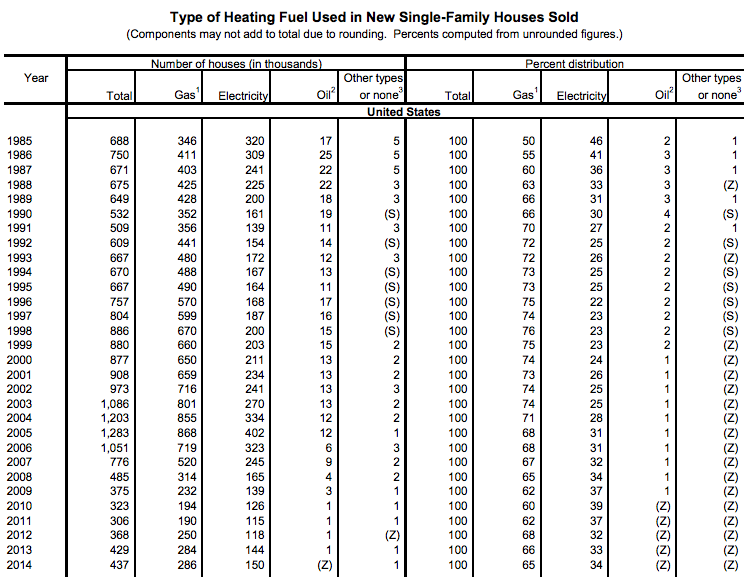
Note 1: Includes natural gas and bottled or liquified petroleum gas (including propane).
Note 2: Includes heating oil and kerosene.
Note 3: Includes wood, coal, solar, and other types. Beginning in 2014, also includes heating oil and kerosene.
src:
US Census Bureau. Accessed May 16, 2016.
“Type of Heating Fuel Used in New Single-Family Houses Sold.” P.1.
*
Type of Foundation in New Single-Family Houses Sold, 1978-2014
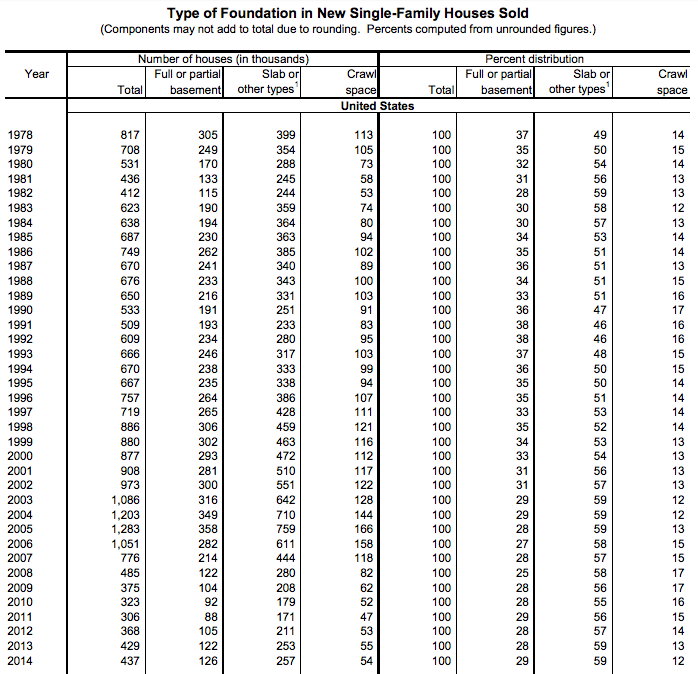
Note 1: Includes raised supports such as pilings and piers, and other types.
src:
US Census Bureau. Accessed May 16, 2016.
“Type of Foundation in New Single-Family Houses Sold.” P.1.
*
Type of Parking Facility of New Single-Family Houses Sold, 1986-2014
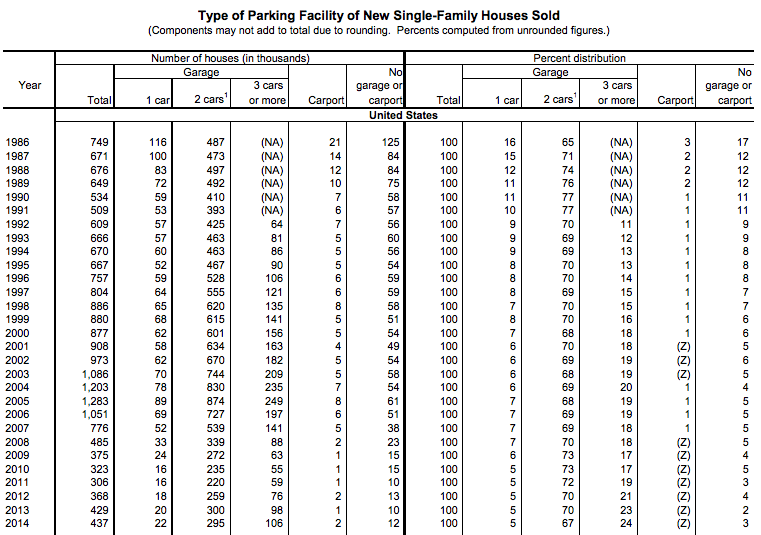
Note 1: Prior to 1992, data included 2 cars or more.
src:
US Census Bureau. Accessed May 16, 2016.
“Type of Parking Facility of New Single-Family Houses Sold.” P.1.
*
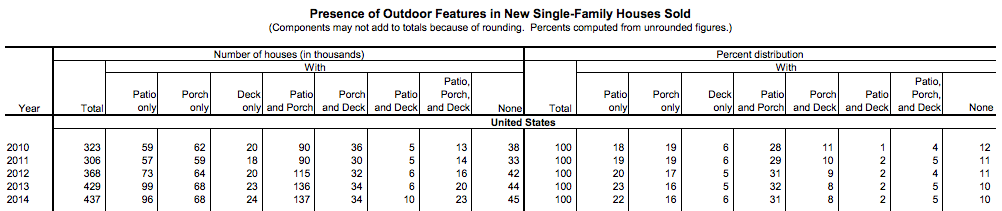
Presence of Outdoor Features in New Single-Family Houses Sold, 2010-2014.
src:
US Census Bureau. Accessed May 16, 2016.
“Presence of Outdoor Features in New Single-Family Houses Sold.” P.1.
*
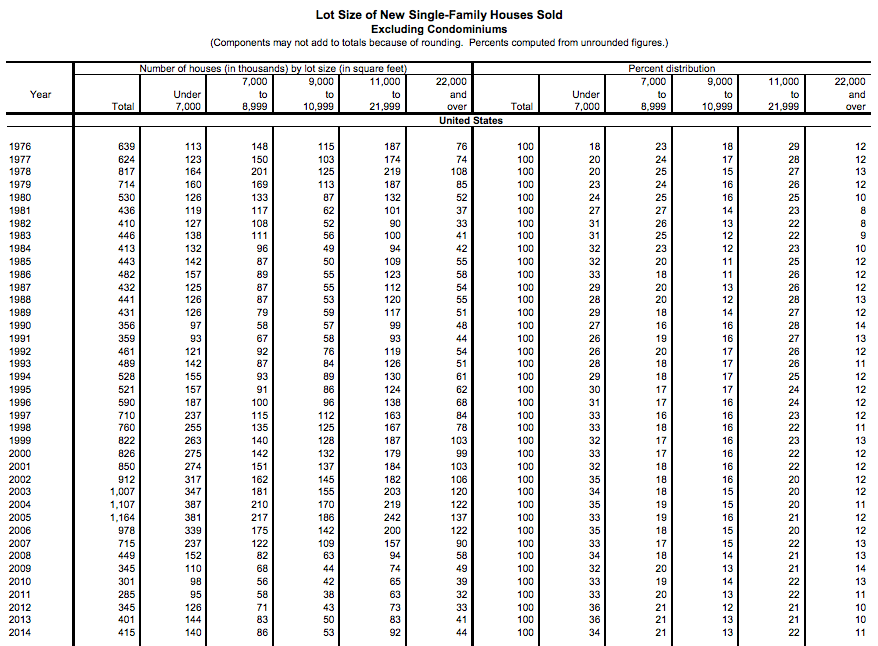
Lot Size of New Single-Family Houses Sold, 1976-2014
src:
US Census Bureau. Accessed May 16, 2016.
“Lot Size of New Single-Family Houses Sold.” P.1.
*
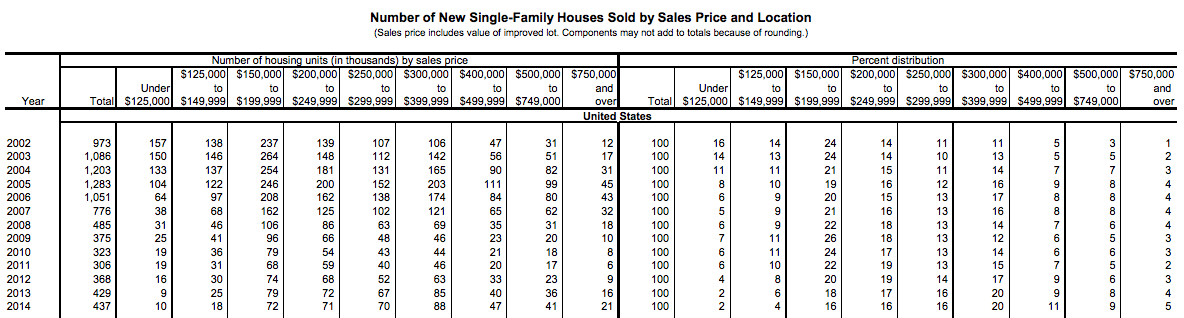
Number of New Single-Family Houses Sold by Sales Price, 2002-2014
src:
US Census Bureau. Accessed May 16, 2016.
“Number of New Single-Family Houses Sold by Sales Price and Location.” P.1.
*
Number of Multifamily Units Completed by Number of Units Per Building, 1972-2014
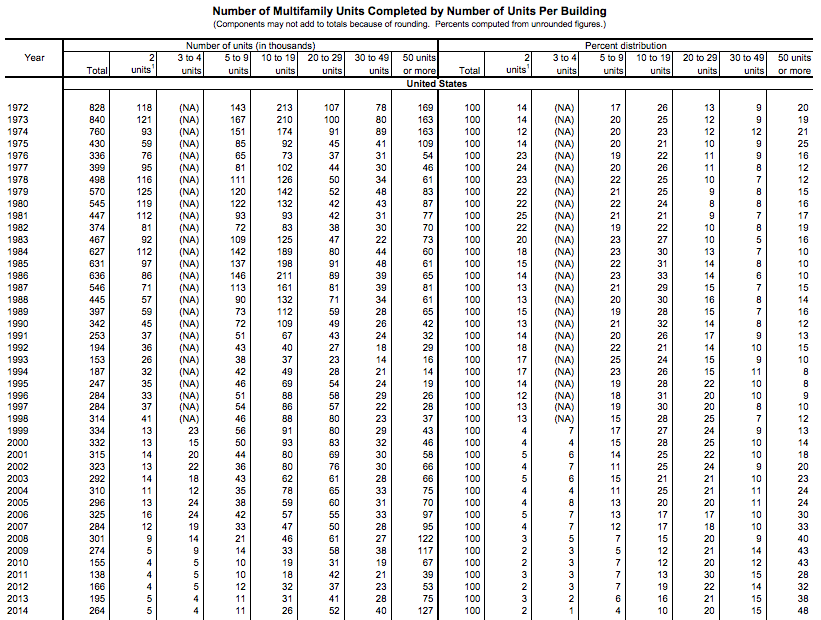
Also available in the PDF linked below: Multifamily units completed for Rent vs Sale, 1999-2014
src:
US Census Bureau. Accessed May 18, 2016.
“Number of Multifamily Units Completed by Number of Units Per Building”
*
Number of Multifamily Units Completed by Square Feet per Unit, 1999-2014
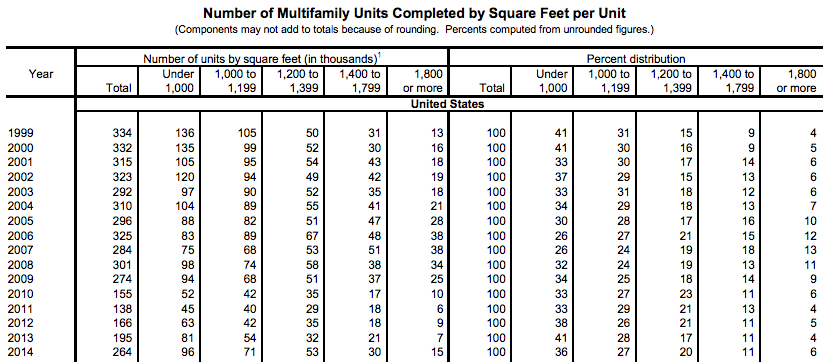
src:
US Census Bureau. Accessed May 18, 2016.
“Number of Multifamily Units Completed by Square Feet per Unit”
*
More characteristics of units in multifamily units and buildings available from the US Census Bureau, here: Multifamily Units, Multifamily Buildings
*
American Housing Survey
Survey run since 1973, but haven’t found a source for aggregated historic data
All annual reports available here.
Indicators present in the 1973 report
Number of all housing units (numbers back to 1970)
Number of unites in structure (back to 1973)
Median number of rooms per unit (total, owner, renter)
Percent with two bedrooms (total, owner, renter)
Percent with 3 bedrooms or more (total, owner, renter)
Percent with 1.01 or more persons per room (total, owner, renter)
2-or-more-person households (total, owner, renter)
male head-wife present, no nonrelatives (total, owner, renter)
other male head (total, owner, renter)
female head (total, owner, renter)
1-person households (total, owner, renter)
owner-occupied unites (total, in central cities, no in central cities, non-metropolitan)
renter-occupied units (same as above)
Median value (1973 vs 1970)
Median gross rent (1973 vs 1970)
Median income (owner-occupied, renter-occupied, 1973 vs 1970)
src:
US Census Bureau. July 1975.
“Annual Housing Survey: 1973 — Part A, General Characteristics”
Households
Total Number of US Households 1960-2015 (in millions)
src: Statista. Accessed May 18, 2016.
Note: This /has to be/ Census data.
TO-DO: locate Census source and import data to a Google Sheet.
*
Households makeup forecast to 2035
Uses 2013 Census Bureau data to make 5-year projections from 2015 to 2035. Low, middle, and high projections given.
Includes households by age and race forecasts. Projects total households, married w/o children, married with children, partnered w/o children, partnered with children, single-parent w/o other adults, single-parent with other non-partner adults, single person households, and other households.
src:
Daniel McCue. March 2014.
“Baseline Household Projections for the Next Decade and Beyond.”
Joint Center for Housing Studies, Harvard University.
Click “Household Projection Tables” at the bottom of the page for the original Excel file. Also imported into this Google Sheet.
Home Sales and Spending
New Single-Family Home Sales
1978-2012 – chart with line only, no numeric figures for individual years
[NAHB-NewSFHSales-1978-2011.jpg]
src:
“New Home Sales”
NAHB, Accessed May 16, 2016
Annual Numeric values for 2011-2015 available here
src:
“New and Existing Home Sales, U.S.”
NAHB, April 25, 2016
US Census Bureau – New Residential Sales, Historical Data
linking out to…
Houses Sold by Region – Annual Data, 1963-2015
Includes US total for each year
src:
US Census Bureau
Houses for Sale by Region, 1963-2015
Median and Average Sales Prices of New Homes Sold in United States, 1963-2015
Houses Sold by Type of Financing, 1988-2015
Private Residential Construction Spending Index, 2000-2016
line chart with lines for
single-family
multifamily
improvements
Index, with 1/1/2000 as the base
Chart shows multifamily housing with the strongest growth in the last two years, improvements as the most stable over the whole period.
src:
Na Zhao. May 2, 2016. “Multifamily Spending Continues Record Breaking Pace.” NAHB Eye on Housing.
