

religion
Charts: Monotheism, Retail, Urbanity, Home Size
Ask
Make extrapolated charts for the following:
Monotheism vs. Other & non-affiliated
Ecommerce vs. Physical retail sales
Global urban population
Average house size
Results
Extrapolate: Monotheism vs. other & non-affiliated
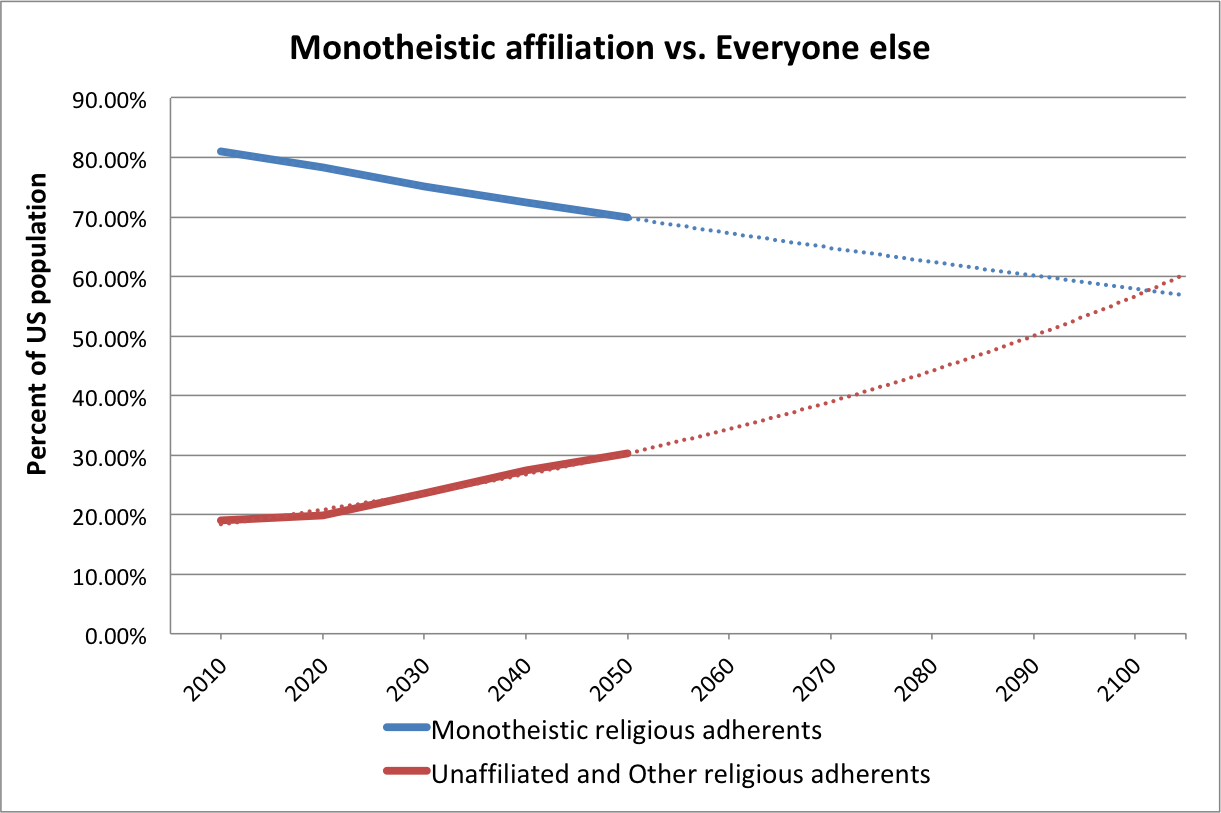
KEVIN: I’M HAVING TROUBLE UNDERSTANDING WHY THESE LINES DON’T CROSS AT 50%. THESE CURVES DON’T SEEM TO BE DIRECTLY CORRELATED.
In this chart, Christians, Muslims, and Jewish adherents are grouped in the Monotheistic adherents category. The red line includes the religiously unaffiliated, Buddhists, Hindus, followers of folk religions, and other religious adherents. Additional methodology on how Pew defined religious groups is available here.
Data for extrapolation (percentage of US population)
2010
Monotheistic religions
Christians 78.3
Jews 1.8
Muslims 0.9
Other
Unaffiliated 16.4
Buddhists 1.2
Folk Relions 0.2
Hindus 0.6
Other Religions 0.6
2020
Monotheistic religions
Christians 75.5
Jews 1.7
Muslims 1.1
Other
Unaffiliated 18.6
Buddhists 1.2
Folk Relions less than 1
Hindus less than 1
Other Religions less than 1
2030
Monotheistic religions
Christians 72.2
Jews 1.6
Muslims 1.4
Other
Unaffiliated 21.2
Buddhists 1.3
Folk Relions less than 1
Hindus less than 1
Other Religions 1.1
2040
Monotheistic religions
Christians 69.1
Jews 1.5
Muslims 1.8
Other
Unaffiliated 23.6
Buddhists 1.4
Folk Relions less than 1
Hindus 1.1
Other Religions 1.3
2050
Monotheistic religions
Christians 66.4%
Jews 1.4
Muslims 2.1
Other
Unaffiliated 25.6
Buddhists 1.4
Folk Relions 0.5
Hindus 1.2
Other Religions 1.5
Sources
Pew Research Center. April 2, 2015.
“The Future of World Religions: Population Growth Projections, 2010-2050.”
US Decadal data
NOTE: Figures for the “less than 1%” values are available for 2010 and 2050 (but not the intervening decades) in the full report
Table: Religious Composition by Country, 2010 and 2050, p.244
*
Extrapolate: Ecommerce Retail
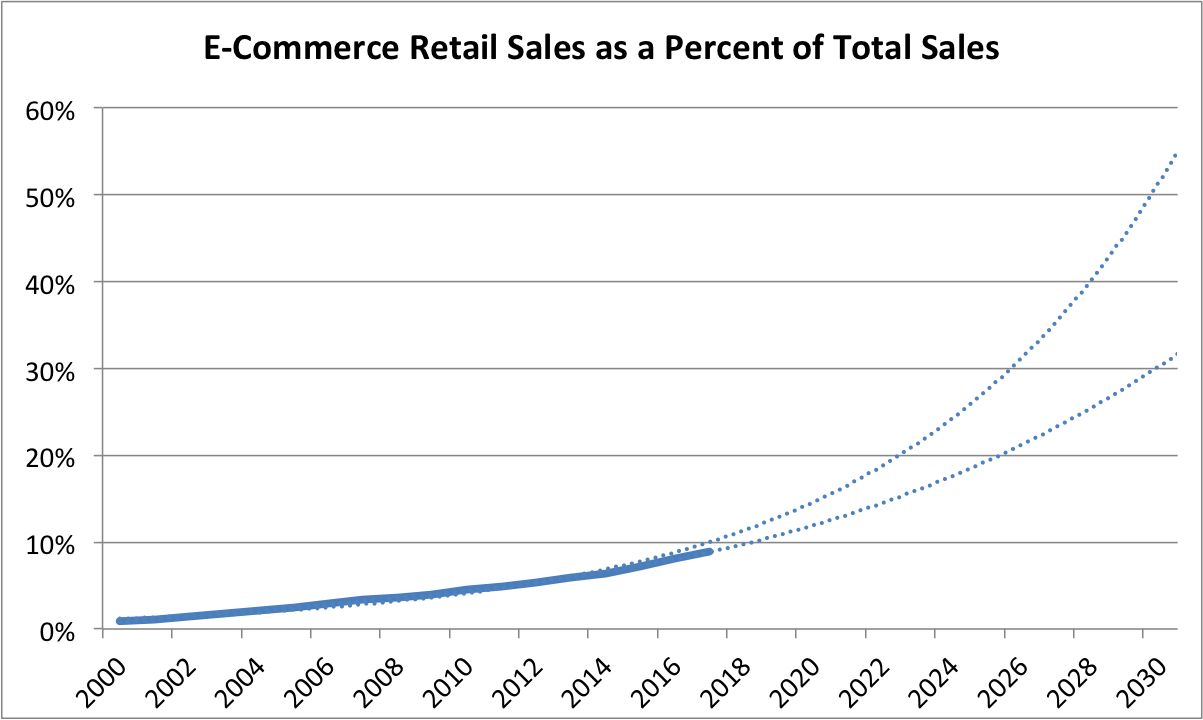
KEVIN – THE STEEPER CURVE IS AN EXPONENTIAL TREND LINE, BUT I FEEL THE POLYNOMIAL TREND LINE LOOKS LIKE A BETTER FIT. AGREE?
Source
U.S. Bureau of the Census, E-Commerce Retail Sales as a Percent of Total Sales [ECOMPCTSA], retrieved from FRED, Federal Reserve Bank of St. Louis; February 28, 2018.
ECOMPCTSA
Frequency: Annual
FRED Graph Observations
Federal Reserve Economic Data
*
Extrapolate: Urbanization

Source
United Nations, Department of Economic and Social Affairs, Population Division (2014). World Urbanization Prospects: The 2014 Revision, custom data acquired via website.
From the FAQ
How do we define “urban”?
We do not use our own definition of “urban” population but follow the definition that is used in each country. The definitions are generally those used by national statistical offices in carrying out the latest available census. When the definition used in the latest census was not the same as in previous censuses, the data were adjusted whenever possible so as to maintain consistency. In cases where adjustments were made, that information is included in the sources listed online. United Nations estimates and projections are based, to the extent possible, on actual enumerations. In some cases, however, it was necessary to incorporate other estimates of urban population size. When that is done, the sources of data indicate it.
*
Extrapolate: Home Size
Kevin, the following paper on US housing stock and floor space is very good. I’ll excerpt generously from it, but you may like to review the original article, “120 Years of U.S. Residential Housing Stock and Floor Space.”
I DON’T HAVE ACCESS TO THE DATA TO BE ABLE TO EXTRAPOLATE, BUT PERHAPS WE COULD REQUEST IT FROM THE AUTHORS.
Excerpts:
Excerpted Discussion:
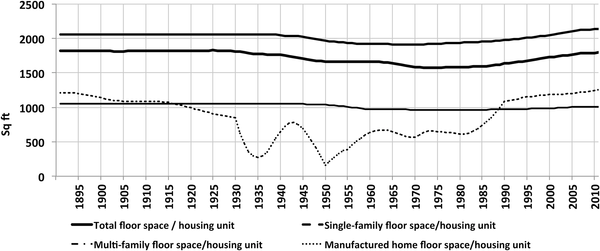
Fig 7 shows the estimated aggregated floor space average over the 120-year period, for each building type, calculated as the ratio of the two estimated time–series, total U.S. floor space and housing stock. Average floor space per unit remained approximately constant throughout the period. A slight ‘dip’ occurred in the 1940–2000 period, but the average returned to pre-1940’s values in the 2000’s, and so floor space per unit averages played a relatively minor role in overall floor space evolution over the very long term.
Excerpted Discussion:
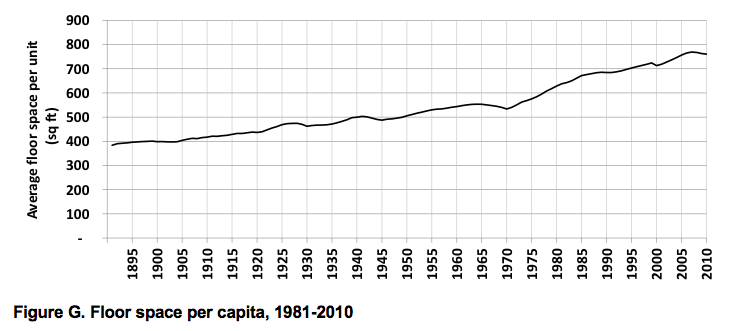
The number of U.S. homes and their associated total floor space have risen dramatically over the last century. From the end of the 19th to the mid-20th century, a net average of half a million homes was added annually to the country’s stock, corresponding to over 850 million square feet added annually. In the last half century, the net average of homes added annually doubled to one million, which led to a tripling of floor space growth, with 2,700 million square feet added annually, with new construction far exceeding retirements. Over the 1891–2010 period, floor space increased almost tenfold, which corresponds to a doubling of floor space per capita (from approximately 400 to 800 square feet (Fig G in S6 File).
Excerpted Conclusion:
Our results show that over the last 120 years floor space and housing stock in the U.S. increased approximately tenfold, while population increased approximately fivefold and household size decreased by a dramatic 50%. Average floor space has remained approximately constant. But can these long-term trends be expected to continue into the future? The interplay between the evolution of population, household size, average floor space growth, as well as other factors, such as the construction rate of single-family homes and the retirement of older smaller vintages, could become significant in future dynamics.
In order to look ahead, it is important to distinguish between short-and long-term trends. The 2008 housing crisis is a recent event from which the housing market is still recovering, so trends in the last decade may not be representative of future developments. Taking the last 30 years into account, however, allows for a better insight into the near future. It is particularly instructive to examine the two factors that have evolved differently over the last three decades, compared to their previous evolution, namely household size and average floor space.
Decreasing household size is a trend with roots in a combination of factors: increased national income, increased mobility, demographic factors such as the aging of the population and the proportion of young adults who are potential homebuyers, and cultural factors such as changing family structures (ex. the increase of the median age at first marriage, family size and the overall decline in the number of married adults, [24]. These factors could contribute to a further long-term decrease of household size, but compared to the decrease in household size since the late 19thC, household size in the U.S. has been decreasing at a slower pace since the 1980’s. In 2007–2010 there was a slight increase from 2.31 to 2.34 persons per household (Fig 6, top), which could either be immediate consequence of the housing crisis, or could indicate a more fundamental change in the long-term trends. A slow economic recovery, with still relatively high unemployment, a rising student debt and the difficulty of obtaining mortgage credits, are all factors that may contribute to a slower decrease or an increase in household size, as young adults are less able to move out of their parents’ homes [25].
In the last 30 years floor space averages have been increasing, as older post-1940 vintages consisting of smaller units, such as those built in the post-war “baby boom” years progressively retire, while larger units are added to the stock. New single family homes built in the first decade of the 21st century averaged 2,673 square feet, while those built in the 1980’s averaged 2,162 square feet (see Table 1). The overall average floor space for units of all building types increased by 13% in the last 30 years, reaching almost 1,800 square feet per unit in 2010 (see Fig 9).
These two factors–household size and floor space averages—have the potential to drive floor space in opposite directions. The observed increase in average floor space is a clear trend, which might only be attenuated if the rate of construction of single-family homes or retirement of older units also slows down. On the other hand, if the tendency for household size to decrease more slowly or increase is indeed a new trend, then both the number of housing units and floor space might accompany population growth more closely than has been the case in the past.
Src:
Maria Cecilia P. Moura, Steven J. Smith, David B. Belzer. August 2015.
“120 Years of U.S. Residential Housing Stock and Floor Space.” PLOS ONE
Note: Figure G (floorspace per capita) is from the supporting document:
S6 File. Results: Floor space time-series.
Religion
Summary
This collection of data includes the following indicators, dates, and sources:
religious affiliation, 2010-2050, 1948-2015, 1972-2014, Pew, Gallup, GSS
no religious preference, 1972-2014, GSS
traditional/secular-rational index, 2010-2030, Pardee
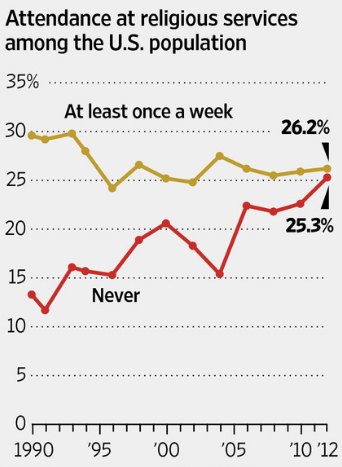
church attendance, 1992-2015, 1990-2012, Gallup, GSS
church buildings/congregations, 1990-2014, 1992-2012 select years, 1952v2010, 1980-2010 (decadal), Dodge, US EIA, ASARB
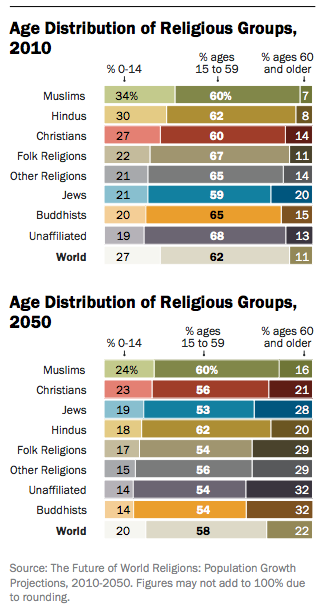
median age of practitioners, 2010-2050, Pew
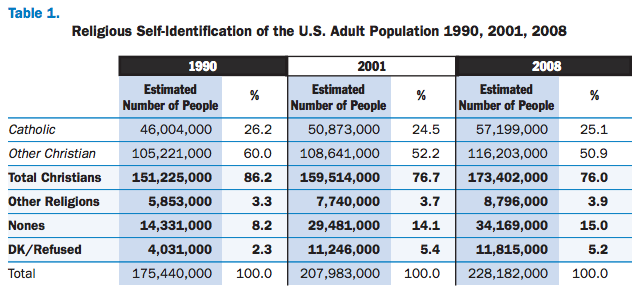
new religions, 1990, 2001, 2008, ARIS
belief in life after death, 1973-2014, GSS
spouses religious preference, 1973-2014, GSS
confidence in organized religion, 1973-2014, GSS
attidude about bible prayer in public schools, 1974-2014, GSS
frequency of prayer, 1983-2014, GSS
strength of religious affiliation, 1974-2014, GSS
degree of fundamentalism, 1972-2014, GSS
religion in which raised, 1973-2014, GSS
Findings
Affiliation
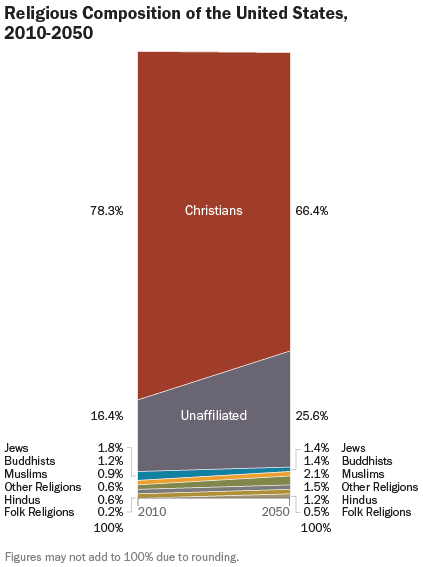
In the United States, the [religiously] unaffiliated are projected to grow from an estimated 16% of the total population (including children) in 2010 to 26% in 2050. (But note: atheists, agnostics and other people who do not affiliate with any religion will make up a declining share of the world’s total population.)
US Christians will decline from more than three-quarters of the population in 2010 to two-thirds in 2050, and Judaism will no longer be the largest non-Christian religion. Muslims will be more numerous in the U.S. than people who identify as Jewish on the basis of religion.
NOTE: Decadal data from 2010 to 2050 are available here.
src:
Pew Research Center. April 2, 2015.
“The Future of World Religions: Population Growth Projections, 2010-2050.”
Overview
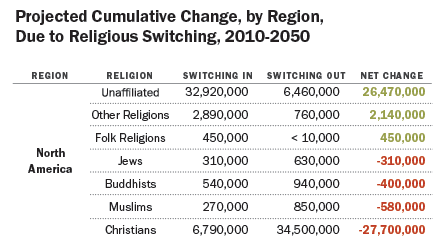
src:
Pew Research Center. April 2, 2015.
“Chapter 1: Main Factors Driving Population Growth — Religious Switching.”
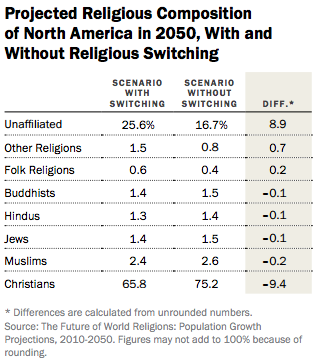
src:
Pew Research Center. April 2015.
“The Future of World Religions: Population Growth Projections, 2010-2050.”
p.161
*
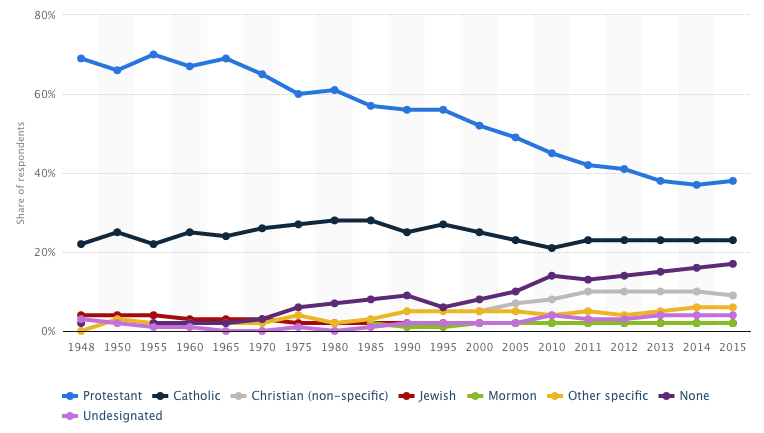
Since 1948, Gallup has polled Americans on their religious affiliation. The question wording has changed a bit over time, but the questions have always asked explicitly about Protestant, Roman Catholic, and Jewish affiliation. Starting in 2000, the poll added Mormon and Muslim affiliation. Values for responses of “Other” “None” and “No Answer” have also been recorded since 1948.
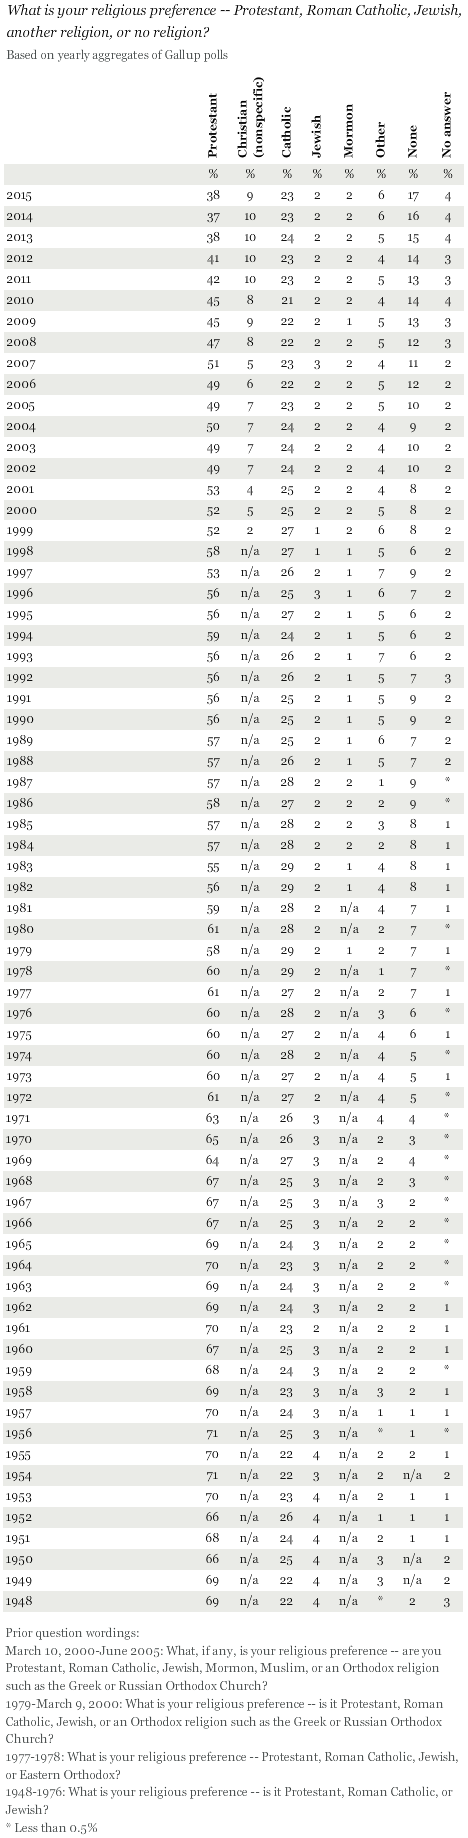
src:
Gallup. Accessed July 26, 2016.
“IN DEPTH: TOPICS A TO Z — Religion.”
chart via:
Statista. 2016.
“Self-described religious identification of Americans from 1948-2015.”
citing Gallup data (above)
*
What is your religious preference? Is it Protestant, Catholic, Jewish, some other religion, or no religion? 1972-2014
src:
Tom W. Smith, et al. 1972-2014.
“Rs religious preference.”
General Social Surveys. NORC at the University of Chicago.
contact: Eric Young, External Affairs Manager, young-eric@norc.org
TO DO: EXTRACT DATA FROM GSS. CLARIFY THE FIGURES ON THE GSS WEBSITE.
*
Figure 1. No Religious Preference (%) by Year, 1972-2014
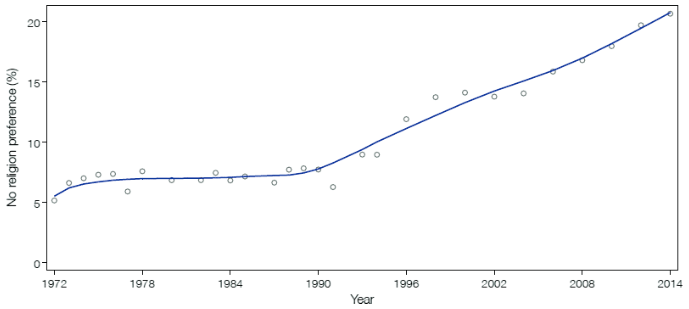
src:
Michael Hout, Tom W. Smith. March 2015.
“Fewer Americans Affiliate with Organized Religions, Belief and Practice Unchanged.”
General Social Surveys. NORC at the University of Chicago.
*
The Pardee Center (University of Denver) maintains a forecast database called “International Futures.” The “Social” subset includes an index for “Traditional/Secular-Rational” outlook for the US (scroll to the bottom of the list). Annual index values are available for 2010-2030.
src:
International Futures. Accessed July 26, 2016.
“Basic Report – USA, Working File.”
The Pardee Center. University of Denver.
Note: This indicator refers to the cultural dimensions of “traditional values” and “secular-traditional values” defined by the World Values Survey, here.
TO DO: EXTRACT DATA.
Attendance
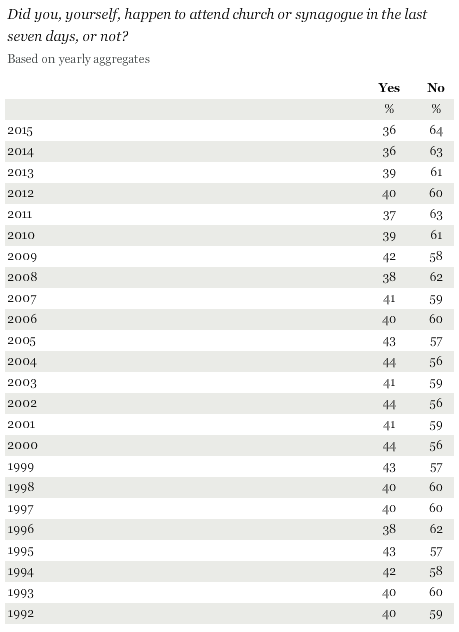
src:
Gallup. Accessed July 26, 2016.
“IN DEPTH: TOPICS A TO Z — Religion.”
*
src:
Ben Leubsdorf. December 2014.
“Decline in Church-Building Reflects Changed Tastes and Times.”
Wall Street Journal.
citing:
General Social Survey (GSS)
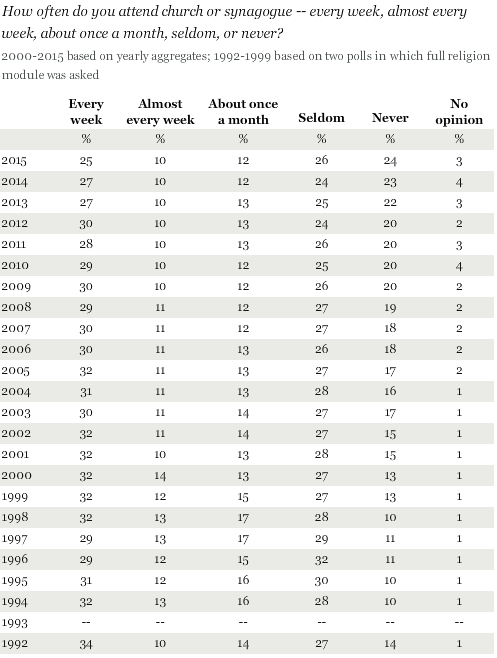
This chart refers to The General Social Survey question, “How often do you attend religious services?” The variable name is “attend.” GSS data for this question/variable available 1972-2014, but the data on their website is given in absolute numbers.
src:
Tom W. Smith, et al. 1972-2014.
“How often r attends religious services.”
General Social Surveys. NORC at the University of Chicago.
contact: Eric Young, External Affairs Manager, young-eric@norc.org
TO DO: EXTRACT DATA FROM GSS. CLARIFY THE FIGURES ON THE GSS WEBSITE. ASK ABOUT CONVERTING TO PERCENTAGE OF US POPULATION, AS THE FIGURES WERE QUOTED BY THE WSJ.
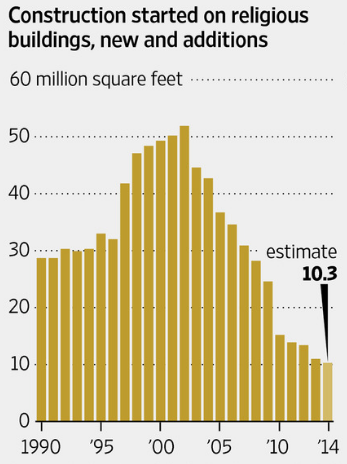
Church Buildings
Construction of religious buildings in the U.S. has fallen to the lowest level at any time since private records began in 1967. Religious groups will build an estimated 10.3 million square feet this year, down 6% from 2013 and 80% since construction peaked in 2002, according to Dodge Data & Analytics. In terms of dollars, spending on houses of worship totaled $3.15 billion last year, down by half from a decade earlier, according to Commerce Department figures.
There are signs the long decline in church-building may have hit bottom. While construction is down this year, the pace of spending has inched up since the end of 2013, the Commerce Department said. Two private firms, FMI and Dodge Data & Analytics, both expect spending to rise modestly in 2015.
But a return to the building boom of a dozen years ago—in 2002, religious groups built 51.9 million square feet, Dodge says—faces headwinds. Dodge said in its latest report that “the level of activity will remain extremely low by historical standards.”
Behind the decline is a confluence of trends: a drop in formal religious participation, changing donation habits, a shift away from the construction of massive megachurches and, more broadly, a growing taste for alternatives to the traditional house of worship.
src:
Ben Leubsdorf. December 2014.
“Decline in Church-Building Reflects Changed Tastes and Times.”
Wall Street Journal.
citing:
Dodge Data & Analytics
*
A decline in church membership and religious service attendance has weighed heavily on religious building construction over the past 13 years. Things didn’t get much better in 2015. Starts slid 5 percent (9.3 msf), though dollars grew 5 percent ($1.8 billion). A 5.6 percent rise in donations ($482 billion) has helped this sector. In 2016, expect a 3 percent gain (9.6 msf) and 5 percent added dollar value ($1.9 billion).
src:
Jeff Gavin. January 2016.
“2016 Construction Outlook.”
Electrical Contractor.
*
Religious Buildings, 1992, 1995, 1999, 2003, 2012.
srcs:
US US Energy Information Administration.
“Commercial Buildings Energy Consumption Surveys.”
Various years, stated below.
“2012 CBECS Survey Data.”
Table B2. Summary table: total and medians of floorspace, number of workers, and hours of operation, 2012.
“2003 CBECS Survey Data.”
Table B2. Summary Table: Totals and Medians of Floorspace, Number of Workers, and Hours of Operation for Non-Mall Buildings, 2003.
https://www.eia.gov/consumption/commercial/data/2003/pdf/b2.pdf
“1999 CBECS Survey Data.”
Table B2. Summary Table: Totals and Medians of Floorspace, Number of Workers, Hours of Operation, and Age of Building
“1995 CBECS Survey Data.”
Table 2. Summary Table: Totals and Medians of Floorspace, Number of Workers, Hours of Operation, and Age of Building, 1995
“1992 CBECS Survey Data.”
Table A1. Summary Table of Square Feet, Hours of Operation and Age of Building, 1992
NOTE: Prior to 1992, religious buildings were grouped (unitemized) into a larger category called “Assembly,” which also included entertainment buildings (eg: museums, concert halls), recreational facilities (eg: gyms, indoor pools), and social/public/civic assembly buildings (eg: auditoriums, convention halls).
*
The Association of Statisticians of American Religious Bodies (ASARB) collects data on religious congregations going back to 1952.
An excerpt from their 2010 Census:
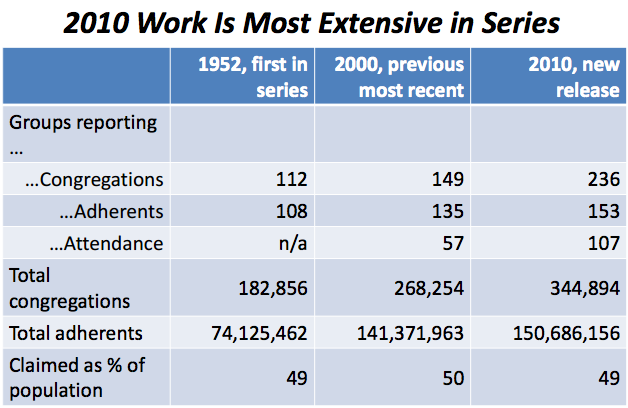
Congregations: Congregations may be churches, mosques, temples, or other meeting places. A congregation may generally be defined as a group of people who meet regularly (typically weekly or monthly) at a pre-announced time and location.
src:
Association of Statisticians of American Religious Bodies (ASARB). May 2012.
“U.S. Religion Census 2010: Summary Findings.”
Congregations defintion
Congregations from previous ASARB censuses are made available via the Association of Religion Data Archives (ARDA).
Year — Congregations
2010 — 344,894
2000 — 268,254
1990 — 255,173
1980 — 231,708
Totals by individual religious group are available at the ARDA website.
NOTE: Estimates of Muslim, Hindu, and Buddhist congregations only included in 2000 and 2010 census totals.
src:
Association of Religion Data Archives (ARDA). Accessed July 27, 2016.
“U.S. Membership Report.”
Age of Adherents
The following figure contains GLOBAL data:
The following figure contains North American data.
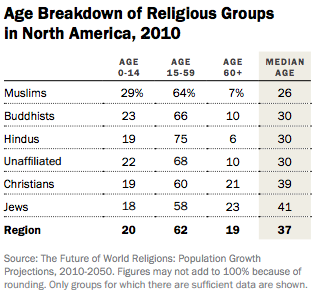
src:
Pew Research Center. April 2015.
“The Future of World Religions: Population Growth Projections, 2010-2050.”
Pp.40, 160.
contact:
Conrad Hackett, Demographer, chackett@pewresearch.org
Katherine Ritchey, Communications Manager
src:
Pew-Templeton Global Religious Futures Project. 2015.
“Median Age.”
New Religions
The Pew “Future of World Religions” report referenced above classifies new/emerging religions under their “Other Religions” category. The end of the report (p.124) includes an overview of the religions included in this category, “Spotlight on Other Religions.” Among the handful of faiths that are called out in this section, Wiccans are the only new group called out in the US specifically, and the report explains that reliable estimates of their numbers are not available. Other new groups called out in the report, but not described with any geographic predominance, are Cao Dai, I-Kuan Tao, Mandaeism, the Rastafari movement, the Rātana movement, Scientology and Yazidism.
referring to:
Pew Research Center. April 2015.
“The Future of World Religions: Population Growth Projections, 2010-2050.”
P. 124-125.
*
The US Census does not ask questions about religious affiliation, but some of its reports have included data collected by the American Religious Identification Survey (ARIS). ARIS has been conducted in 1990, 2001, and 2008.
The ARIS 2008 report includes a “New Religious Movements and Other Religions” category, which includes Scientology, New Age, Eckankar, Spiritualist, Unitarian-Universalist, Deist, Wiccan, Pagan, Druid, Indian Religion, Santeria, Rastafarian.
Excerpts from the 2008 report:
“The category of the New Religious Movements and Other Religions is a mixed one and includes many groups often referred to as cults. The 2008 survey revealed marked increase in preferences for personalized and idiosyncratic responses as well as increases in the Neo-Pagan groups.” p.7
“The 2008 findings confirm the conclusions we came to in our earlier studies that Americans are slowly becoming less Christian and that in recent decades the challenge to Christianity in American society does not come from other world religions or new religious movements (NRMs) but rather from a rejection of all organized religions.” p.3
“Divorce appears to be widespread and no religious tradition is immune, nor are Nones the most likely to be currently divorced. Catholics’ divorce rate is close to the national average. Divorce rates are lowest among Mormons and Jews, traditions known for the emphasis they place on married life and the family. Divorced and separated persons, on the other hand, are most common in the New Religion Movements, other minority religions, and the Pentecostal/ Charismatic tradition.” p.13
p.3
src:
Barry A. Kosmin, Ariela Keysar. March 2009.
“American Religious Identification Survey (ARIS 2008).”
Trinity College.
*
Although their list does not indicate rates of growth, ProCon.org published a list of US religions and denominations which includes the date founded, total members, and members as a percentage of the total adult “religious” population (based on 2001 data). ProCon.org aggregated its list largely from ARIS, referenced above, but also supplemented from a few other reputable sources. The list is sorted by membership size as of 2001.
The list includes a total of 313 religions and denominations. The overall group is broken down into 28 of the largest groups, with expanded sections on 35 Christian denominations, 124 “Other” religions, and 127 “New Age” religions.
Here are excerpts from the list, focusing on new or undated groups:
Name — Founding Date — Members (percent)
Other unclassified — N/A — 386,000 (.231%)
Neo-Paganism — Unknown — 140,000 (.084%)
New Age — 1960s — 68,000 (.041%)
Scientology — 1953 — 55,000 (.033%)
Humanism — Unknown — 49,000 (.029%)
Eckankar — 1965 — 26,000 (.016%)
Cao Daism — 1926 — 25,000 (.015%)
Rastafarianism — 1930s — 11,000 (.007%)
src:
ProCon.org. Accessed August 1, 2016.
“All Religions and Denominations in the US.”
Source note: ProCon.org is a widely cited non-profit publishing non-partisan research on controversial issues. [Wikipedia — ProCon.org — Reception]
Other Indicators
TO DO: DATA NEEDS TO BE EXTRACTED FROM THE FOLLOWING
Belief in Life After Death, 1973-2014, GSS
Spouses religious preference, 1973-2014, GSS
Confidence in organized religion, 1973-2014, GSS
Bible prayer in public schools, 1974-2014, GSS
How often does r pray, 1983-2014, GSS
Strength of affiliation, 1974-2014, GSS
