

sports and games
Ericsson: 5G impacts on sports events
Alongside November 2017’s Mobility Report, Ericsson offered some speculations on the effect 5G mobile service might have on sporting event spectators.
Excerpts:
Key findings
Growth in mobile traffic at events can be attributed to changes in user behavior, especially among younger people
Spectators now mainly share or stream live videos and engage with social networks at events, as well as increasingly creating and uploading their own content
Augmented reality (AR) and virtual reality (VR) technologies can enhance visitors’ and remote spectators’ experience of events, making them available in new ways
4G systems will continue to support event visitors with services, but in the near future, 5G technology will have the capability to transform their experience
At future events and connected venues, with high traffic density and increasing use of demanding services such as AR and VR, proactive management and automation will be essential to meet committed service levels
A range of services may be included in 5G showcases, allowing venue visitors to turn from spectators into participants and enabling them to:
Watch events from different viewpoints with interactive control
Access multiple cameras filming an object to achieve a 3D view
Experience sports activity from the perspective of the athlete via mini-cameras
Enjoy an in-stadium experience outside the venue through haptic or tactile feedback
View live holographic projections of athletes
Integrate supplementary content into their live streams
See athlete, event or venue statistics superimposed on their device display
Analyze and display performance data through sensors embedded in sports equipment
Receive real-time information on factors such as the speed and location of a ball
View overlay and substitution content, for example, explaining rules, giving more details and personalizing the experience
src:
Ericsson, Nov 2017
“From spectators to participants”
Luker on e/sports
Ask
Expert Perspective:
Recent talks/interviews with Rich Luker (ESPN Sports Poll, Luker on Trends)
Results
State of Sports for Gen Z Kids: Building Lifelong Affection in a Hyper-Competitive Market
Generation Z kids are bombarded by a tsunami of highly accessible and enticing alternatives to sports each day. What effect will this have on the long-term outlook for the professional sports industry? How can the sports industry adapt to this reality in a manner that builds a relationship TODAY so that kids will be engaged with sports tomorrow?
Rich Luker, the Founder of the ESPN Sports Poll, and Terence Burke, SVP of Research and Editor-in-Chief of KidSay’s Trend Tracker report, will describe a new alliance of the two groups and present the first, ever, “State of Sports for Generation Z” convergenceing kids from 5-17.
From Pokemon Go to Esports: Lessons and Opportunities
At the 2017 Project Play Summit, experts weigh in on how to assure more free play for kids through technology. What lessons can be learned from the popularity of Pokemon Go and esports? Moderating the session is Jeremy Goldberg, President, LeagueApps. Panelists are Angela Ruggiero, Co-Founder/Managing Director, Sports Innovation Lab; Chris Kluwe, Former NFL Punter; Vikram Grover, Senior Director of Business Development, Niantic; and Rich Luker, Founder, Luker on Trends.
Esports industry evolution
Ask
Qualitative Discussion:
Evolution of esports
Results
Gamelab Barcelona 2017 – Mike Sepso – Shaping eSports right
YouTube
Mike Sepso is Senior Vice President of Activision Blizzard where he runs Media Networks, a division devoted to creating the best esports experiences for fans across games, platforms and geographies. Prior to joining Activision Blizzard, Mike was the co-founder and president of Major League Gaming (MLG), a global leader in esports, focusing on strategy, key partnerships, corporate development and overseeing all product and technology development, including the launch of MLG.TV. In his conversation with Dot Esports journalist Thiemo Bräutigan, Mike goes through Activision Blizzard’s Esports strategy for the comming years, and comments on the latest news around the Overwatch Global League.
“Esports: Big Buzz or Big Business?”
Hashtag Sports, June 2017
YouTube
Leading executives from the world of sports business, consumer brands, media and technology engage in a lively debate on whether the industry will deliver on its $1bn promise or, as some predict, will prove to be a false dawn for the sector and its investors. A panel of experts will discuss how the emergence of eSports as a global mainstream phenomenon is driving their own strategies, be it as a marketing vehicle or an investment prospect, while also dissecting the argument of those who doubt the long-term commercial value of the eSports ecosystem.
“Booming business of esports sets sights on conquering mainstream audiences”
VentureBeat, February 12, 2018
“League of Lawyers: Esports is creating a new class of white-collar jobs”
VentureBeat, February 6, 2018
“The Esports Playbook”
Nielsen launched an Esports division in August 2017. Their inaugural audience report includes a final chapter called “What’s Next” which talks about the future of esports on linear TV, as well as the future for VR/AR esports.
“The who, what and why of the World Esports Association”
Polygon, May 2016
Discussion of the formation of the World Esports Association, a league representing competitions organized by ESL (a tournament organizer), and focused only on one game (Counter-Strike: Global Offensive) at the time of launch. One of the goals of the organization is to further professionalized esports by introducing player representation, standardized regulations, and revenue sharing for teams.
Number of pro gamers vs. pro athletes
Ask
How Many:
Professional esports players (pro gamers)
Contrast with BLS data for professional athletes
Results
*
The esports players figures above do not reflect the newly developing esports leagues, of which there are at least 3:
Overwatch League (OWL) – 12 teams with 6-12 players per team
NBA 2K League – 17 teams with 6 players per team
eMLS – 19 teams (details are thin, more forthcoming)
OWL, which is being launched by game publisher Blizzard, will pay a minimum salary of $50,000 per year, with players signing up for one-year contracts at a time. On top of the base wage, players will get a share of any bonuses the team accures. Half of all tournament prize money secured by a team will be shared between the players. Teams can have between six and 12 players…There are currently seven teams in the Overwatch League, drawn from cities across the US, along with a pair of teams from South Korea and China.
src:
TechRadar, July 2017
“Want to be a pro gamer? This is what you could earn playing Overwatch”
More info on the owners and affiliated cities is reported by Engadget.
The NBA is partnering with the developer of the NBA2K game franchise to create an esports league, which will be called “NBA 2K eLeague.” According to the NBA, each of its 30 teams will eventually have its own eSports squad, just as they’re represented in the WNBA or the lower-tier D-League. Every 2K eLeague team will be made up of five human players, which the NBA plans to treat the same way it does athletes who play for the San Antonio Spurs, New York Knicks or any of its other NBA, WNBA or D-League clubs. There will be contracts and endorsement deals at stake, for instance. The main difference here is that there’s room for more diversity, since these pro players can be of any age, gender or race to play on the same court — even if it is a virtual one.
src:
Engadget, Feb 2017
“In the NBA’s eSports league, diversity means a new kind of athlete”
The NBA 2K League Qualifier took place in January, 2017.
An 85-person draft was created.
17 teams will be created at first.
Competitive salaries and benefits, plus additional options for more earnings
src:
Forbes, Dec 2017
“NBA 2K League: How To Qualify, Salary Info, Draft Process, Twitter Account, Rules And More”
*
Even before the three leagues described above launched, there have been very popular esports teams with some team members earning their livlihoods through tournament earnings, streaming income, and other play-related earnings (eg: team salaries and room and board).
Neilsen ranks the 7 most popular esports teams in the US as: Cloud9
Optic Gaming
Team Liquid
Fnatic
SK Gaming
Counter Logic Gaming
Ninjas in Pyjamas
srcs:
Nielsen, 2017.
“The Esports Playbook”
As an example, Cloud9 fields teams for 11 games. As of the time of publication for this blog entry, their 11 teams include 12 American players, as well as 6 American staff members (eg: coaches).
League of Legends: 7 American players, 2 American staff
Counter-Strike:Global Offensive: 5 American players, 3 American staff
Hearthstone: 1 American staff
*
Here’s a bit of general commentary from Sports Illustrated:
The current state of professional gaming mirrors the beginning days of the NFL and NBA. In those league’s inchoate stages, players often had to work other jobs to supplement their seasonal salaries. Even today, some professional athletes—like pro lacrosse players—hold other jobs to bolster their income. The same is true for most professional gamers.
Still, 18 gamers made more than $500,000 in esports prize money alone last year, and 195 made more than $100,000. Similar to professional golfers and tennis players, prize money makes up only a portion of the top gamers’ yearly income. Some are paid salaries by their teams, and many parlay massive followings built from live-streaming their gaming sessions into sponsorships with game equipment and manufacturing companies.
The number of full-time professional gamers is, as of right now, modest. But if esports stays on its path toward mainstream appeal and the sponsorship and TV dollars continue to flow in, it won’t be long before dozens of gamers are making more than $1 million every year. In 2017, we’ll take a step closer to that reality.
src:
Sports Illustrated, Feb 2017
“What to expect from the booming esports industry in 2017”
*
Here’s commentary from 2013 on the number of pro gamers:
Being able to subsist solely on a pro gaming salary is a lofty dream indeed. “Business Insider” and e-Sports Earnings reported that only 60 professional gamers worldwide have earned more than $100,000 in prize money, as of 2013. Speaking to “The New York Times” in 2012, Sundance Giovanni of Major League Gaming estimates that “only about 40 people in the U.S. can make a living playing video games. I’d like to get it to a hundred. I think we’re a year or two away from that.”
src:
Chron, 2013, citing NYT (inferred via archive.org)
“Salaries of Pro Gamers”
*
Here’s a bit of a profile of a pro gamer:
There’s a reason why eAthletes are so competitive—their job is easy to lose. As fun as the perks might sound, for Towey, Evil Geniuses, and hundreds of other pro gamers, the eSports life is a grind, not some glamorous dream job. Tournaments aren’t always enough to pay the bills—especially if you don’t win. That’s a big reason that some eAthletes, such as Ryan “State” Visbeck, use streaming to pay the bills.
Visbeck is a 23-year-old professional player of StarCraft II, a strategy game in which players control whole armies rather than controlling a single character as one would in Halo. As a “freelance” pro player—one who isn’t currently tied to a particular pro team—Visbeck spends his days broadcasting his StarCraft II games on streaming service Twitch. The service allows fans to watch Visbeck’s games live as he plays them, and also includes a chat function so they can interact with one another and the pro himself. Visbeck earns money through Twitch streaming subscriptions, which give viewers perks like special chat icons and access to his slate of recorded videos, as well as fan donations. It’s enough to support him as he lives in South Korea, where StarCraft has been extremely popular for more than a decade. Originally from California, Visbeck moved abroad to train with a pro StarCraft team in 2013 and has lived there ever since.
src:
ComPlex, Aug 2016
“eSports Ain’t Easy: Inside the Everyday Grind of Pro Gaming”
Ticket prices for conventional sports and esports
Ask
Extrapolate NFL ticket prices (and other major sports ticket prices)
Contrast with Esports ticket prices
Results
Note: This is all historic data. Some of this could be extrapolated, but we’d need to estimate some data values.
*
Average Ticket Price 2003-2012 for MLB, NBA, NFL, NHL
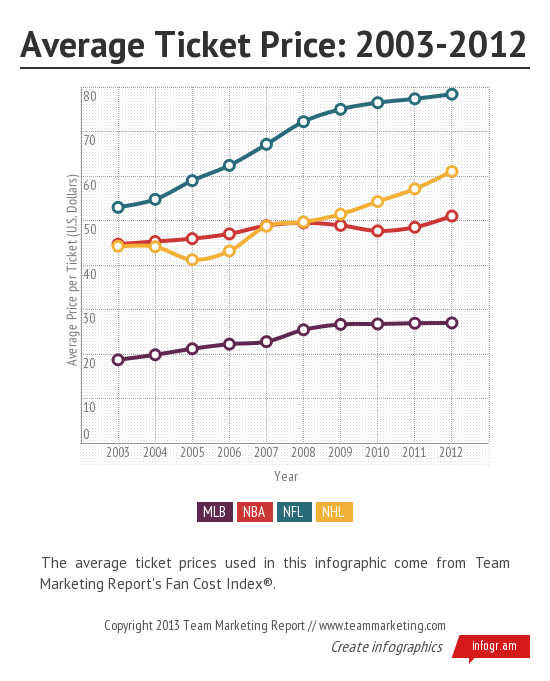
src: someone using Team Market Report data
*
Ticket prices for traditional championship games 2011-2018
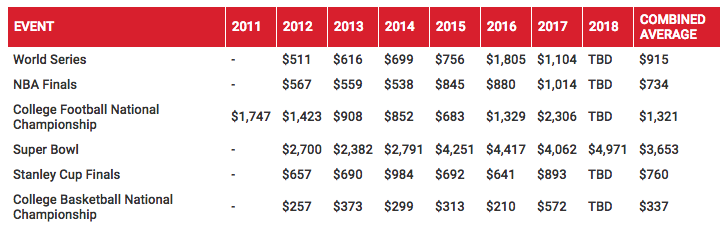
src:
VividSeats, February 2017
*
Avg NFL ticket prices 2006-2016
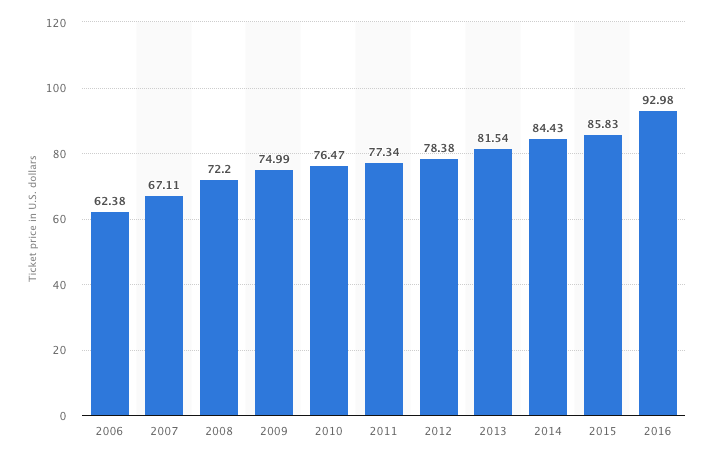
src:
Statista citing Team Marketing Report
*
Fan Cost Index 1991-2016
Fan Cost Index includes:
Two adult average price tickets
Two child average price tickets
Four small soft drinks
Two small beers
Four hot dogs
Two programs
Two adult-size caps
Parking
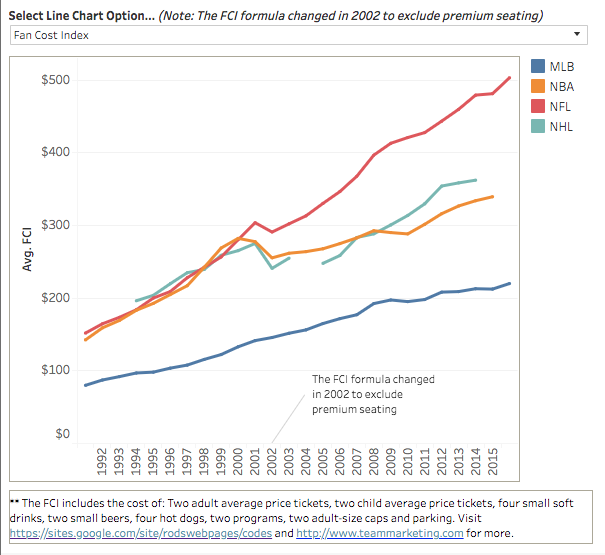
src:
Russell Scibetti, The Business of Sports, Feb 2017
using data from Team Marketing Report
Note: Scibetti also points to another source for aggregated sports business data, by Rodney Fort, Professor of Sport Management at the University of Michigan.
*
Here is a sample of recent ticket prices for major esports tournaments:
2016 League of Legends semifinals
New York, Madison Square Garden
$57-$75
src
2016 League of Legends Championship Series
Los Angeles, Staples Center
$46.50-$71/ticket
src
2017 League of Legends semifinals
Shanghai, Shanghai Oriental Sports Center
$26-$70 (limited number of international tickets)
src
2017 League of Legends Finals
Beijing, Beijing National Stadium (Bird’s Nest)
$41-$185
src
2018 North American League of Legends Championship Series – Spring Finals
two day event
Miami, The Fillmore Miami
$35-$65 for one day
$65-$110 for two days
src
2017 The International Dota 2 Championship
Seattle, KeyArena
$100-$200/ticket (multi-day event)
src
2017 Hearthstone Championship Tour’s Summer Championship
Blizzard Arena Los Angeles (450 capacity)
$15 single day
$40 full weekend
src
Esports vs. Conventional Sports in Revenues
Ask
Extrapolate total revenues for esports vs. total revenues for conventional sports
Results

Source for Esports Revs:
BizInsider, March 2017
citing New Zoo
Source for NHL Revs:
Statista
*
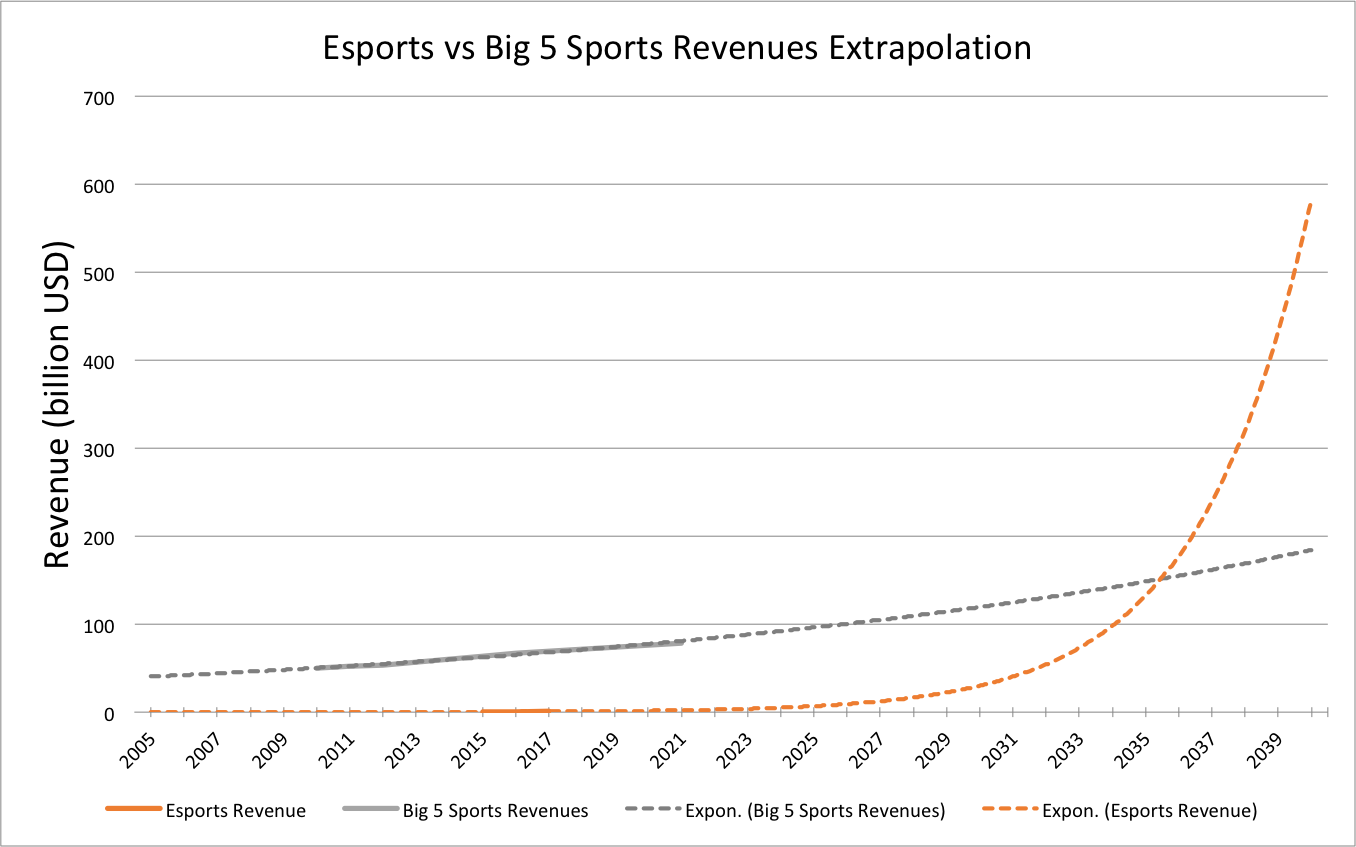
Source for Esports Revs:
BizInsider, March 2017
citing New Zoo
Sources for Big 5 Revs:
PwC Sports Outlook, October 2015 (for 2010-2011)
PwC Sports Outlook, October 2017 (for 2012-2021)
*
CC’s creation notes:
Excel file in One Cloud: Esports-vs-NHL-Rev-Extrapolations.xls
Chart photos in DropBox: Esports-vs-NHL-growth-curves.png
Esports-vs-big5-growth-curves.png
cc-wfh-notes – official-future – flip-point-charts
Using “Growth Trend” values projections in Excel
Instructions:
Select at least two cells that contain the starting values for the trend.
Hold down the right mouse button, drag the fill handle in the direction that you want to fill with increasing values or decreasing values, release the mouse button, and then click Growth Trend on the shortcut menu.
Resource for creating highlights on flip-points
Video Games
Summary
The majority of the video games data I’ve found is historic, with a couple of one-off, short-term forecasts for mobile phone gamers by Statista (2011-2020), and another one-off forecast for 2008-2018 for daily time spent gaming by VSS. I’ve also seen a couple five-year industry revenues forecasts from Euromonitor and Pricewaterhouse Coopers (to 2019), but these figures are pretty well protected behind paywalls. NewZoo also forecasts audience and revenues for eSports to 2019, and they’re pretty open with their data, but these figures are global.
Releases per year historic data is available for 1971-2015 from Moby Games. I also found one Quora estimate for titles released 2003-2012, but this is a very rough approximate showing a trend that does not strictly agree with the Moby Games data.
The ESA publishes an annual “Essential Facts” report, which has recently included numeric estimates of the number of game players (2014). Older reports give percentages only. The indicators describing number of players have varied a bit from year to year, but some approximation is available for 2004 through the present. In addition to the ESA report, GameTrack has also issued a numeric estimate of the number of players, but just for 2012.
A few historic estimates of time spent gaming are available for 2011-2013 from Neilsen; 2008-2018 and 1995-2005 from VSS; 2014 from NPD Group; and 1999-2009 from the Kaiser Family Foundation.
I’ve found one website that provides fairly comprehensive eSports earnings information going back to 1998, including total prize money, tournaments, active players, US players, US earnings, etc.
Findings
Releases Per Year
A 2010 article describing the “death of the video game expert” as a result of the explosion in the number of games published per year refers to video game database MobyGames.com as its source for annual game release numbers. The article includes a chart through 2009, but doesn’t give the tallies for each year, so I’ve retrieved the information from MobyGames.
The simple tally for 1971-2015 is in this Google Sheet.
Note: This database includes substantially more titles than were reflected in the Quora answer below (in which data was gathered by hand from a variety of Wikipedia pages). I believe the MobyGames data to be more accurate.
Srcs:
Dana Laratta. April 8, 2010. “The Death of the Video Game Expert.” BitMob. via Internet Archive.
Game Browser — Year. MobyGames
*
A Quora researcher compiled data from various Wikipedia pages and found that in general there has been a decline in the number of releases per year from 2003 through 2012. Several commenters have theories on why this may be or corroborate the trend.
Trend:
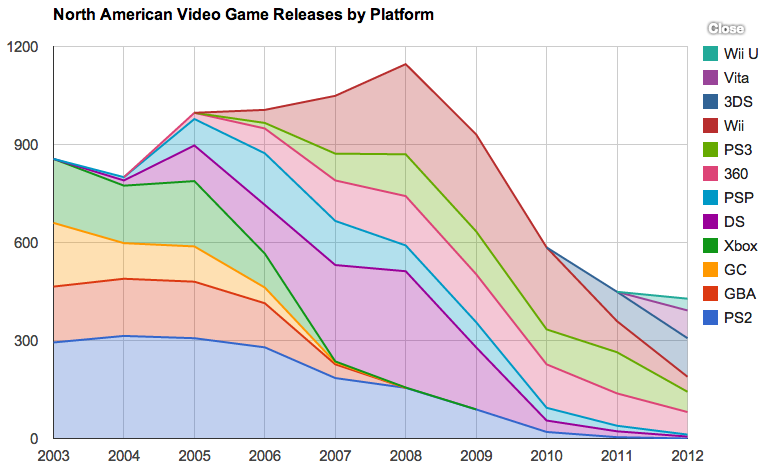
Raw numbers:
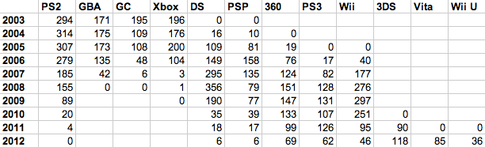
Src: David Cole. October 31, 2013. “On average, how many video games are released each year, by platform?” Quora.
I’m guessing the researcher probably mined these Wikipedia pages:
Category:Video games by year
Category: Video game lists by company
*
Since 1975 (through 2010), 547 films have given rise to around 2,000 video games, and film adaptations are now (2010) a category that accounts for some 10% of video games published.
src:
Alexix Blanchet. December 7, 2011. “A Statistical Analysis of the Adaptation of Films into Video Games”
NOTE: IMAGE LINKS ARE BROKEN, BUT IMAGES ARE AVAILABLE HERE.
author email: alexis.blanchet@univ-paris3.fr
author website.
Video Game Players
Number of Americans aged 11+ who play video games
2012 – 68%, 165 million people
src:
GameTrack, via: Rachel Weber. Dec 11, 2012. “US Still the Gaming Super Power.” GamesIndustry.biz.
*
2014
155 million Americans play video games
4/5 of US households own a device to play video games
51% of US households own a dedicated game console
avg two gamers in each game-playing US household
42% of Americans play video games regularly (3 hours or more per week).
avg game player is 35 years old
26% are under 18
30% are 18-35
17% are 36-49
27% are 50+
56% of game players are male
44% of game players are female
women 18+ are 33% of gameplayers, boys 18- are only 15%
39% of the most frequent gamers play social games
top three types of games that the most frequent gamers play most often:
31% – social games
30% – action
30% – puzzle/board game/card game/game shows
top devices most frequent gamers use to play
PC – 62%
Dedicated console – 56%
Smartphone – 35%
Wireless device – 31%
Dedicated handheld system – 21%
56% of the most frequent gamers play with others
the most frequent gamers who play with others spend an average of
6.5 hrs per week playing with others online
5 hours per week playing with others in-person
src: The ESA, April 2015. “2015 Essential Facts.”
2013 – 59% of Americans play video games
2012 – 58% of Americans play video games
srcs:
The ESA, October 2014. “2014 Essential Facts”
and
The ESA, June 2013. “2013 Essential Facts”
2011
49% of US households own a dedicated console
2010
72% of American households play computer or video games
2009
67% of American households play computer or video games
2008
68% of American households play computer or video games
43% of Americans have purchased or plan to purchase one or more games in the year
2007
65% of American households play computer or video games
42% of Americans have purchased or plan to purchase one or more games in the year
2006
67% of American heads of households play computer or video games
41% of Americans have purchased or plan to purchase one or more games in the year
2005
69% of American heads of households play computer or video games
42% of Americans have purchased or plan to purchase one or more games in the year
2004
75% of heads of households play computer or video games
47% of Americans have purchased or plan to purchase one or more games in the year
Note: I believe the 2005 report (with data for 2004) was the first year the ESA started quantifying the number of players/playing households. The 2004 report (with data for 2003) does not include any such figures.
srcs:
The ESA. “2012 Essential Facts.”
The ESA. “2011 Essential Facts.”
The ESA. “2010 Essential Facts.”
The ESA. “2009 Essential Facts.”
The ESA. “2008 Essential Facts.”
The ESA. “2007 Essential Facts.”
The ESA. “2006 Essential Facts.”
The ESA. “2005 Essential Facts.”
The ESA. “2004 Essential Facts.”
*
Number of mobile phone gamers in the US from 2011 to 2020 (in millions)
2011 – 80.7
2012 – 106.3
2013 – 129.3
2014 – 147.6
2015 – 164.9
2016 – 180.4 (forecast)
2017 – 192.2 (forecast)
2018 – 202.8 (forecast)
2019 – 209.5 (forecast)
2020 – 213 (forecast)
src:
Statista, citing eMarketer
# of Mobile Game Users (millions) – United States
2014 – 83.38
2015 – 95.56
2016 – 104.16
2017 – 112.189
2018 – 120.069
2019 – 125.022
2020 – 128.327
src: Krista Lofgren. February 8, 2016. “2016 Video Game Statistics & Trends Who’s Playing What & Why.” Big Fish Games.
Note: Big Fish Games produces and distributes casual games. These figures were not cited in the blog post in which they were given, but the author confirms by email that the data came from a Statista study on the Digital Market Outlook for video games.
Time Spent Gaming
Claimed weekly hours spent gaming on any platform (US gamers 13+)
2013 – 6.3 hours
2012 – 5.6 hours
2011 – 5.1 hours
src: Nielsen. May 27, 2014. “Multi-Platform Gaming: For The Win!”
*
Time spent daily playing video games per capita
2008 – 17.8 min
2013 – 23.2 min
2018 – 28.3 min (forecast)
src: Veronis Suhler Stevenson & Borrell Assoicates (VSS), 2014, via Emmanuel Agu, et al. “Making Exergames Appealing” in “Handbook on Holistic Perspectives in Gamification for Clinical Pactice,” 2015.
*
daily time spent playing video games per capita in the US in 2018 expected to be 28.3
src:
LexInnova Technologies. July 1, 2014. “Godlike Gaming: A Landscape Analysis On The Future Of The Gaming Industry” p.5
NOTE: I suspect this report is referring to VSS data, although they’re not cited.
Hours per year spent playing video games (vs. reading)
1995 – 80 (100)
2000 – 140 (85)
2005 – 195 (80)
src: Estimated based on a chart citing Versonis Suhler Stevenson Communications Group. 2005. “2004 Communications Industry Forecast and Report.” adapted in: Lawrence Baines. 2008. “A Teacher’s Guide to Multisensory Learning.”
Note: Converting the hours/year above to minutes/day would yield
1995 – 13.2
2000 – 23.0
2005 – 32.1
*
2014 – 34 million “core gamers” play core games on core devices an average of 22hrs/wk
These “core gamers” make up 12% of the total survey respondents (extrapolated to 34 million individuals ages 9+). This is down two percent from 14% of respondents in 2013.
Among the total surveyed population, 42% (extrapolated to 118 million individuals ages 9+) play on a core device. 19% (extrapoalted to 53 million) play 5+ hours per week on a core device.
“Core gamer”: individuals who play video games five or more hours per week on a PlayStation3, PlayStation 4, Xbox One, PC, or Mac, and who play Action, Adventure, Fighting, Flight, Massively Multi-Player, Racing, Real Time Strategy, Role-Plating, Shooter, or Sport genres on any of those devices.
src: NPD Group. May 13, 2014. “The NPD Group Reports 34 Million Core Gamers Spend an Average of 22 Hours per Week Playing Video Games”
and
NPD Group. April 2014. “Core Gaming 2014 Snapshot Report.”
*
Among children aged 8-18, average time playing video games
1999 – 26min/day
2004 – 49min/day
2009 – 1hr13min/day
Among children aged 8-18, average time playing games on computer
1999 – 12min/day
2004 – 19min/day
2009 – 17min/day
Note: this study also includes daily consumption figures for TV, music/audio, computer (including a games subcategory – don’t think this is included in the standalone video game consump figures), print media, movies
src:
Kaiser Family Foundation. January 2010. “Generation M2”
Industry Revenue Forecasts
Euromonitor International.
July 2015. “Video Games in the US.”
Includes industry stats 2009-2014, five year forecast from 2014-2019 (“Video games is expected to see a CAGR of 4% at constant 2014 prices over the forecast period.” Early growth will be driven by console purchases, thereafter by software sales.) Fee-based report – no other figures freely accessible.
Pricewaterhouse Coopers,
via Venture Beat.
June 2, 2015. “U.S. games industry forecast to grow 30 percent to $19.6B by 2019.”
Contacts:
Pauline Orchard
Nicholas Braude
Annaul global entertainment and media outlook (Outlook), covers 13 entertainment and media segments, including video games. The Outlook provides a five-year foreast and five-year historic consumer and advertiser spending data and analysis.
US video game industry (console and PC games, browser-based games, apps, digital and physical, game advertising) will grow 30% from $15 billion in 2014 to $19.6 billion in 2019, with a mature compound annual growth rate of 5.5% Traditional console and PC games were about 80.8% of game industry revenue in 2014, and expected to drop a fraction to 79% by 2019. These figures DO NOT include hardware sales of gaming PCs, consoles, or other devices.
Physical PC game sales are projected to decline, but digital games will grow with a CAGR of 6.8% (from $501M to $696M.
Online PC games are expected to grow from $2.53B to $3.66B, a CAGR of 7.6%.
Total console games are expected to to grow from $8.84B to $11B, a CAGR of 4.5%. Online/microtransaction console games revenue is the fastest growing part of console-related traditional gaming, rising with a CAGR of 17.8%
Beyond traditional games, social/casual gaming revenue will grow at a CAGR of 4.5%, reflecting a switch from browser-based to app-based revenue. Overall, the social/casual segment of gaming will be 12% of the total revenue in 2019.
Video game ad revenue is forecast to grow at a CAGR of 11.1%. Game ad revenues are stronger in the US than any other market because of the fragmented media landscape in the US, high digital video recorder ownership (which makes it easy to skip TV ads), high social network engagement, and low newspaper readership, all of which drives advertisers to seek out consumers in places like gaming.
eSports Viewership
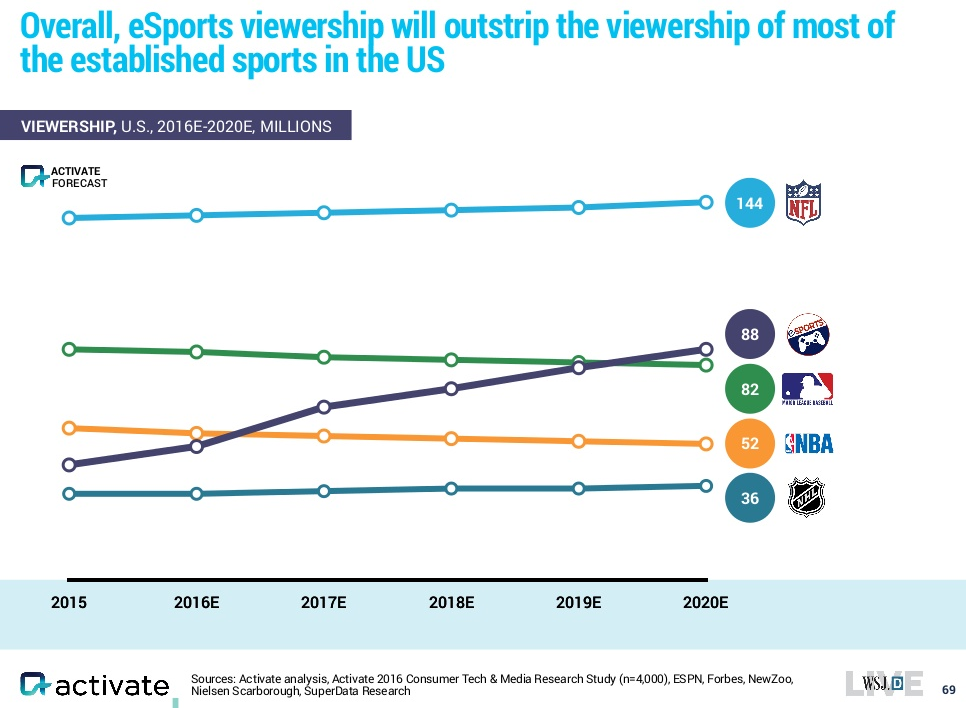
src:
Activate. October 2016.
“Tech and Media Outlook 2017.”
*
71.5 million people watched competitive gaming in 2013.
src:
Phillippa Warr. April 9, 2014. “eSports in numbers: Five mind-blowing stats.” Redbull.com
*
Note: In the following poll, esports viewership makes up a small percentage of overall gaming video content, which includes trailers, reviews, walkthroughs, etc.
Worldwide gaming video content audience (all types of content, defined below)
2015 – 486 million
2017 – 790 million (forecast)
US gaming video content audience
2015 – 125 million
2017 – 181 million
Poll respondents had viewed gaming-related video content at least once in the past year.
Type of gaming video content viewed by US internet users, May 2015 (% of Respondents)
69% – trailers promoting upcoming video game relases
54% – humorous clips/montages of gameplay recorded by other players
53% – walkthroughs to help players complete a game, level, or side quest
52% – reviews (professional or amateur)
37% – gameplay with commentary by online personalities
33% – live streams
29% – peer-to-peer privately shared content
24% – esports (professional gaming)
src: SuperData Research via: eMarketer, July 20, 2015. “Consumers, Advertisers Enter Gaming Video Zone.”
*
2015 – 150MM will have viewed an eSports tournament
Average 12-month video game spending by platform, for an average eSports viewer (amongst North American PC Gamers)
$176 – PC Games (client-based)
$111 – Console Games
$29 – Handheld Games
$19 – Mobile Games
versus the same 12-month spending for eSports non-participants
$125 – PC Games
$93 – Console Games
$16 – Handheld Games
$18 – Mobile Games
Note: Not sure if “non-participants” are gamers who haven’t played competitively in eSports matches, or gamers who don’t watch esports.
src: Electronic Entertainment Design and Research (EEDAR), November 1, 2015. “ESports is Not a Fad”
*
2015
About half of eSports viewers spend 1-4 hours per week watching esports. 20% watches for less than 1 hour per week, 20% watches 5-9 hours.
src: EEDAR. 2015. “ESports Consumer Analysis Whitepaper (report sample).” p.19
EEDAR contact: Cooper Waddell cwaddell@eedar.com
Global Esports Audience
Last year (2014) the World Championship finals for a fantasy-strategy game called League of Legends drew 45,000 spectators to the Seoul World Cup Stadium to watch 16 teams from South Korea and China battle it out for a $2.13 million prize pool, with a further 27 million people watching online.
Major League Gaming (MLG), founded 2003
chairman, Mike Sepso
MLGtv attracts 27 million viewers a month, drawing its revenue largely from mainstream consumer advertisers – fast-food chains, grooming products, car manufacturers. Sepso puts the company’s value “in the hundreds of millions” of dollars.
The top-earning CoD player is 22-year-old Matt Haag, who plays for Team Optic under the name NaDeSHoT. Three years ago Haag was flipping burgers in McDonald’s. He now has 1.6 million subscribers to his YouTube channel, 1.1 million followers on Twitter, and reportedly earns close to $1 million a year.
With a basic salary, and money made from weekly online tournaments, players can make $30,273 – $45,409 a year. The real money lies in sponsorship and the advertising revenue to be made from building up a fan-base by streaming on YouTube or Twitch.
SBRnet. May 1, 2015. “Video Games Becoming a Spectator Sport”
*
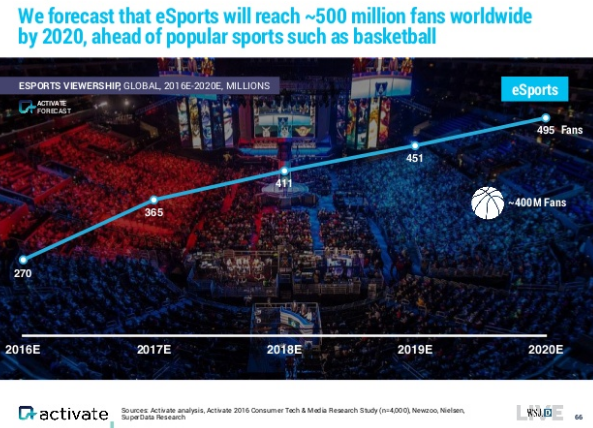
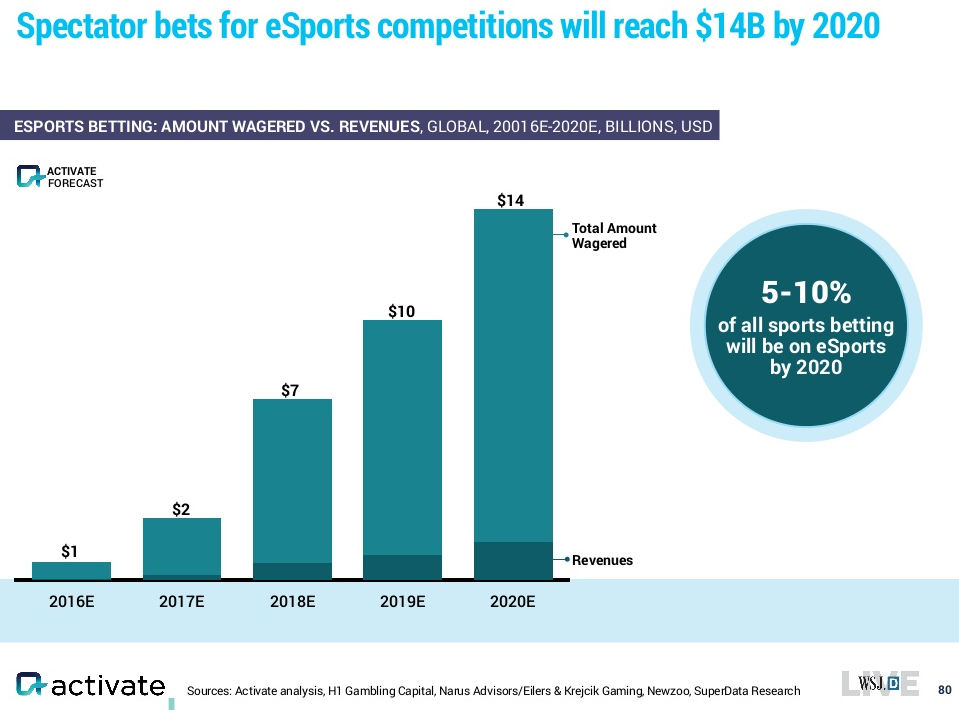
src:
Activate. October 2016.
“Tech and Media Outlook 2017.” Slides 66, 80.
*
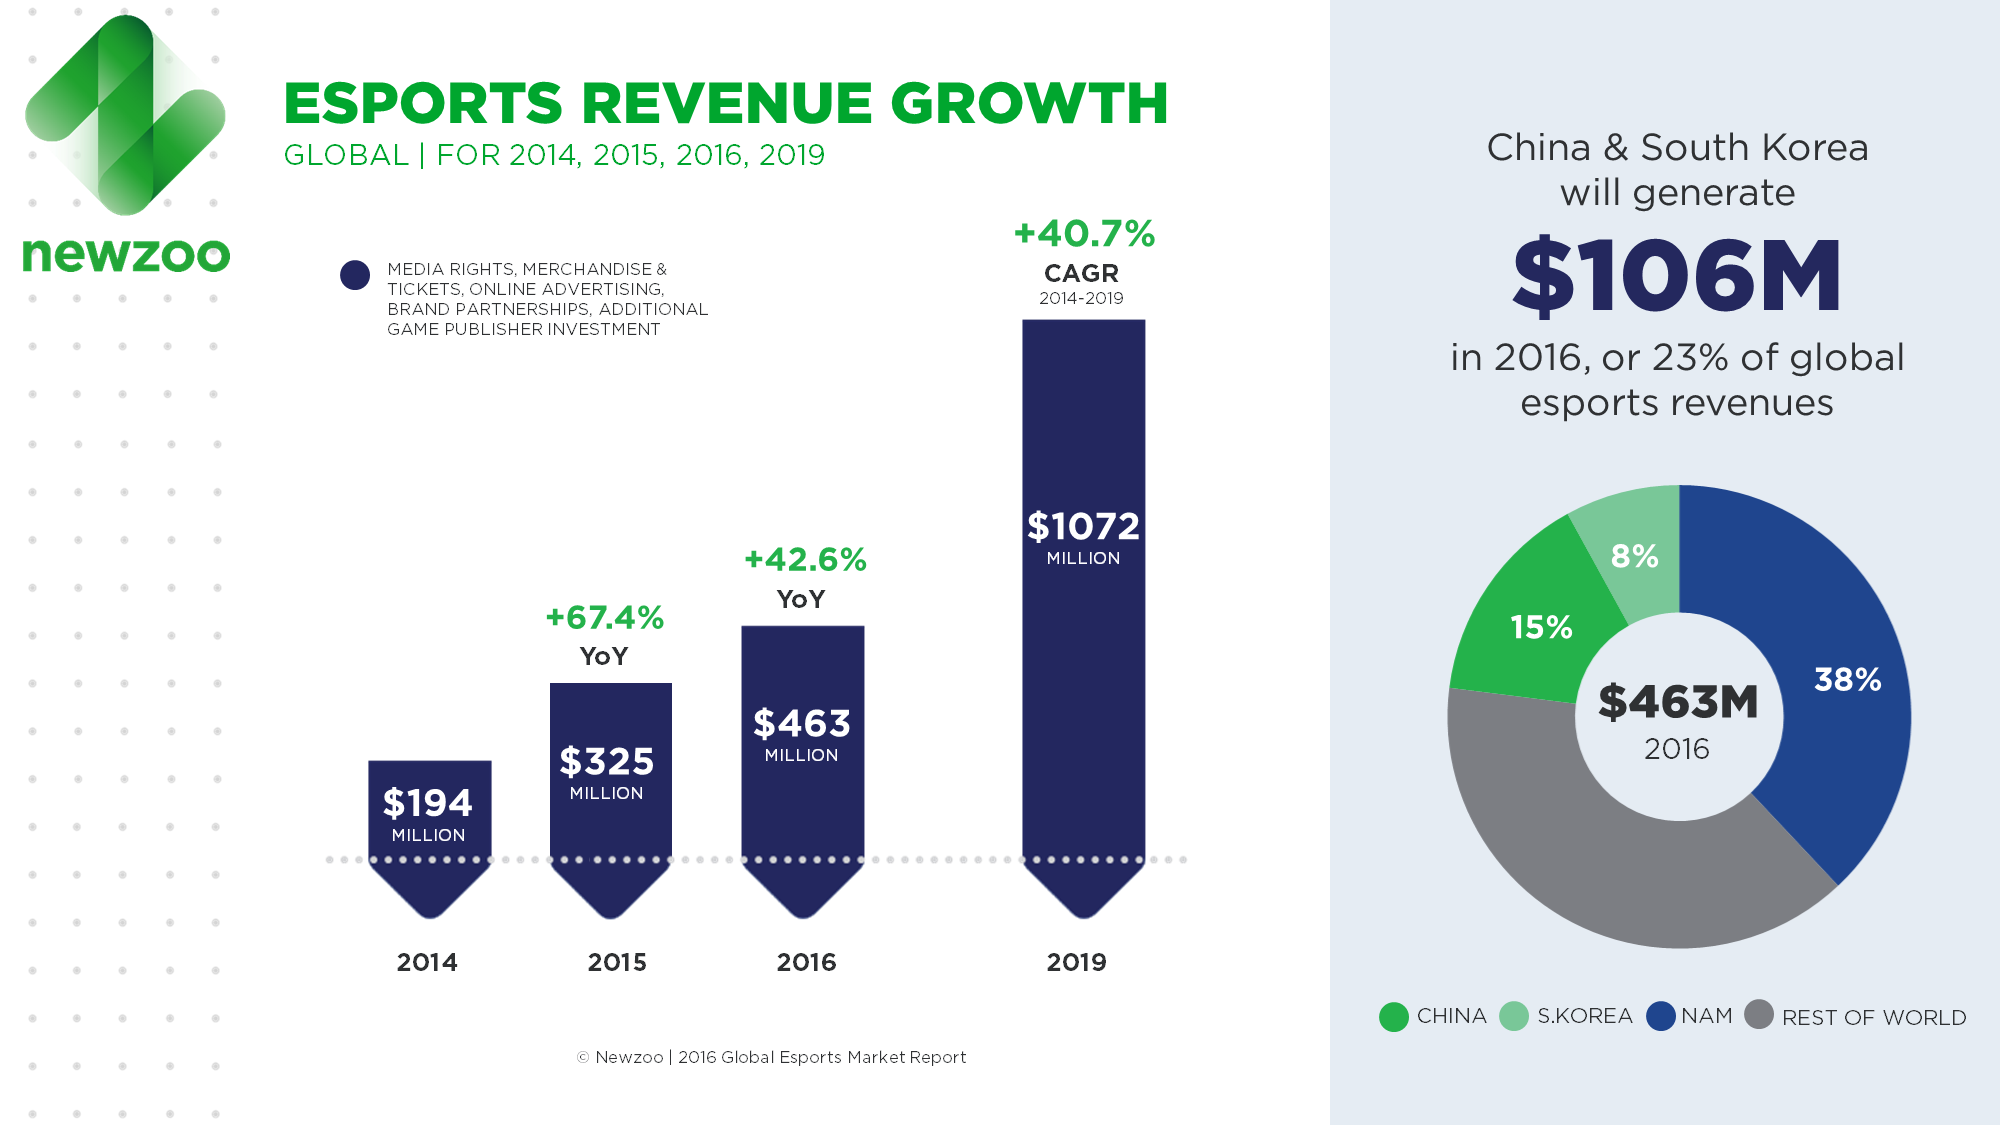
NewZoo is a video game and esports research firm. Below are excerpts from both their 2016 and 2015 reports. The 2015 report makes some interesting scale comparisons to traditional sports.
2016 updates:
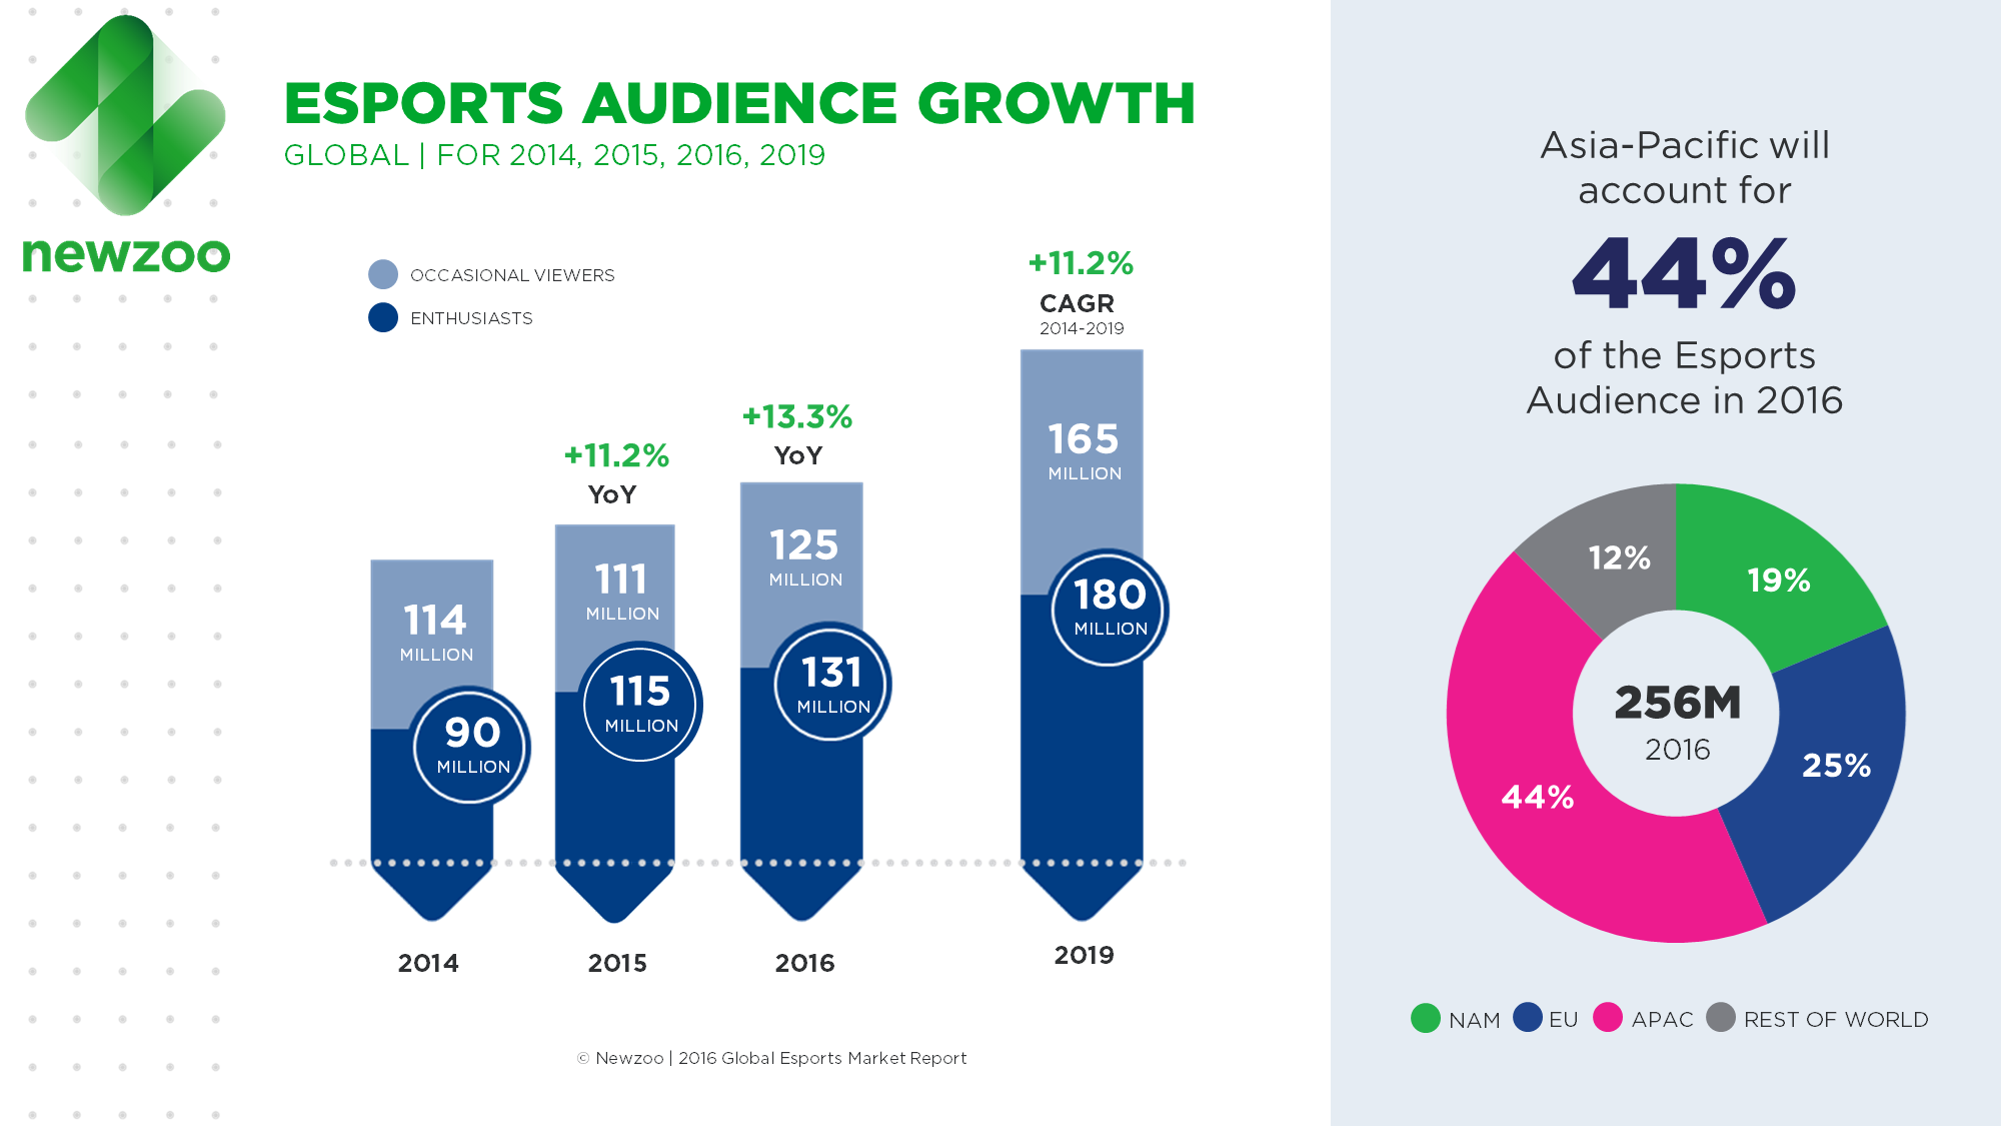
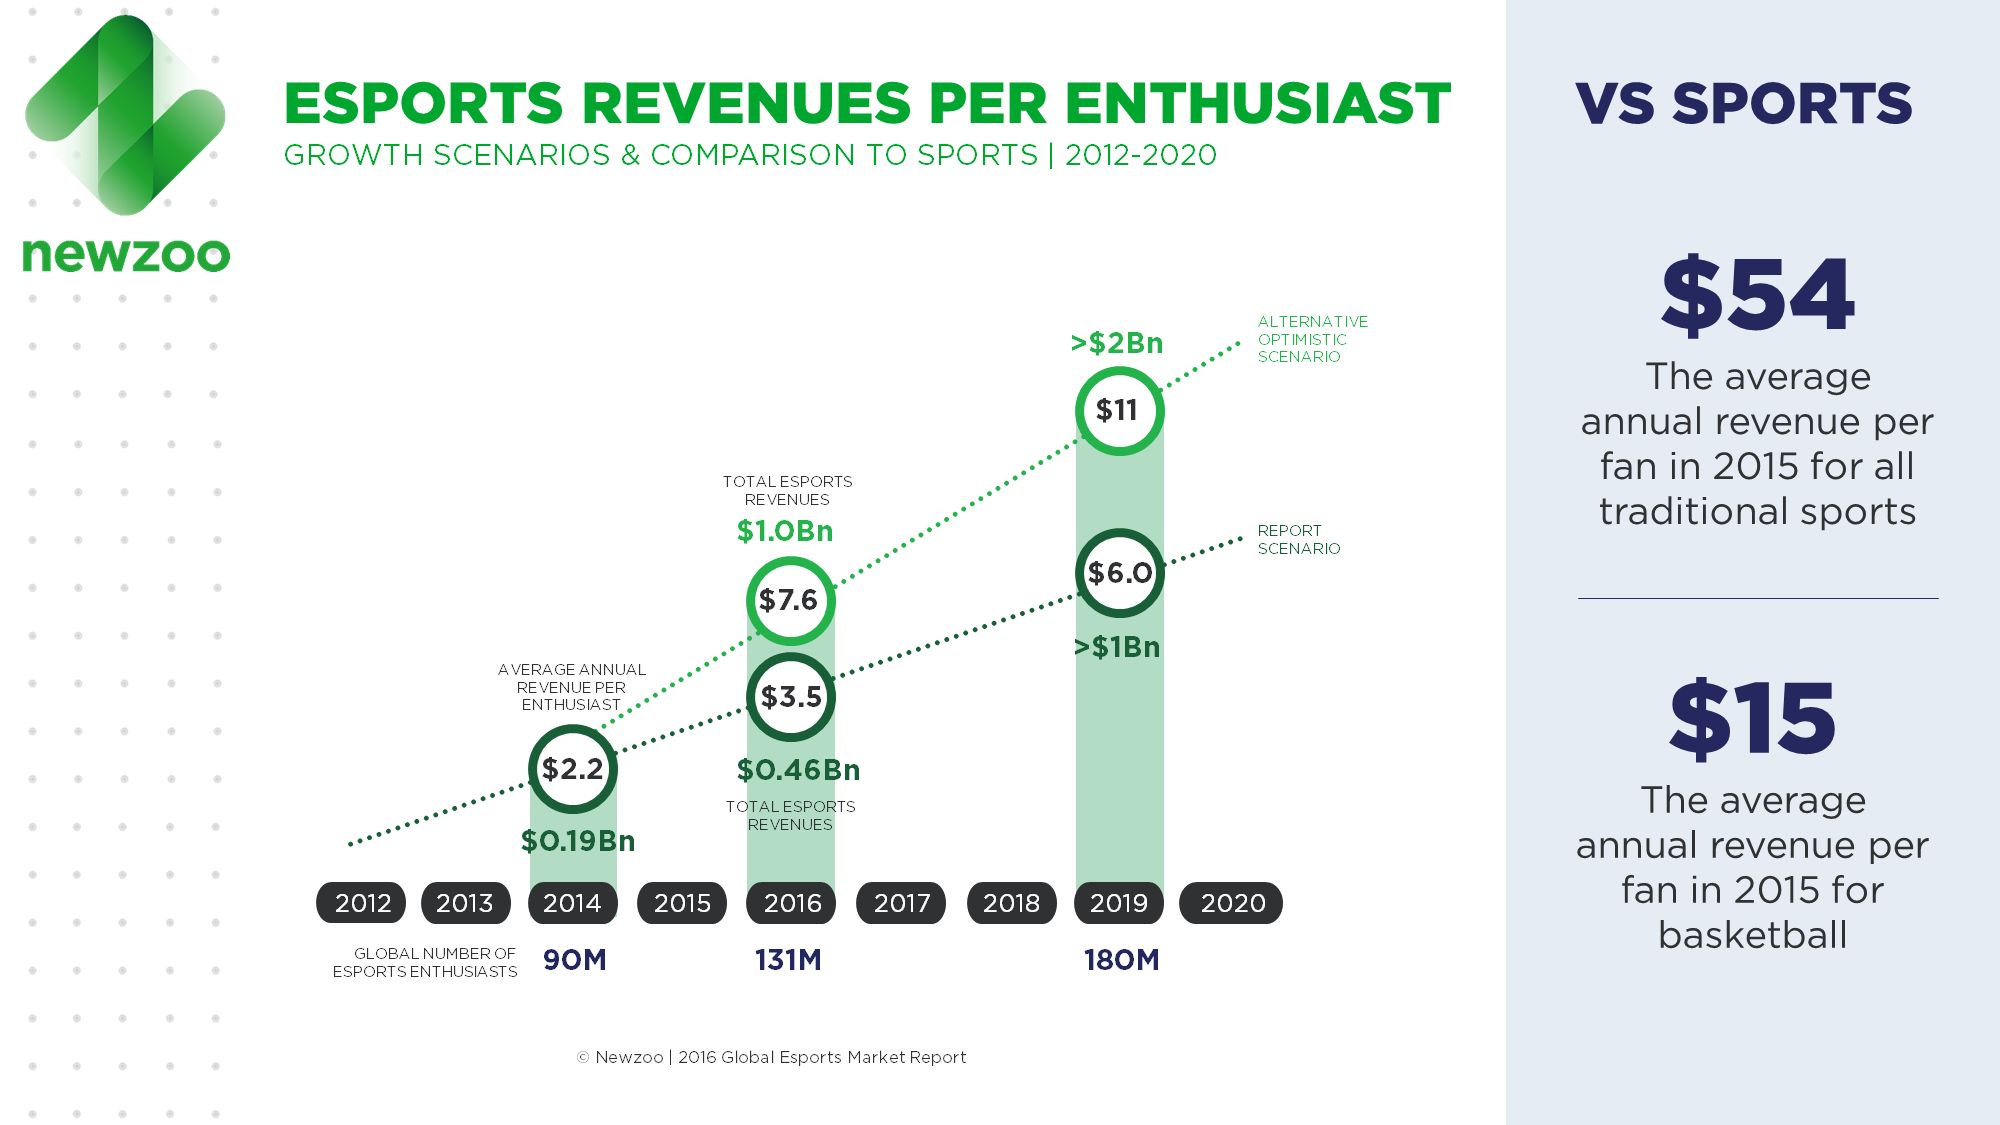
2015 excerpts:
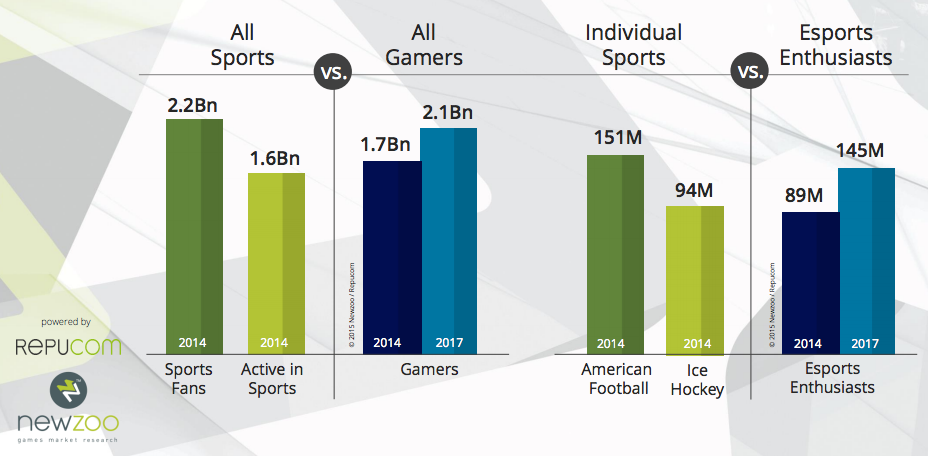
In terms of audience, the report shows that the number of esports Enthusiasts will jump from 89 million last year (2014) to 145 million in 2017. Another 190 million will watch esports competitions occasionally, showing that competitive gaming has evolved to a spectator sport with a fan base comparable to that of Volleyball, American Football or Ice Hockey.
In terms of fans, there are 2.2 billion people globally who consider themselves to be interested or very interested in sports and of these, 1.6 billion actively participate in at least one sport. This is comparable to the 1.7 billion people that play games. On a global scale, the number of esports enthusiasts compares well to mid-tier traditional sports. Swimming and ice hockey for example have 76 million and 94 million global fans respectively, similar to the 89 million esports enthusiasts. By 2017, the global number of esports fans will come close to that of American football.
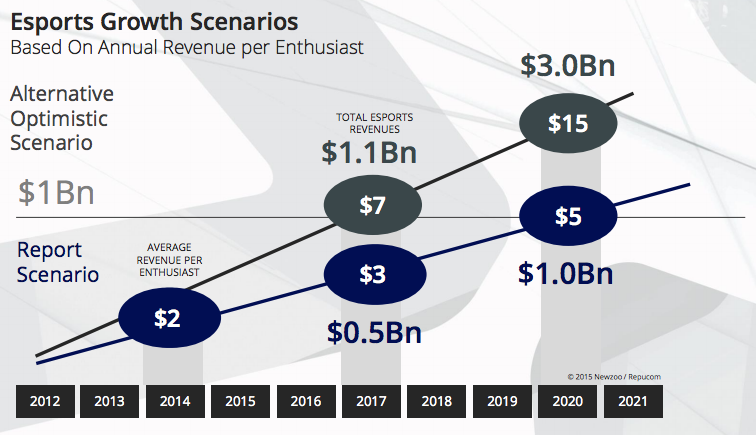
On a global scale, there are 2.2 billion sports fans who each generate an average of $56 per year. The average revenue for individual sports is anywhere from $20 upwards. Esports enthusiasts on the other hand, currently generate an average of $2.2 per person per year, without game revenues taken into account. Our current esports revenue projections use a conservative $3.2 average revenue per enthusiast figure for 2017. With growth mainly driven by a larger audience, global esports revenues will still rise to $451 million in two years from now. This renders esports comparable to a top 10 sport or globally renowned leagues like the NFL or Champions League. If the average revenue per enthusiast grows faster and jumps to $7, esports will be a billion dollar business by 2017 with even more growth potential going forward. Drawing from the comparison with traditional sports, the report highlights which factors will determine the pace of growth of the esports Economy.
srcs:
NewZoo. January 25, 2016. “Global Esports Market Report: Revenues To Jump To $463M In 2016 As Us Leads The Way.”
and
NewZoo. February 16, 2015. “The Esports Economy Will Generate At Least $465 Million In 2017.”
11-page preview
eSports Earnings
esportsearnings.com tracks prize earnings, and player, team, and country rankings. Historic data goes back to 1998. Information is sourced from the community, but there is a strict requirement for data to be cited. I cross-referenced a few of the figures against data reported by Redbull’s esports reporting, and the figures were very close.
Data is collected in the following Google Doc.
This database has been cited in reporting by The Verge.
Sports Fandom, Spending & Spectatorship, Fantasy Sports
Summary
Most of the data reported here are historic, although I’ve found a couple forecasts from Pricewaterhouse Coopers for stadium building, and ticket and merchandise sales, 2008-2019.
A small chart contrasting data on sports attendance spending vs. consumer confidence 2011-2015 was published by Rich Luker, who runs ESPN’s annual Sports Poll. I suspect we could find more historic data for both lines to create an expanded chart.
I’ve found several polls describing sports fandom. For the most port, the polls give percentages of respondents, rather than raw figures. Harris’s poll presents the oldest data I’ve seen (back to 1985), although I believe ESPN’s poll has been running for longer than it’s published data would suggest (chart shows data back to 2000, but I think the polls have been running since the mid ’90s).
I’ve collected major league attendance for the NBA and MLB are available back to 1981, and for the NFL back to 1994. Older NFL attendance available is probably available, somewhere.
Team Marketing Report publishes a “Fan Cost Index” which tracks the prices of tickets, as well as other typical spectator expenditures (eg: hot dogs, beer, etc). I’ve found their data for NFL ticket prices back to 2006 via Statista. We should try to contact them for more data.
Findings
Sports Fandom
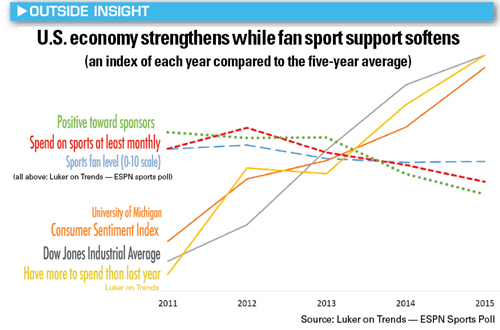
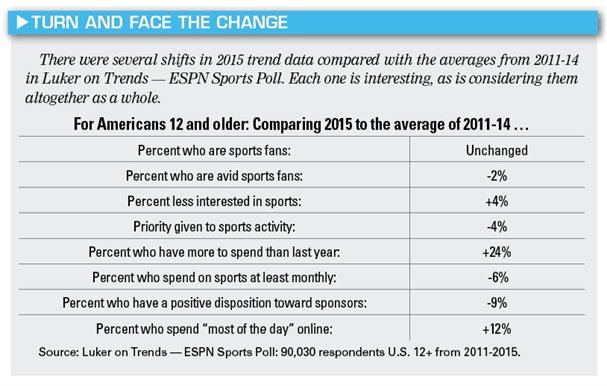
In 2015, 23.4 percent of Americans spent on sports at least once a month, a 6 percent decline from the average 24.9 percent for 2011-14. This trend, if it continues for five more years, will reduce the number of people spending monthly by 10 million.
The University of Michigan Consumer Sentiment Index, which measures consumer confidence, rose by 21 percent in 2015 compared with 2011-14, and the Dow Jones Industrial Average was up 24 percent in 2015 compared with 2011-14. These three sources of data, showing similar growth, indicate a context where more frequent spending in sports should have taken place. And generally, for more than 22 years, engagement in sports has mirrored the performance of the economy and personal finances. We noticed a shift in those trends around 2011, when it seemed the economy was perking up.
The percentage of American sports fans remained near a very stable 88 percent from 2011-15, but avid fans declined by 2 percent in 2015, and those who placed a high priority on time and investment in sports interests dropped 4 percent. Similarly, 4 percent more Americans said they were “less interested in sports than they were the year before” in 2015, compared with the 2011-14 average.
src:
Rich Luker. February 22, 2016. “Sports spending not on pace with economic growth.” Sports Business Daily. contact: rich@lukerco.com
*
Harris has run an annual poll at least since 1985 asking what Americans’ favorite sports are. In this chart, data is only available for the latest year (2014), but we may be able to obtain figures for the preceeding years by contacting Harris.
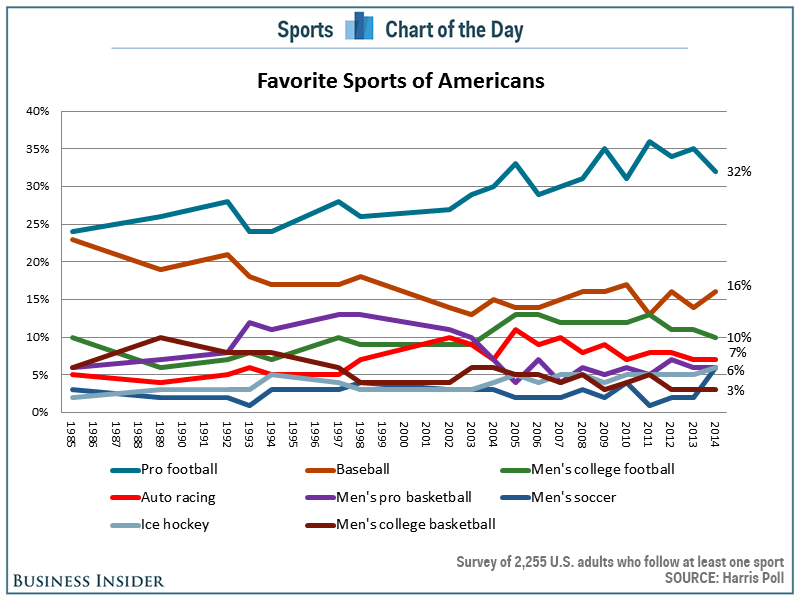
src:
Harris Poll, via
Cork Gaines. February 20, 2015. “The popularity of the NFL is starting to fall in the US.” Business Insider
TO DO: CONTACT HARRIS TO ASK FOR HISTORIC DATA POINTS.
A much simpler, semi-regular Gallup poll, 2001-2015, simply asks if people consider themselves sports fans.
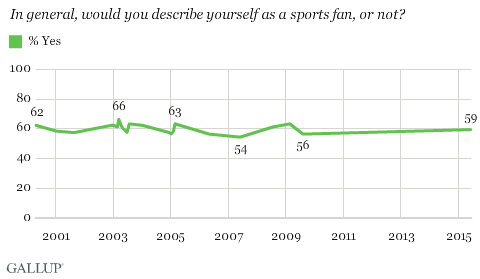
src:
Jeffrey M. Jones. June 17, 2015. “As Industry Grows, Percentage of U.S. Sports Fans Steady.” Gallup.
The ESPN Sports Poll, run annually since 1994 by Rich Luker, defines percentages of fans and avid fans, and, by subtraction, non-fans. This particular graphic only give data back to 2000, but we may be able to ask Luker (or his colleague) for older data.
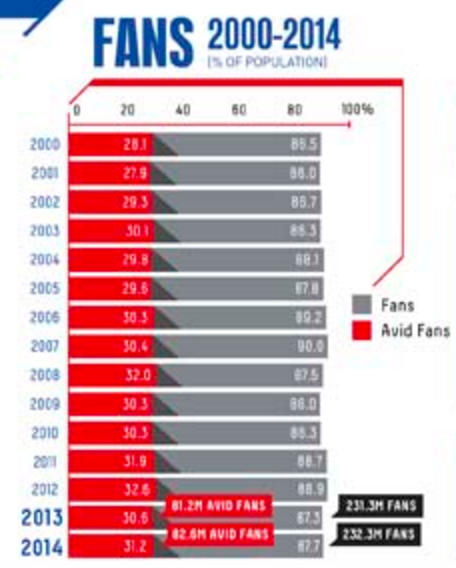
src:
Jess3 (the graphic’s designer), 2015.
Using ESPN Sports Poll data, collected by Rich Luker and Chad Menefee. Contact: chad@lukerontrends.com
TO DO: EMAIL CHAD MENEFEE TO ASK FOR OLDER DATA
The ESPN Sports Poll has also been tracking college sports fans at least since 2000. This chart shows percentage and numeric data for 2000-2010.
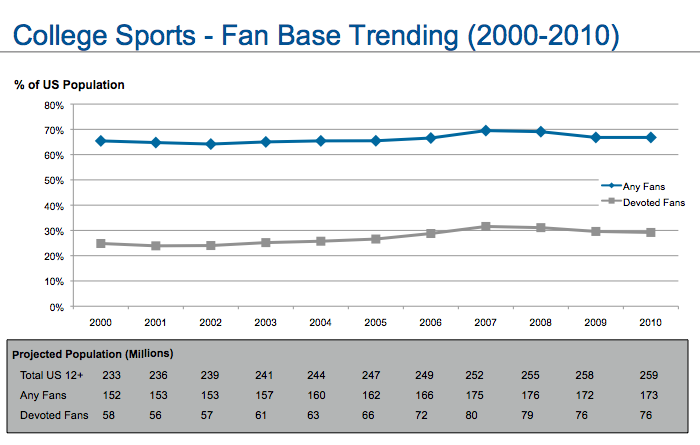
src:
Kenneth Cortsen. August 16, 2013.
“IMG’s Capitalization On Sport Stars And Other Assets – IMG College Is Meant For Success.”
Spending And Spectatorship
Pricewaterhouse Coopers publishes an annual 5-year-forecast of sports industry figures, including gate revenues and merchandising. The publications also include data for the previous five years. Data for 2008-2019 are freely available in the 2013, 2014, and 2015 editions, and I’ve aggregated the gate revenues and merchandising data in the following Google Sheet:
src: Adam W. Jones (editor). “PwC Sports Outlook.” PricewaterhouseCoopers LLP.
contact: adam.w.jones@us.pwc.com
November 2013 edition
October 2014 edition
October 2015 edition
*
Super Bowl Viewership
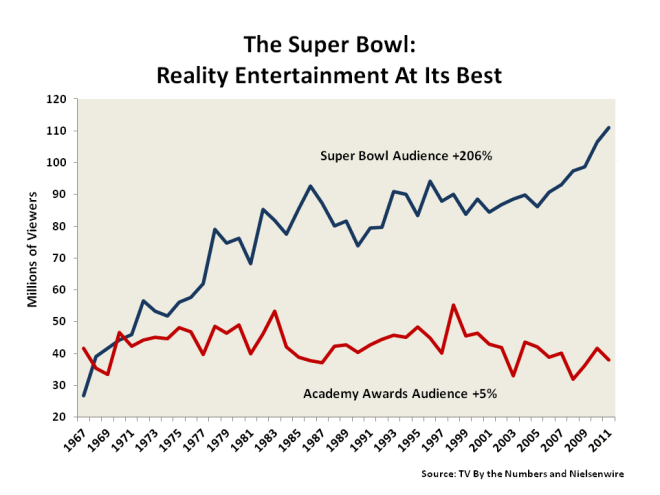
Src:
Stephen Bronars. February 2012.
“The Super Bowl and the Oscars.”
Citing:
TV By the Numbers and Nielsenwire
*
TV viewership of the Super Bowl in the United States from 1990 to 2016 (in millions)
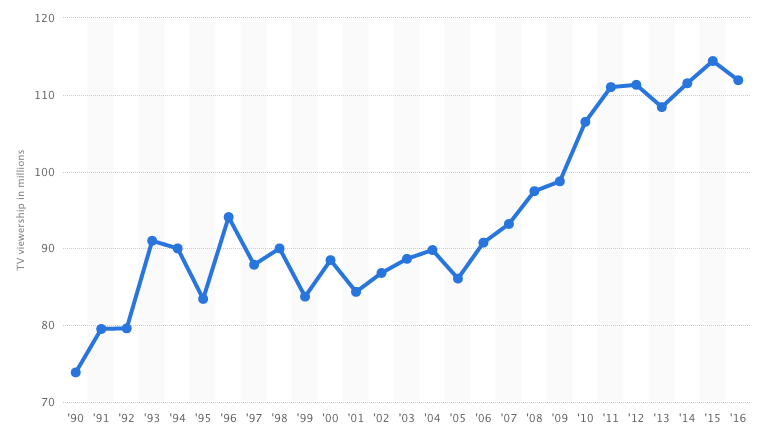
Src:
Statista. Accessed November 2016.
“TV viewership of the Super Bowl in the United States from 1990 to 2016 (in millions).”
TO-DO: EXTRACT THE ANNUAL DATA FROM THE DATA LINK (HOVER MOUSE OVER EACH DATA POINT ON THE CHART).
*
Professional League Game Attendance
ESPN collects historic game data, including attendance, going back to 2001, for several professional sports. However, Peter Von Allmen, an academic economist and current president of the North American Association of Sports Economists (NAASE), referred me to the [sport]-reference.com websites as an excellent source for historic sports data going back much further than ESPN’s data.
I’ve compiled the [sport]-reference.com data describing the number of teams and attendance (total regular season, and average per game attendance, in some cases) for the NBA, MLB, and NFL in the following Google Sheet:
Note: NBA data is collected for 1981-2016. Attendance figures are actually available going back to 1946, but only for a couple teams per season.
Srcs:
Basketball-Reference.com
[Click on a season date, then Summary, then Miscellaneous Stats to find attendance figures.]
Baseball-Reference.com
[Click on a season date, then Other, then Attendance & Misc.]
Pro-Football-Reference.com
[Click on “NFL” next to a season date, then Other, then Attendance]
NOTE: The tallies on the NFL site are incorrect, so I’ve re-calculated them
Other sources:
NHL attendance
ESPN has data back to 2001
but HockeyDB.com has league totals data back to 1994
and average home game data older than that
Average home game data
AWAITING AN EMAIL (5/2/16) FROM RALPH SLATE, WHO MAY BE WILLING TO SHARE
MLB and NFL data is available from ESPN, going back to 2001
NCAA Football
total fans per year 1954-2014
THERE’S A GRAPH, BUT ONLY 2014 IS LABELED WITH A FIGURE
src: National Football Foundation, June 2015
“2014 Report: Passion for College Football Remains Strong.”
*
Average NFL ticket price, 2006 – 2015
2006 – 62.38
2007 – 67.11
2008 – 72.2
2009 – 74.99
2010 – 76.47
2011 – 77.34
2012 – 78.38
2013 – 81.54
2014 – 84.43
2015 – 85.83
via Statista, citing TMR 2006 to 2015
(TMR: Team Marketing Report)
Major league facilities
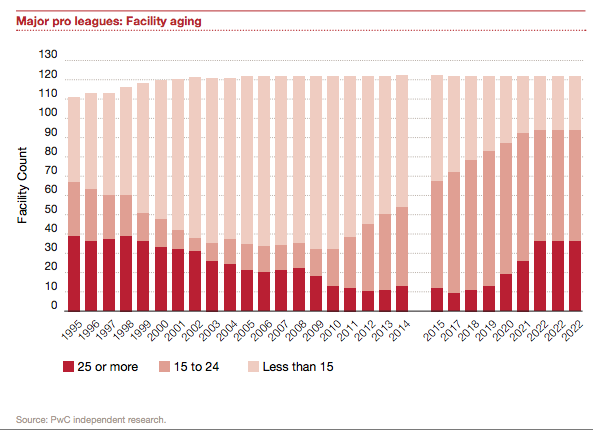
src: Adam W. Jones (editor). “PwC Sports Outlook.” October 2014. PricewaterhouseCoopers LLP. P.4
contact: adam.w.jones@us.pwc.com
Fantasy Sports
Number of fantasy sports players by year (Figure 2)
1988 500,000
1991-1994 1 – 3 Million
2003 15.2 Million
2004 13.5 Million
2005 12.6 Million
2006 18 Million
2007 19.4 Million
2008 29.9 Million
2009 28.4 Million
2010 32 Million
2011 35.9 Million
2014 41.5 Million
2015 56.8 Million
Percentage of fantasy sports players compared to the general population of the United States, age 12+ (Figure 1)
Total – 14%
Adults – 13%
Teens – 18%
Male – 19%
Female – 8%
College Education – 18%
No College Education – 10%
HH Income $50k+ – 16%
HH income <$50K – 10%
On average, fantasy sports players (age 18+) spend $465 on league-related costs, single-player challenge games, and league-related materials over a 12-month period. Up from $95 in 2012 (src: press release).
src: Fantasy Sports Trade Association. “Industry Demographics.” Accessed May 4, 2016.
press release for the recent research
Historic Variety of Sports
Summary
To get a sense for the growth in the variety of commonly practiced sports, I considered which organizations would have been tracking individual sports in an official capacity. The International Olympic Committee (IOC) has a fairly long modern history, but sports included in the Olympic Games are restricted by the organizations rules, so while the IOC list certainly includes many of the most popular sports, and reflects some shifts over the last century, it certainly does not include many emerging but popular sports, or sports that are very popular in a particular region (like American football). I wrote to a number of organizations that lobby on behalf of sports that may have international federations, but lack representation in the Olympics, but I was not able to obtain historic data from any of them. I also thought to consult lists maintained by the National Federation of State High School Associations (NFHS) and the National Collegiate Athletic Association (NCAA), but these share limitations similar to the sports represented by the IOC. At the other end of the spectrum, I found one website, Topend Sports, which has a fantastic list of sports from around the world which seems quite comprehensive, but unfortunately offers no date information (either documenting when the sport was created or when it became popular).
Findings
International Olympic Committee (IOC)
Some context on IOC terminology and rules:
The IOC uses the terms “event,” “discipline” and “sport” to organize their athletic competitions. An event is any competition that results in the awarding of medals, such as the women’s 100-meter backstroke. The discipline of swimming, which comprises various events like the backstroke, breaststroke and freestyle, is a branch of the sport aquatics.
For a sport or discipline to be considered for the Summer Olympics, it must demonstrate popularity among both genders in various parts of the world. Men from at least 75 countries and women from at least 50 countries should practice a given sport on four continents.
When determining which sports to include in an Olympic program, at least 25 of the sports offered must come from the 28 sports established by the IOC. Up to three additional sports may be added that are not from among this pre-established group.
src:
Greg Soltis. July 27, 2012. “The Incredible Evolution of the Olympics.” LiveScience.
After writing to the International Society of Olympic Historians, I was referred to Bill Malon, who maintains an extensive Excel document with data from 1896-2012, including:
Number of Events per Sport by Year (by gender)
Total # of Events by Year (broken down by gender)
Total # Sports by Year (broken down by gender)
List of Sports and Events by Year (by gender)
List and Total # of Countries by Year
Mr. Malon’s Excel file (originally shared as OGCompShort.xls) is available in this Google Sheets document:
A simple list of the number of sports in each Olympic Games by year is also maintained by Topend Sports: Olympic Games Sports Changes. The list notes which sports were added or dropped in each Games.
*
Agencies That Support the IOC
SportAccord
An association composed of autonomous and independent international sports federations and other international organisations contributing to sport in various fields.
SportAccord promotes sports, increases its and its members’ recognition by the Olympic Movement, and organizes multi-sports games.
To be a Member, an organization must group together the majority of the National Federations throughout the world practicing its sport and regularly hold international competitions. To be an Associate Member, an organization can either group together the activities of several Members or National Olympic Committees for the purpose of organizing competitions, or have objectives recognized by the Council as benefiting the other Members of the Association.
(Previously known as GAISF, the General Association of International Sports Federations.)
src: SportAccord. “2014 Statutes.” Accessed April 7, 2016.
Members list – 106 members
Contact: sportaccord@sportaccord.com
EMAILED 4/13. No reply.
Also sent inquires to The Association of IOC Recognised International Sports Federations (ARISF), info@arisf.org, and the Alliance of Independent Recognised Members of Sport (AIMS), contact form. No reply from them either.
*
Sports counted in the NFHS Annual Survey, 1969-2015
Counting each sport that gets its own major subject heading in the tables. For example, “Skiing — Alpine” and “Skiing — Cross Country” count for a total of two sports. However, “Football — 11-player”, which often includes three subheadings (“6-player,” “8-player,” and “9-player”), is only counted once. “Flag Football,” with its own heading is counted separately from “Football — 11-Player.”
For example:
[NFHS-skiing-headings.png]
…
NFHS-football-headings.png
Note: Each of the annual surveys are freely available, but this is a sampling of every five years.
1969/70 – 29 sports
1975/76 – 31 sports
Added: Archery, Drill Teams, Table Tennis, Weightlifting
Dropped: Rowing, Rugger
1980 – 36 sports
Added: Canoeing, Crew, Eskimo Games, Judo, Soft Tennis, second Softball category
Dropped: Rugby
1985 – 31 sports
Dropped: Curling, Drill Teams, Eskimo Games, Soft Tennis, Table Tennis
Added: Equestrian, Heptathalon
Condensed to one entry each: Softball, Track & Field
1990 – 32 sports
Added: Other
1995 – 38 sports
Added: Adapted Sports, Competitive Spirit Squads, Team Tennis,
De-condensed: Skiing, Softball, Track & Field
2000 – 35 sports
Condensed: Skiing, Softball, Track & Field
2004/05 – 41 sports
Added: 4 Dance categories, Flag Football, Skiing category, Snowboarding
Dropped: Decathalon, Heptathalon, Pentathalon, Water Polo
De-condensed: Skiing, Softball, Track & Field
2009/10 – 42 sports
Added: Air Riflery, Rodeo, Synchronized Swimming, Water Polo
Condensed: 3 Dance categories, 2 Skiing categories
2014/15 – 53 sports
Added: Boce, Dance category, Decathalon, Heptathalon, Kayaking, Mixed Coed Valleyball,
Mountain Biking, Rugby, Sailing, Soft Tennis, Surfing,
Srcs:
The National Federation Of State High School Associations.
“1969-2014 High School Athletics Participation Survey Results.” Pp. 1, 23, 56, 112, 176, 258, 344, 418, 501.
and
“2014-15 High School Athletics Participation Survey.” Pp. 1-2
*
International Sports Federations
Wikipedia – List of international sports federations
Includes federations recognized by IOC, ASOIF, AIOWF, ARISF, IPC, and SportAccord. Many of the federations have Wikipedia pages showing the date of creation.
Topend Sports also maintains a list of international sport federations, sorted alphabetically by sport. Current total count: 171.
Note: No links to the federation websites. Links to internal pages about the sport – no date information, just short, general descriptions of the sports.
*
More Comprehensive Sports Lists
Topend Sports maintains a “Complete List of Sports from Around the World.”
The list currently has 806 entries, but no date information. Separately, they maintain a list of “Ancient and Extinct Sports.”
Topend Sports also has an interesting list of “New and Unusual Sports” submitted by readers, but I think many of the sports are just theoretical.
*
Other Resources
North American Association of Sports Economists
Journal of Sports Management
current editor: David Shilbury
Published by the North American Society For Sports Management (NASSM)
Indexed in Human Kinetic Journals
North American Society for Sport History (NASSH)
Sport In American History
group blog – primarily academic contributors
links page points to other orgs
The LA84 Foundation operates the largest sports research library in North America, the Paul Ziffren Sports Resource Center. It is a state-of-the-art research facility and learning center dedicated to the advancement of sports knowledge and scholarship. The Foundation also maintains a sizable collection of historic sport art and artifacts much of which was inherited from the former Helms Athletic Foundation Sports Halls of Fame. Its digital holdings, accessible to the public through its website, include not only a complete set of Olympic Official Reports, but also the full run of the Journal of Olympic History and its predecessor, Citius, Altius, Fortius through 2012.
[Description from ISOH]
NOTE: reference queries involving research charged $40/hour
Here’s an index to some older sports history journals available online. Seems like perhaps this should not be public, but there it is! And the full text of articles are available, but difficult to navigate (no search).
Sports and Recreation Participation
Summary
Forecast data for sports and recreation participation seems rare.
The USDA Forest Service has published a few 50-year forecasts of outdoor recreation participation. The forecasts are based on data from it’s semi-regular National Survey on Recreation and the Environment. However, the only national-level forecast I’ve seen was published in 1999. I’ve emailed the authors to inquire if more recent national forecasts have been made. (Forecasts for the southern region of the US have been made as recently as 2013).
The Bureau of Labor Statistics publishes 10-year job outlook and employment change forecasts for professional athletes. The latest figures were published December 2015.
Beyond these two forecasts, I’ve found a couple sources for historic sports participation data: the Sports & Fitness Industry Association’s “Sports Participation in America” and ”Trends in Team Sports Report” (tidbits available through press releases going back to 2007); The Physical Activity Council Report (data for 2010-2015 available, possibly going back to 2000 – emailed for more info); United Health Foundation’s annual “American’s Health Rankings” survey; the National Federation of State High School Associations’ “Athletics Participation Survey” (annual data available 1971-2014).
Data and Excerpts
Non-Professional Adult Participation
The most significant forecast data I’ve found comes from the USDA Forest Service, via a 1999 publication. Later forecasts have been made for specific regions of the US. This is the only set of national-level forecasts I’ve found.
The publication gives projections of future recreation participation (by millions of participants aged 16 and over) and consumption (by millions of days annually and by millions of primary purpose trips taken) at lo-year intervals beginning in 2000 and ending in 2050. Projections for 24 specific outdoor activities and sports are grouped as following: winter, water, wildlife, dispersed land, and developed land. The projections are given as indexes, based on the year 1995.
Two types of regional cross-sectional models were used:
– a logistic regression model (for participation)
– a negative binomial form of a count data model (for consumption)
I’ve aggregated the forecasts in this table.
The data in these projections comes from the National Survey on Recreation and the Environment (NSRE), which has been collected since 1960 (originally as the National Recreation Survey). The survey has been conducted in 1960, 1965, 1970, 1972, 1977, 1982-83, 1994-95, 1999-2001, 2005-2011 (although this report only reflects data through the 94-95 survey).
Src: J.M. Bowker, Donald B.K. English, H. Ken Cordell. 1999. “Projections Of Outdoor Recreation Participation To 2050.” In Outdoor Recreation in American Life.
Note: Emailed the authors, Bowker and Cordell March 14, 2016, to inquire about subsequent national-level projections. No reply received.
*
Sports & Fitness Industry Association (SFIA) reports
The SFIA (formerly the Sporting Goods Manufacturers Association, or SGMA) has published an annual report called “Sports Participation in America” since 2000 (data going back to 1999). The report describes participation levels in over 100 sports, recreation, and outdoor activities. Each report includes a general breakdown of the number of Americans aged 6 and older who participated in at least one of the covered sports frequently, occassionally (later: regularly or casually), or did not participate in any.
Here’s an example of the chart from the report published in 2004:
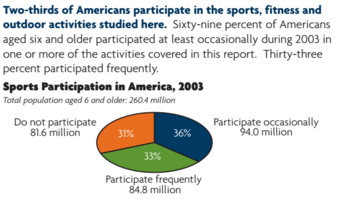
Src:
SGMA. 2004. “Sports Participation in America: 2004 Edition.” file name: Sports Part in Am 2004.pdf
I’ve seen data like the above from 1999-2003, and 2008, which is aggregated in this table, in columns C, and E-F. [Sources given in the comments for each cell.] The participation reports also gives a variety of other statistics describing the growth in participation in individual sports, including participation differences correlated with demographic characteristics.
In addition to the participation report, SFIA also publishes data describing core participants in team sports (”Trends in Team Sports Report” — tidbits available through press releases going back to 2007). The distinction of “core” indicates frequent and regular players (the threshold varies by sport/activity). This is the largest collection of core sports participation I’ve found:
Team Sports Core Participation (in thousands)

click for larger
Via: Hotel News Now, May 28, 2013
Note: Emailed Corey Bockhaus, cbockhaus@sfia.org, research@sfia.org, 3/14 to ask about older and more recent data like above. Hoping he can fill the gap in general participation data from 2004-2007, and 2009+.
*
2016 Physical Activity Council Report
Annual study tracking participation in over 120 sports. The PAC report gives overall statistics (percentages and raw figures), as well as sport-specific statistics (raw figures, and annual change percentages).
“The overall levels of inactivity decreased marginally in the last 12 months from 28.3% of Americans age six and older in 2014 to 27.7% in 2015. However, there are still 81.6 million inactive Americans.”
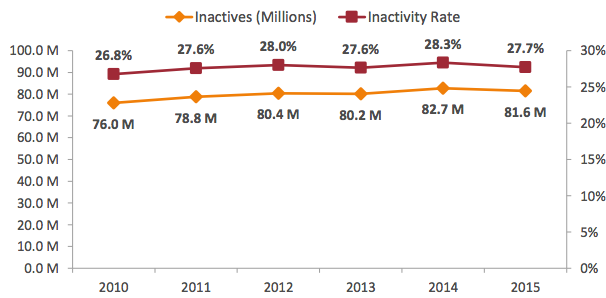
“Inactivity decreased for most age groups, with 13 to 17 year olds having the biggest drop (1.4%) and 35 to 44 year olds having the lowest decrease (0.2%) in 2015. While those Americans between the ages of 45 to 54 remained flat in inactivity, there was a gradual increase in inactivity for 55 to 64 year olds.”
212.6 million “actives” taking part in a wide range of sports and fitness activities in 2015, a slight increase from 209.3 actives in 2014.
| Total Participation Rate by Activity Category, 2015 | |
| Fitness Sports | 61.5% |
| Outdoor Sports | 48.4% |
| Individual Sports | 34.8% |
| Team Sports | 23.1% |
| Racquet Sports | 13.5% |
| Water Sports | 14.2% |
| Winter Sports | 7.4% |
| Activity Category Segmented by Generations, 2015 | |||||||
| Individual Sports | Racquet Sports | Team Sports | Outdoor Sports | Winter Sports | Water Sports | Fitness Sports | |
| Gen Z (2000+) | 48.2% | 18.8% | 58.8% | 61.8% | 13.1% | 17.5% | 50.6% |
| Millennials (1980-1999) | 43.6% | 20.2% | 31.8% | 57.4% | 12.2% | 20.3% | 66.7% |
| Gen X (1965-1979) | 36.9% | 13.4% | 17.9% | 51.4% | 7.0% | 14.8% | 66.2% |
| Boomers (1945-1964) | 24.1% | 7.1% | 6.4% | 38.6% | 2.9% | 9.2% | 60.0% |
| Fitness and Activity-Related Spending over a 5-year Span, 2015 (% of people who spent on) |
|
| Sports/recreation footwear | 45.3% |
| Sports/recreation clothing | 44% |
| Outdoor recreation activities | 39.5% |
| Sports/recreation equipment | 34.9% |
| Gym/membership fees | 29.3% |
| Travel to take part in sports & recreation | 28.1% |
| Team sports outside of school | 25% |
| Team sports at school | 20.2% |
| Individual sports events | 19.7% |
| Lessons/instruction/sports camps | 19.3% |
| Winter sports | 17.9% |
Based on 32,658 online interviews with a 95% confidence level. A weighting technique was used to balance the data to reflect the total US population ages six and above. The total population figure used was 294,141,894 people ages six and older.
“Inactivity” is defined to include those participants who reported no physical activity in 2015 and an additional
18 sports/fitness activities that require minimal to no physical exertion.
Contributions from International Health, Racquet and Sportsclub Association, The National Golf Foundation, The Outdoor Foundation, The Snowsports Industries America, The Sports and Fitness Industry Association, The Tennis Industry Association, and United States Tennis Association
The report indicates that data have been collected since 2000, but the report only shows figures going back to 2010.
Note: I’ve emailed to inquire about pre-2010 data (March 9, 2016, info@sportsmarketingsurveysusa.com).
Src: Physical Activity Council. March 1, 2016. “2016 Participation Report.”
*
| Adults reporting no physical activity or exercise outside of work in last 30 days |
|
| 2015 | 22.6% |
| 2014 | 25.3% |
| 2013 | 22.9% |
| 2012 | 26.2% |
| 2011 | 23.9% |
| 2010 | 23.8% |
| 2009 | 24.6% |
| 2008 | 22.6% |
| 2007 | 22.6% |
| 2006 | 23.8% |
| 2005 | 22.5% |
| 2004 | 22.7% |
| 2003 | 24.1% |
| 2002 | 25.4% |
| 2001 | 26.7% |
| 2000 | 27.7% |
| 1999 | 27.7% |
| 1998 | 27.8% |
| 1997 | 27.8% |
Src: United Health Foundation. “United States Physical Inactivity (1997-2015).” Accessed March 16, 2016.
*
Professional Participation
BLS – Athletes and Sports Competitors
2014
Median Pay – $43,350/year
Number of Jobs – 13,700
Job Outlook 2014-2024 – 6% (as fast as average for all occupations)
Employment change 2014-2024 – 800 more jobs
Src:
Bureau of Labor Statistics. Occupational Outlook Handbook. “Athletes and Sports Competitors.” Summary. December 17, 2015.
| Year | Total Employment |
| 1999 | 10,620 |
| 2000 | 9,920 |
| 2001 | 10,520 |
| 2002 | 10,400 |
| 2003 | 11,840 |
| 2004 | 12,250 |
| 2005 | 12,230 |
| 2006 | 12,500 |
| 2007 | 12,670 |
| 2008 | 13,960 |
| 2009 | 13,620 |
| 2010 | 12,660 |
| 2011 | 12,630 |
| 2012 | 12,450 |
| 2013 | 13,880 |
| 2014 | 11,520 |
| 2015 | 11,710 |
Src:
Bureau of Labor Statistics. Occupational Employment Statistics. “OES Data.” 1999-May 2015.
and
Bureau of Labor Statistics. Occupational Employment Statistics. “27-2021: Athletes and Sports Competitors.”
*
Student/Youth Participation
The National Federation Of State High School Associations has conducted its annual “Athletics Participation Survey” since 1971. The survey is completed by high schools with membership in the NFHS and its member associations.
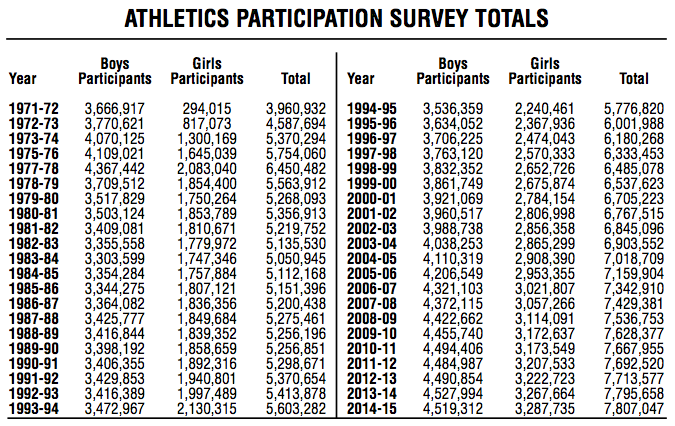
Src: National Federation of State High School Associations. “2014-15 High School Athletics Participation Survey Results.” Page 55 (page 3 of this PDF).
Press release for 2014-15 school year available here.
Excerpt:
“Based on figures from the 51 NFHS member state high school associations, which includes the District of Columbia, the number of participants in high school sports reached an all-time high of 7,807,047 – an increase of 11,389 from the previous year.”
Participation data for recent individual years available are available on the NFHS website at the “Participation Statistics” page.
Note: 3/9 Emailed Bruce Howard to ask what percentage of high school students participate in sports, and what percentage of high schools participate in their survey.
*
Among 6- to 17-year-olds, the average number of team sports played per participant has fallen 5.9 percent in the last five years, dropping from 2.14 to 2.01, according to the SFIA.
| Tracking The Changes In Youth Sports Participation (Participants by ages 6-17, thousands) |
|||
| 2009 | 2014 | % Change | |
| Baseball | 7,012 | 6,711 | -4.3% |
| Basketball | 10,404 | 9,694 | -6.8% |
| Field hockey | 438 | 370 | -15.5% |
| Football (tackle) | 3,962 | 3,254 | -17.9% |
| Football (touch) | 3,005 | 2,032 | -32.4% |
| Gymnastics | 2,510 | 2,809 | 11.9% |
| Ice hockey | 517 | 743 | 43.7% |
| Lacrosse | 624 | 804 | 28.8% |
| Rugby | 150 | 301 | 100.7% |
| Soccer (indoor) | 2,456 | 2,172 | -11.6% |
| Soccer (outdoor) | 8,360 | 7,656 | -8.4% |
| Softball (fast-pitch) | 988 | 1,004 | 1.6% |
| Softball (slow-pitch) | 1,827 | 1,622 | -11.2% |
| Track and field | 2,697 | 2,417 | -10.4% |
| Volleyball (court) | 3,420 | 2,680 | -21.6% |
| Volleyball (sand/beach) | 532 | 652 | 22.6% |
| Wrestling | 1,385 | 805 | -41.9% |
Src: SFIA, via Sports Business Daily, “2014 Trends in Team Sports,” August 10, 2015
Press release for the 2013 Trends in Team Sports available here
[no press releases for more recent reports]
Excerpt:
“Compared to 2011, which saw an increase in only 5 of the 24 sports, the surge in core participation in the most current U.S. Trends in Team Sports Report is proof of the growing trend of specialization in team sports. While there are more quality participants (core), the report also reveals the decrease in overall (casual) team sports participants over the last five years. Since 2008, team sports have lost 16.1 million participants or 11.1% of all team participants, measured by those who played at least once a year.”
2007 Edition excerpts
“While 31.6 million U.S. children (age 6-17) participate in team sports on a ‘frequent’, ‘regular’, or ‘casual’ basis, nearly 19 million U.S. children do not participate in team sports at all.”
…
“900,000 17-year olds played basketball in 2006 which means 17.9% of all 17-year olds played basketball in 2006.”
Src: SFIA. 2007. “U.S. Trends in Team Sports 2007 Edition.”
