

Ericsson: 5G impacts on sports events
Alongside November 2017’s Mobility Report, Ericsson offered some speculations on the effect 5G mobile service might have on sporting event spectators.
Excerpts:
Key findings
Growth in mobile traffic at events can be attributed to changes in user behavior, especially among younger people
Spectators now mainly share or stream live videos and engage with social networks at events, as well as increasingly creating and uploading their own content
Augmented reality (AR) and virtual reality (VR) technologies can enhance visitors’ and remote spectators’ experience of events, making them available in new ways
4G systems will continue to support event visitors with services, but in the near future, 5G technology will have the capability to transform their experience
At future events and connected venues, with high traffic density and increasing use of demanding services such as AR and VR, proactive management and automation will be essential to meet committed service levels
A range of services may be included in 5G showcases, allowing venue visitors to turn from spectators into participants and enabling them to:
Watch events from different viewpoints with interactive control
Access multiple cameras filming an object to achieve a 3D view
Experience sports activity from the perspective of the athlete via mini-cameras
Enjoy an in-stadium experience outside the venue through haptic or tactile feedback
View live holographic projections of athletes
Integrate supplementary content into their live streams
See athlete, event or venue statistics superimposed on their device display
Analyze and display performance data through sensors embedded in sports equipment
Receive real-time information on factors such as the speed and location of a ball
View overlay and substitution content, for example, explaining rules, giving more details and personalizing the experience
src:
Ericsson, Nov 2017
“From spectators to participants”
Luker on e/sports
Ask
Expert Perspective:
Recent talks/interviews with Rich Luker (ESPN Sports Poll, Luker on Trends)
Results
State of Sports for Gen Z Kids: Building Lifelong Affection in a Hyper-Competitive Market
Generation Z kids are bombarded by a tsunami of highly accessible and enticing alternatives to sports each day. What effect will this have on the long-term outlook for the professional sports industry? How can the sports industry adapt to this reality in a manner that builds a relationship TODAY so that kids will be engaged with sports tomorrow?
Rich Luker, the Founder of the ESPN Sports Poll, and Terence Burke, SVP of Research and Editor-in-Chief of KidSay’s Trend Tracker report, will describe a new alliance of the two groups and present the first, ever, “State of Sports for Generation Z” convergenceing kids from 5-17.
From Pokemon Go to Esports: Lessons and Opportunities
At the 2017 Project Play Summit, experts weigh in on how to assure more free play for kids through technology. What lessons can be learned from the popularity of Pokemon Go and esports? Moderating the session is Jeremy Goldberg, President, LeagueApps. Panelists are Angela Ruggiero, Co-Founder/Managing Director, Sports Innovation Lab; Chris Kluwe, Former NFL Punter; Vikram Grover, Senior Director of Business Development, Niantic; and Rich Luker, Founder, Luker on Trends.
Number of pro gamers vs. pro athletes
Ask
How Many:
Professional esports players (pro gamers)
Contrast with BLS data for professional athletes
Results
*
The esports players figures above do not reflect the newly developing esports leagues, of which there are at least 3:
Overwatch League (OWL) – 12 teams with 6-12 players per team
NBA 2K League – 17 teams with 6 players per team
eMLS – 19 teams (details are thin, more forthcoming)
OWL, which is being launched by game publisher Blizzard, will pay a minimum salary of $50,000 per year, with players signing up for one-year contracts at a time. On top of the base wage, players will get a share of any bonuses the team accures. Half of all tournament prize money secured by a team will be shared between the players. Teams can have between six and 12 players…There are currently seven teams in the Overwatch League, drawn from cities across the US, along with a pair of teams from South Korea and China.
src:
TechRadar, July 2017
“Want to be a pro gamer? This is what you could earn playing Overwatch”
More info on the owners and affiliated cities is reported by Engadget.
The NBA is partnering with the developer of the NBA2K game franchise to create an esports league, which will be called “NBA 2K eLeague.” According to the NBA, each of its 30 teams will eventually have its own eSports squad, just as they’re represented in the WNBA or the lower-tier D-League. Every 2K eLeague team will be made up of five human players, which the NBA plans to treat the same way it does athletes who play for the San Antonio Spurs, New York Knicks or any of its other NBA, WNBA or D-League clubs. There will be contracts and endorsement deals at stake, for instance. The main difference here is that there’s room for more diversity, since these pro players can be of any age, gender or race to play on the same court — even if it is a virtual one.
src:
Engadget, Feb 2017
“In the NBA’s eSports league, diversity means a new kind of athlete”
The NBA 2K League Qualifier took place in January, 2017.
An 85-person draft was created.
17 teams will be created at first.
Competitive salaries and benefits, plus additional options for more earnings
src:
Forbes, Dec 2017
“NBA 2K League: How To Qualify, Salary Info, Draft Process, Twitter Account, Rules And More”
*
Even before the three leagues described above launched, there have been very popular esports teams with some team members earning their livlihoods through tournament earnings, streaming income, and other play-related earnings (eg: team salaries and room and board).
Neilsen ranks the 7 most popular esports teams in the US as: Cloud9
Optic Gaming
Team Liquid
Fnatic
SK Gaming
Counter Logic Gaming
Ninjas in Pyjamas
srcs:
Nielsen, 2017.
“The Esports Playbook”
As an example, Cloud9 fields teams for 11 games. As of the time of publication for this blog entry, their 11 teams include 12 American players, as well as 6 American staff members (eg: coaches).
League of Legends: 7 American players, 2 American staff
Counter-Strike:Global Offensive: 5 American players, 3 American staff
Hearthstone: 1 American staff
*
Here’s a bit of general commentary from Sports Illustrated:
The current state of professional gaming mirrors the beginning days of the NFL and NBA. In those league’s inchoate stages, players often had to work other jobs to supplement their seasonal salaries. Even today, some professional athletes—like pro lacrosse players—hold other jobs to bolster their income. The same is true for most professional gamers.
Still, 18 gamers made more than $500,000 in esports prize money alone last year, and 195 made more than $100,000. Similar to professional golfers and tennis players, prize money makes up only a portion of the top gamers’ yearly income. Some are paid salaries by their teams, and many parlay massive followings built from live-streaming their gaming sessions into sponsorships with game equipment and manufacturing companies.
The number of full-time professional gamers is, as of right now, modest. But if esports stays on its path toward mainstream appeal and the sponsorship and TV dollars continue to flow in, it won’t be long before dozens of gamers are making more than $1 million every year. In 2017, we’ll take a step closer to that reality.
src:
Sports Illustrated, Feb 2017
“What to expect from the booming esports industry in 2017”
*
Here’s commentary from 2013 on the number of pro gamers:
Being able to subsist solely on a pro gaming salary is a lofty dream indeed. “Business Insider” and e-Sports Earnings reported that only 60 professional gamers worldwide have earned more than $100,000 in prize money, as of 2013. Speaking to “The New York Times” in 2012, Sundance Giovanni of Major League Gaming estimates that “only about 40 people in the U.S. can make a living playing video games. I’d like to get it to a hundred. I think we’re a year or two away from that.”
src:
Chron, 2013, citing NYT (inferred via archive.org)
“Salaries of Pro Gamers”
*
Here’s a bit of a profile of a pro gamer:
There’s a reason why eAthletes are so competitive—their job is easy to lose. As fun as the perks might sound, for Towey, Evil Geniuses, and hundreds of other pro gamers, the eSports life is a grind, not some glamorous dream job. Tournaments aren’t always enough to pay the bills—especially if you don’t win. That’s a big reason that some eAthletes, such as Ryan “State” Visbeck, use streaming to pay the bills.
Visbeck is a 23-year-old professional player of StarCraft II, a strategy game in which players control whole armies rather than controlling a single character as one would in Halo. As a “freelance” pro player—one who isn’t currently tied to a particular pro team—Visbeck spends his days broadcasting his StarCraft II games on streaming service Twitch. The service allows fans to watch Visbeck’s games live as he plays them, and also includes a chat function so they can interact with one another and the pro himself. Visbeck earns money through Twitch streaming subscriptions, which give viewers perks like special chat icons and access to his slate of recorded videos, as well as fan donations. It’s enough to support him as he lives in South Korea, where StarCraft has been extremely popular for more than a decade. Originally from California, Visbeck moved abroad to train with a pro StarCraft team in 2013 and has lived there ever since.
src:
ComPlex, Aug 2016
“eSports Ain’t Easy: Inside the Everyday Grind of Pro Gaming”
Ticket prices for conventional sports and esports
Ask
Extrapolate NFL ticket prices (and other major sports ticket prices)
Contrast with Esports ticket prices
Results
Note: This is all historic data. Some of this could be extrapolated, but we’d need to estimate some data values.
*
Average Ticket Price 2003-2012 for MLB, NBA, NFL, NHL
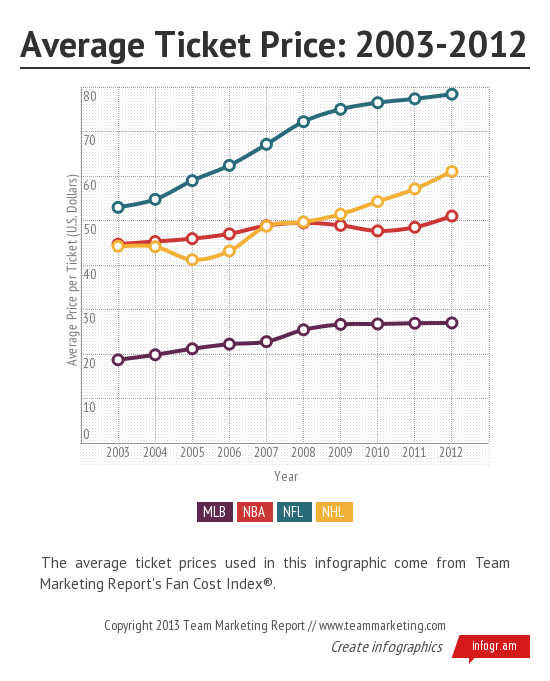
src: someone using Team Market Report data
*
Ticket prices for traditional championship games 2011-2018
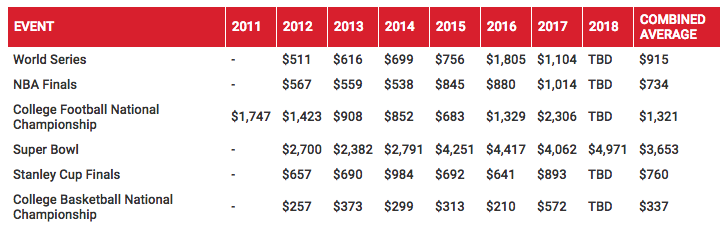
src:
VividSeats, February 2017
*
Avg NFL ticket prices 2006-2016
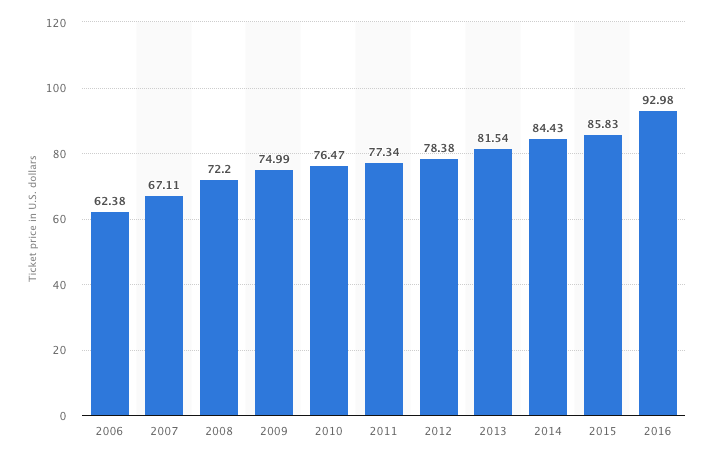
src:
Statista citing Team Marketing Report
*
Fan Cost Index 1991-2016
Fan Cost Index includes:
Two adult average price tickets
Two child average price tickets
Four small soft drinks
Two small beers
Four hot dogs
Two programs
Two adult-size caps
Parking
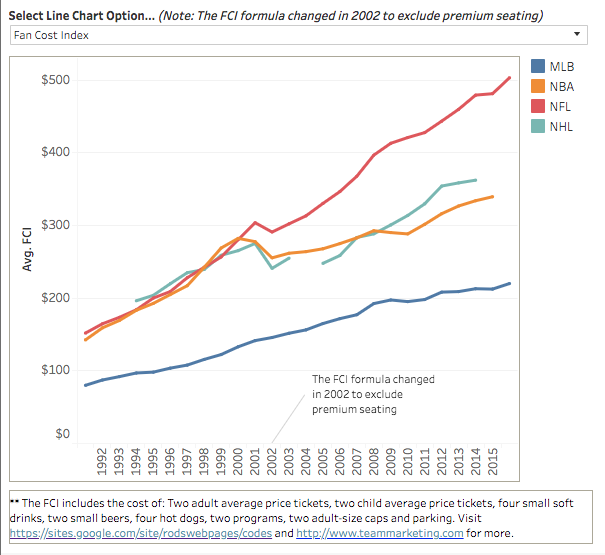
src:
Russell Scibetti, The Business of Sports, Feb 2017
using data from Team Marketing Report
Note: Scibetti also points to another source for aggregated sports business data, by Rodney Fort, Professor of Sport Management at the University of Michigan.
*
Here is a sample of recent ticket prices for major esports tournaments:
2016 League of Legends semifinals
New York, Madison Square Garden
$57-$75
src
2016 League of Legends Championship Series
Los Angeles, Staples Center
$46.50-$71/ticket
src
2017 League of Legends semifinals
Shanghai, Shanghai Oriental Sports Center
$26-$70 (limited number of international tickets)
src
2017 League of Legends Finals
Beijing, Beijing National Stadium (Bird’s Nest)
$41-$185
src
2018 North American League of Legends Championship Series – Spring Finals
two day event
Miami, The Fillmore Miami
$35-$65 for one day
$65-$110 for two days
src
2017 The International Dota 2 Championship
Seattle, KeyArena
$100-$200/ticket (multi-day event)
src
2017 Hearthstone Championship Tour’s Summer Championship
Blizzard Arena Los Angeles (450 capacity)
$15 single day
$40 full weekend
src
Historic Variety of Sports
Summary
To get a sense for the growth in the variety of commonly practiced sports, I considered which organizations would have been tracking individual sports in an official capacity. The International Olympic Committee (IOC) has a fairly long modern history, but sports included in the Olympic Games are restricted by the organizations rules, so while the IOC list certainly includes many of the most popular sports, and reflects some shifts over the last century, it certainly does not include many emerging but popular sports, or sports that are very popular in a particular region (like American football). I wrote to a number of organizations that lobby on behalf of sports that may have international federations, but lack representation in the Olympics, but I was not able to obtain historic data from any of them. I also thought to consult lists maintained by the National Federation of State High School Associations (NFHS) and the National Collegiate Athletic Association (NCAA), but these share limitations similar to the sports represented by the IOC. At the other end of the spectrum, I found one website, Topend Sports, which has a fantastic list of sports from around the world which seems quite comprehensive, but unfortunately offers no date information (either documenting when the sport was created or when it became popular).
Findings
International Olympic Committee (IOC)
Some context on IOC terminology and rules:
The IOC uses the terms “event,” “discipline” and “sport” to organize their athletic competitions. An event is any competition that results in the awarding of medals, such as the women’s 100-meter backstroke. The discipline of swimming, which comprises various events like the backstroke, breaststroke and freestyle, is a branch of the sport aquatics.
For a sport or discipline to be considered for the Summer Olympics, it must demonstrate popularity among both genders in various parts of the world. Men from at least 75 countries and women from at least 50 countries should practice a given sport on four continents.
When determining which sports to include in an Olympic program, at least 25 of the sports offered must come from the 28 sports established by the IOC. Up to three additional sports may be added that are not from among this pre-established group.
src:
Greg Soltis. July 27, 2012. “The Incredible Evolution of the Olympics.” LiveScience.
After writing to the International Society of Olympic Historians, I was referred to Bill Malon, who maintains an extensive Excel document with data from 1896-2012, including:
Number of Events per Sport by Year (by gender)
Total # of Events by Year (broken down by gender)
Total # Sports by Year (broken down by gender)
List of Sports and Events by Year (by gender)
List and Total # of Countries by Year
Mr. Malon’s Excel file (originally shared as OGCompShort.xls) is available in this Google Sheets document:
A simple list of the number of sports in each Olympic Games by year is also maintained by Topend Sports: Olympic Games Sports Changes. The list notes which sports were added or dropped in each Games.
*
Agencies That Support the IOC
SportAccord
An association composed of autonomous and independent international sports federations and other international organisations contributing to sport in various fields.
SportAccord promotes sports, increases its and its members’ recognition by the Olympic Movement, and organizes multi-sports games.
To be a Member, an organization must group together the majority of the National Federations throughout the world practicing its sport and regularly hold international competitions. To be an Associate Member, an organization can either group together the activities of several Members or National Olympic Committees for the purpose of organizing competitions, or have objectives recognized by the Council as benefiting the other Members of the Association.
(Previously known as GAISF, the General Association of International Sports Federations.)
src: SportAccord. “2014 Statutes.” Accessed April 7, 2016.
Members list – 106 members
Contact: sportaccord@sportaccord.com
EMAILED 4/13. No reply.
Also sent inquires to The Association of IOC Recognised International Sports Federations (ARISF), info@arisf.org, and the Alliance of Independent Recognised Members of Sport (AIMS), contact form. No reply from them either.
*
Sports counted in the NFHS Annual Survey, 1969-2015
Counting each sport that gets its own major subject heading in the tables. For example, “Skiing — Alpine” and “Skiing — Cross Country” count for a total of two sports. However, “Football — 11-player”, which often includes three subheadings (“6-player,” “8-player,” and “9-player”), is only counted once. “Flag Football,” with its own heading is counted separately from “Football — 11-Player.”
For example:
[NFHS-skiing-headings.png]
…
NFHS-football-headings.png
Note: Each of the annual surveys are freely available, but this is a sampling of every five years.
1969/70 – 29 sports
1975/76 – 31 sports
Added: Archery, Drill Teams, Table Tennis, Weightlifting
Dropped: Rowing, Rugger
1980 – 36 sports
Added: Canoeing, Crew, Eskimo Games, Judo, Soft Tennis, second Softball category
Dropped: Rugby
1985 – 31 sports
Dropped: Curling, Drill Teams, Eskimo Games, Soft Tennis, Table Tennis
Added: Equestrian, Heptathalon
Condensed to one entry each: Softball, Track & Field
1990 – 32 sports
Added: Other
1995 – 38 sports
Added: Adapted Sports, Competitive Spirit Squads, Team Tennis,
De-condensed: Skiing, Softball, Track & Field
2000 – 35 sports
Condensed: Skiing, Softball, Track & Field
2004/05 – 41 sports
Added: 4 Dance categories, Flag Football, Skiing category, Snowboarding
Dropped: Decathalon, Heptathalon, Pentathalon, Water Polo
De-condensed: Skiing, Softball, Track & Field
2009/10 – 42 sports
Added: Air Riflery, Rodeo, Synchronized Swimming, Water Polo
Condensed: 3 Dance categories, 2 Skiing categories
2014/15 – 53 sports
Added: Boce, Dance category, Decathalon, Heptathalon, Kayaking, Mixed Coed Valleyball,
Mountain Biking, Rugby, Sailing, Soft Tennis, Surfing,
Srcs:
The National Federation Of State High School Associations.
“1969-2014 High School Athletics Participation Survey Results.” Pp. 1, 23, 56, 112, 176, 258, 344, 418, 501.
and
“2014-15 High School Athletics Participation Survey.” Pp. 1-2
*
International Sports Federations
Wikipedia – List of international sports federations
Includes federations recognized by IOC, ASOIF, AIOWF, ARISF, IPC, and SportAccord. Many of the federations have Wikipedia pages showing the date of creation.
Topend Sports also maintains a list of international sport federations, sorted alphabetically by sport. Current total count: 171.
Note: No links to the federation websites. Links to internal pages about the sport – no date information, just short, general descriptions of the sports.
*
More Comprehensive Sports Lists
Topend Sports maintains a “Complete List of Sports from Around the World.”
The list currently has 806 entries, but no date information. Separately, they maintain a list of “Ancient and Extinct Sports.”
Topend Sports also has an interesting list of “New and Unusual Sports” submitted by readers, but I think many of the sports are just theoretical.
*
Other Resources
North American Association of Sports Economists
Journal of Sports Management
current editor: David Shilbury
Published by the North American Society For Sports Management (NASSM)
Indexed in Human Kinetic Journals
North American Society for Sport History (NASSH)
Sport In American History
group blog – primarily academic contributors
links page points to other orgs
The LA84 Foundation operates the largest sports research library in North America, the Paul Ziffren Sports Resource Center. It is a state-of-the-art research facility and learning center dedicated to the advancement of sports knowledge and scholarship. The Foundation also maintains a sizable collection of historic sport art and artifacts much of which was inherited from the former Helms Athletic Foundation Sports Halls of Fame. Its digital holdings, accessible to the public through its website, include not only a complete set of Olympic Official Reports, but also the full run of the Journal of Olympic History and its predecessor, Citius, Altius, Fortius through 2012.
[Description from ISOH]
NOTE: reference queries involving research charged $40/hour
Here’s an index to some older sports history journals available online. Seems like perhaps this should not be public, but there it is! And the full text of articles are available, but difficult to navigate (no search).
Sports and Recreation Participation
Summary
Forecast data for sports and recreation participation seems rare.
The USDA Forest Service has published a few 50-year forecasts of outdoor recreation participation. The forecasts are based on data from it’s semi-regular National Survey on Recreation and the Environment. However, the only national-level forecast I’ve seen was published in 1999. I’ve emailed the authors to inquire if more recent national forecasts have been made. (Forecasts for the southern region of the US have been made as recently as 2013).
The Bureau of Labor Statistics publishes 10-year job outlook and employment change forecasts for professional athletes. The latest figures were published December 2015.
Beyond these two forecasts, I’ve found a couple sources for historic sports participation data: the Sports & Fitness Industry Association’s “Sports Participation in America” and ”Trends in Team Sports Report” (tidbits available through press releases going back to 2007); The Physical Activity Council Report (data for 2010-2015 available, possibly going back to 2000 – emailed for more info); United Health Foundation’s annual “American’s Health Rankings” survey; the National Federation of State High School Associations’ “Athletics Participation Survey” (annual data available 1971-2014).
Data and Excerpts
Non-Professional Adult Participation
The most significant forecast data I’ve found comes from the USDA Forest Service, via a 1999 publication. Later forecasts have been made for specific regions of the US. This is the only set of national-level forecasts I’ve found.
The publication gives projections of future recreation participation (by millions of participants aged 16 and over) and consumption (by millions of days annually and by millions of primary purpose trips taken) at lo-year intervals beginning in 2000 and ending in 2050. Projections for 24 specific outdoor activities and sports are grouped as following: winter, water, wildlife, dispersed land, and developed land. The projections are given as indexes, based on the year 1995.
Two types of regional cross-sectional models were used:
– a logistic regression model (for participation)
– a negative binomial form of a count data model (for consumption)
I’ve aggregated the forecasts in this table.
The data in these projections comes from the National Survey on Recreation and the Environment (NSRE), which has been collected since 1960 (originally as the National Recreation Survey). The survey has been conducted in 1960, 1965, 1970, 1972, 1977, 1982-83, 1994-95, 1999-2001, 2005-2011 (although this report only reflects data through the 94-95 survey).
Src: J.M. Bowker, Donald B.K. English, H. Ken Cordell. 1999. “Projections Of Outdoor Recreation Participation To 2050.” In Outdoor Recreation in American Life.
Note: Emailed the authors, Bowker and Cordell March 14, 2016, to inquire about subsequent national-level projections. No reply received.
*
Sports & Fitness Industry Association (SFIA) reports
The SFIA (formerly the Sporting Goods Manufacturers Association, or SGMA) has published an annual report called “Sports Participation in America” since 2000 (data going back to 1999). The report describes participation levels in over 100 sports, recreation, and outdoor activities. Each report includes a general breakdown of the number of Americans aged 6 and older who participated in at least one of the covered sports frequently, occassionally (later: regularly or casually), or did not participate in any.
Here’s an example of the chart from the report published in 2004:
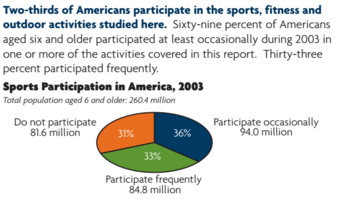
Src:
SGMA. 2004. “Sports Participation in America: 2004 Edition.” file name: Sports Part in Am 2004.pdf
I’ve seen data like the above from 1999-2003, and 2008, which is aggregated in this table, in columns C, and E-F. [Sources given in the comments for each cell.] The participation reports also gives a variety of other statistics describing the growth in participation in individual sports, including participation differences correlated with demographic characteristics.
In addition to the participation report, SFIA also publishes data describing core participants in team sports (”Trends in Team Sports Report” — tidbits available through press releases going back to 2007). The distinction of “core” indicates frequent and regular players (the threshold varies by sport/activity). This is the largest collection of core sports participation I’ve found:
Team Sports Core Participation (in thousands)

click for larger
Via: Hotel News Now, May 28, 2013
Note: Emailed Corey Bockhaus, cbockhaus@sfia.org, research@sfia.org, 3/14 to ask about older and more recent data like above. Hoping he can fill the gap in general participation data from 2004-2007, and 2009+.
*
2016 Physical Activity Council Report
Annual study tracking participation in over 120 sports. The PAC report gives overall statistics (percentages and raw figures), as well as sport-specific statistics (raw figures, and annual change percentages).
“The overall levels of inactivity decreased marginally in the last 12 months from 28.3% of Americans age six and older in 2014 to 27.7% in 2015. However, there are still 81.6 million inactive Americans.”
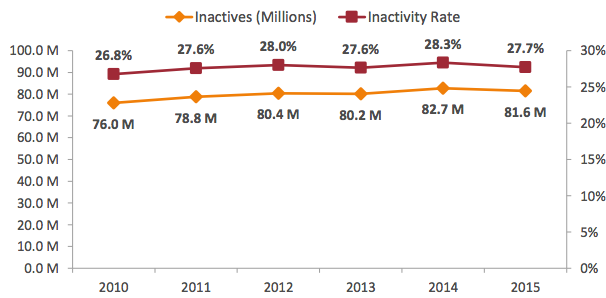
“Inactivity decreased for most age groups, with 13 to 17 year olds having the biggest drop (1.4%) and 35 to 44 year olds having the lowest decrease (0.2%) in 2015. While those Americans between the ages of 45 to 54 remained flat in inactivity, there was a gradual increase in inactivity for 55 to 64 year olds.”
212.6 million “actives” taking part in a wide range of sports and fitness activities in 2015, a slight increase from 209.3 actives in 2014.
| Total Participation Rate by Activity Category, 2015 | |
| Fitness Sports | 61.5% |
| Outdoor Sports | 48.4% |
| Individual Sports | 34.8% |
| Team Sports | 23.1% |
| Racquet Sports | 13.5% |
| Water Sports | 14.2% |
| Winter Sports | 7.4% |
| Activity Category Segmented by Generations, 2015 | |||||||
| Individual Sports | Racquet Sports | Team Sports | Outdoor Sports | Winter Sports | Water Sports | Fitness Sports | |
| Gen Z (2000+) | 48.2% | 18.8% | 58.8% | 61.8% | 13.1% | 17.5% | 50.6% |
| Millennials (1980-1999) | 43.6% | 20.2% | 31.8% | 57.4% | 12.2% | 20.3% | 66.7% |
| Gen X (1965-1979) | 36.9% | 13.4% | 17.9% | 51.4% | 7.0% | 14.8% | 66.2% |
| Boomers (1945-1964) | 24.1% | 7.1% | 6.4% | 38.6% | 2.9% | 9.2% | 60.0% |
| Fitness and Activity-Related Spending over a 5-year Span, 2015 (% of people who spent on) |
|
| Sports/recreation footwear | 45.3% |
| Sports/recreation clothing | 44% |
| Outdoor recreation activities | 39.5% |
| Sports/recreation equipment | 34.9% |
| Gym/membership fees | 29.3% |
| Travel to take part in sports & recreation | 28.1% |
| Team sports outside of school | 25% |
| Team sports at school | 20.2% |
| Individual sports events | 19.7% |
| Lessons/instruction/sports camps | 19.3% |
| Winter sports | 17.9% |
Based on 32,658 online interviews with a 95% confidence level. A weighting technique was used to balance the data to reflect the total US population ages six and above. The total population figure used was 294,141,894 people ages six and older.
“Inactivity” is defined to include those participants who reported no physical activity in 2015 and an additional
18 sports/fitness activities that require minimal to no physical exertion.
Contributions from International Health, Racquet and Sportsclub Association, The National Golf Foundation, The Outdoor Foundation, The Snowsports Industries America, The Sports and Fitness Industry Association, The Tennis Industry Association, and United States Tennis Association
The report indicates that data have been collected since 2000, but the report only shows figures going back to 2010.
Note: I’ve emailed to inquire about pre-2010 data (March 9, 2016, info@sportsmarketingsurveysusa.com).
Src: Physical Activity Council. March 1, 2016. “2016 Participation Report.”
*
| Adults reporting no physical activity or exercise outside of work in last 30 days |
|
| 2015 | 22.6% |
| 2014 | 25.3% |
| 2013 | 22.9% |
| 2012 | 26.2% |
| 2011 | 23.9% |
| 2010 | 23.8% |
| 2009 | 24.6% |
| 2008 | 22.6% |
| 2007 | 22.6% |
| 2006 | 23.8% |
| 2005 | 22.5% |
| 2004 | 22.7% |
| 2003 | 24.1% |
| 2002 | 25.4% |
| 2001 | 26.7% |
| 2000 | 27.7% |
| 1999 | 27.7% |
| 1998 | 27.8% |
| 1997 | 27.8% |
Src: United Health Foundation. “United States Physical Inactivity (1997-2015).” Accessed March 16, 2016.
*
Professional Participation
BLS – Athletes and Sports Competitors
2014
Median Pay – $43,350/year
Number of Jobs – 13,700
Job Outlook 2014-2024 – 6% (as fast as average for all occupations)
Employment change 2014-2024 – 800 more jobs
Src:
Bureau of Labor Statistics. Occupational Outlook Handbook. “Athletes and Sports Competitors.” Summary. December 17, 2015.
| Year | Total Employment |
| 1999 | 10,620 |
| 2000 | 9,920 |
| 2001 | 10,520 |
| 2002 | 10,400 |
| 2003 | 11,840 |
| 2004 | 12,250 |
| 2005 | 12,230 |
| 2006 | 12,500 |
| 2007 | 12,670 |
| 2008 | 13,960 |
| 2009 | 13,620 |
| 2010 | 12,660 |
| 2011 | 12,630 |
| 2012 | 12,450 |
| 2013 | 13,880 |
| 2014 | 11,520 |
| 2015 | 11,710 |
Src:
Bureau of Labor Statistics. Occupational Employment Statistics. “OES Data.” 1999-May 2015.
and
Bureau of Labor Statistics. Occupational Employment Statistics. “27-2021: Athletes and Sports Competitors.”
*
Student/Youth Participation
The National Federation Of State High School Associations has conducted its annual “Athletics Participation Survey” since 1971. The survey is completed by high schools with membership in the NFHS and its member associations.
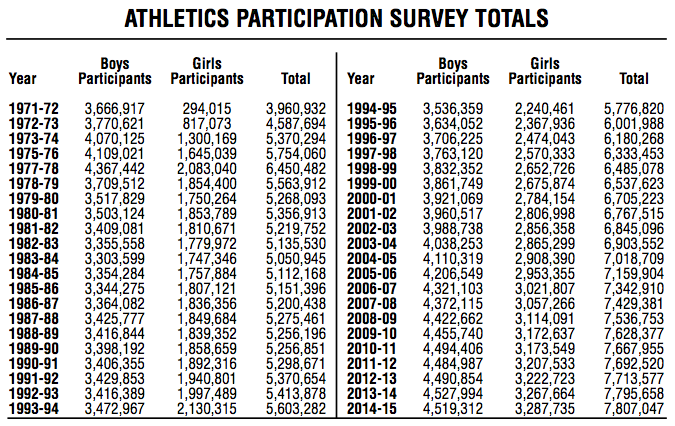
Src: National Federation of State High School Associations. “2014-15 High School Athletics Participation Survey Results.” Page 55 (page 3 of this PDF).
Press release for 2014-15 school year available here.
Excerpt:
“Based on figures from the 51 NFHS member state high school associations, which includes the District of Columbia, the number of participants in high school sports reached an all-time high of 7,807,047 – an increase of 11,389 from the previous year.”
Participation data for recent individual years available are available on the NFHS website at the “Participation Statistics” page.
Note: 3/9 Emailed Bruce Howard to ask what percentage of high school students participate in sports, and what percentage of high schools participate in their survey.
*
Among 6- to 17-year-olds, the average number of team sports played per participant has fallen 5.9 percent in the last five years, dropping from 2.14 to 2.01, according to the SFIA.
| Tracking The Changes In Youth Sports Participation (Participants by ages 6-17, thousands) |
|||
| 2009 | 2014 | % Change | |
| Baseball | 7,012 | 6,711 | -4.3% |
| Basketball | 10,404 | 9,694 | -6.8% |
| Field hockey | 438 | 370 | -15.5% |
| Football (tackle) | 3,962 | 3,254 | -17.9% |
| Football (touch) | 3,005 | 2,032 | -32.4% |
| Gymnastics | 2,510 | 2,809 | 11.9% |
| Ice hockey | 517 | 743 | 43.7% |
| Lacrosse | 624 | 804 | 28.8% |
| Rugby | 150 | 301 | 100.7% |
| Soccer (indoor) | 2,456 | 2,172 | -11.6% |
| Soccer (outdoor) | 8,360 | 7,656 | -8.4% |
| Softball (fast-pitch) | 988 | 1,004 | 1.6% |
| Softball (slow-pitch) | 1,827 | 1,622 | -11.2% |
| Track and field | 2,697 | 2,417 | -10.4% |
| Volleyball (court) | 3,420 | 2,680 | -21.6% |
| Volleyball (sand/beach) | 532 | 652 | 22.6% |
| Wrestling | 1,385 | 805 | -41.9% |
Src: SFIA, via Sports Business Daily, “2014 Trends in Team Sports,” August 10, 2015
Press release for the 2013 Trends in Team Sports available here
[no press releases for more recent reports]
Excerpt:
“Compared to 2011, which saw an increase in only 5 of the 24 sports, the surge in core participation in the most current U.S. Trends in Team Sports Report is proof of the growing trend of specialization in team sports. While there are more quality participants (core), the report also reveals the decrease in overall (casual) team sports participants over the last five years. Since 2008, team sports have lost 16.1 million participants or 11.1% of all team participants, measured by those who played at least once a year.”
2007 Edition excerpts
“While 31.6 million U.S. children (age 6-17) participate in team sports on a ‘frequent’, ‘regular’, or ‘casual’ basis, nearly 19 million U.S. children do not participate in team sports at all.”
…
“900,000 17-year olds played basketball in 2006 which means 17.9% of all 17-year olds played basketball in 2006.”
Src: SFIA. 2007. “U.S. Trends in Team Sports 2007 Edition.”
Future of Sports

Src: USA Today
A report consulting leading futurists presents a picture of what professional sports might be like in the next 25 years. Predictions are made in three increments (1-5 years, 5-10 years, 10-25 years), but the editors stress that the report only describes a possible future, not a most likely scenario. It is intended to be a conversation starter, and should not be read as a high-confidence forecast. The report covers eleven facets of the industry, including facilities, venues, players, fans, etc. The report was commissioned by the operator of a global food service and hospitality company and owner of a major professional team.
The full report is available for free, but here are highlights by chapter:
1-5 years: genetic screening
5-10 years: genetic enhancements
10-25 years: natural & enhanced athletes
“Safe and detectable drugs that boost key physiological factors to specific, pre-determined amounts will be legal and will level the playing field for all. Success will be determined more by character, teamwork, strategy, and the mental edge than by the genetic lottery. In this sense, sports will become a purer test than we have today.”
The carefully managed genetic enhancements might allow for:
increased red blood cell count for better oxygen delivery
stamina increased 60%
muscle mass doubled
pain pathways blocked
skeletal density increased
Enhanced athletes and natural athletes might compete in separate leagues, with the leagues meeting in championship games between natural and enhanced players.
All players will also be enhanced by courts/fields that increase performance.
1-5 years: demand for data flow (via smart phones, etc)
5-10 years: video advances
10-25 years: urban integration
Video walls in stadium architecture; on-field holographic replays, glasses-free 3D tech in luxury boxes; VR rides in the stadium for fans.
Smaller stadium footprints, enabled by self-driving self-parking cars and high-speed mass transit, allow stadiums to be built in city centers; modular/adaptable construction for variety of events; variety of fan areas.
More alcohol sales (enabled by driverless cars, mass transit); more security cameras, facial recognition.
1-5 years: the death of one-size-fits-all broadcasting (variety of consump options; Google likely buys rights for a major league)
5-10 years: divergence (news content comes from leagues, franchises, players, fans)
10-25 years: the convergence (fans re-integrate content from various sources and share)
Major networks lose control over content (to leagues, players, franchises, fans).
Influence of network commentators and journalists wanes due to social media access.
Major online platform (probably Google) buys multiyear broadcast rights for a league.
Fans access content from many sources all at once.
Fans integrate these streams into seamless, coherent, personalized viewing experiences.
Watch a game via VR headset from the perspective of your favorite player.
1-5 years: talent ecosystem emerges
5-10 years: better controllers
10-25 years: indistinguishable remote and in-person gameplay
Celebrity gamers challenge traditional sports stars for adulation.
Pro sports leagues embrace gaming.
Talent eco-systems supporting esports (coaches, high school teams, ranking, etc).
Hand-held controllers replaced by body movement and sensors.
Tactile feedback interfaces and AR/VR enable remote play.
1-5 years: increasingly responsive
5-10 years: fan-recorded content
10-25 years: increased fan input (extension of 1-5yr forecast above – more strategy decisions, like scouting)
Forced crowdsourcing of critical decisions, like whether to fire a player or coach after a scandal.
When every fan is wearing a high-quality video device, fans become a prime source for broadcast and replay material.
Team-designated ombudsmen will represent fans in major team decisions, and complex algorithms will predict fan reactions.
1-5 years: extreme sports league
5-10 years: robot experiments
10-25 years: sports zones
Extreme sports will adapt a more formalized competition format.
Robot trials will be run before humans perform to improve safety. Later, robotic exoskeletons and self-powered body suits further reduce injuries and death.
Designated competition areas in national wilderness areas.
1-5 years: move to digital
5-10 years: paper tickets go away (Apple establishes its own banking technology)
10-25 years: end of the line (no standing in lines for anything)
Leagues with their own digital currencies (probably NOT based on Bitcoin).
Seats chosen based on social media contacts, and social goals (families together, singles together, etc).
1-5years: women’s sports apparel expansion
5-10 years: job displacement
10-25 years: increased displacement of low-end workforce
Marketing focuses more on upper-mid-class women as mid-class wealth wanes.
As more fans are priced out of live games, “third venues” emerge. AR enables life-size replays up close in 3D theatrical venues
Src:
“The Future of Sports.” Josh McHugh, Po Bronson, Ethan Watters (editors). September 2015. Delaware North.
Acknowledgements:
Singularity University (Paul Saffo, Salim Ismail, Aaron Frank), Kamran Rosen (reporting and research), Gary Bettman, Wendy Selig, Ted Leonsis, Future Cities Lab, Clay Coffey, Luke Bronson, Blaise Zerega, SF Elite Academy, Rick Abramson, Amy Latimer, Todd Merry, Chuck Moran, John Wentzell, Garrett Law, Peter White, Roger Noll, Mark Charles, Margaret Johnson
For background on the motivation for the report, see:
“Bruins owner spearheads report on what sports will look like in 25 years.” Erik Brady. January 26, 2016. USA Today.
*
Many of the ideas above are echoed in a May 2015 article from the Stanford Graduate School of Business. In particular we’re already seeing line-optimization, seat-optimization, on-demand on-device replays, big growth in digital tickets, women and children as a key demographic.
Src:
“Five Trends Shaping the Future of Sports.” Ian Chipman. May 2015. Stanford Graduate School of Business
